
|
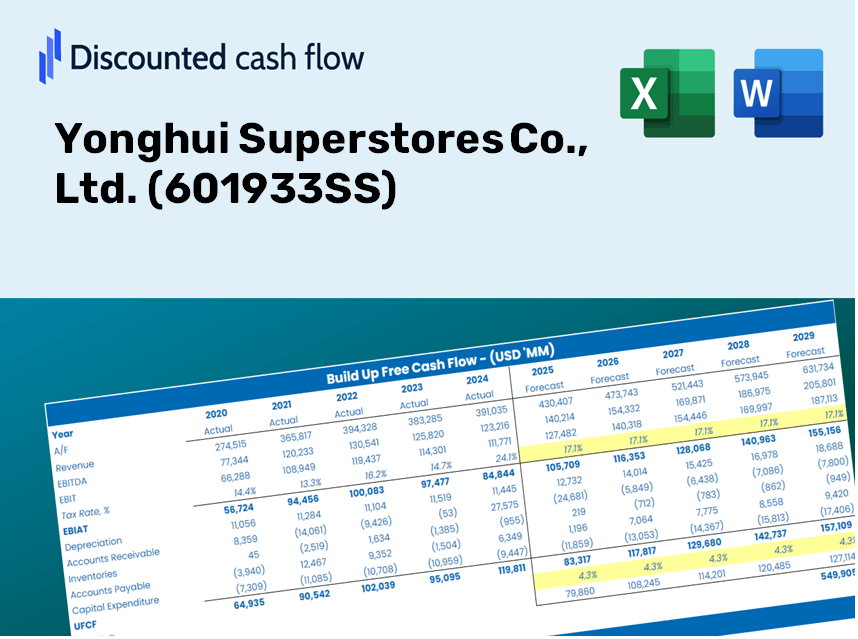
Yonghui Superstores Co., Ltd. (601933.SS) DCF Valuation |
Fully Editable: Tailor To Your Needs In Excel Or Sheets
Professional Design: Trusted, Industry-Standard Templates
Investor-Approved Valuation Models
MAC/PC Compatible, Fully Unlocked
No Expertise Is Needed; Easy To Follow
Yonghui Superstores Co., Ltd. (601933.SS) Bundle
Explore the financial potential of Yonghui Superstores Co., Ltd. (601933SS) with our user-friendly DCF Calculator! Enter your projections for growth, margins, and expenses to determine the intrinsic value of Yonghui Superstores Co., Ltd. (601933SS) and refine your investment strategy.
Discounted Cash Flow (DCF) - (USD MM)
| Year | AY1 2020 |
AY2 2021 |
AY3 2022 |
AY4 2023 |
AY5 2024 |
FY1 2025 |
FY2 2026 |
FY3 2027 |
FY4 2028 |
FY5 2029 |
|---|---|---|---|---|---|---|---|---|---|---|
| Revenue | 93,199.1 | 91,061.9 | 90,090.8 | 78,642.2 | 67,573.8 | 62,481.8 | 57,773.6 | 53,420.1 | 49,394.6 | 45,672.5 |
| Revenue Growth, % | 0 | -2.29 | -1.07 | -12.71 | -14.07 | -7.54 | -7.54 | -7.54 | -7.54 | -7.54 |
| EBITDA | 2,800.5 | -1,295.7 | 152.3 | 541.7 | -868.6 | 144.3 | 133.4 | 123.4 | 114.1 | 105.5 |
| EBITDA, % | 3 | -1.42 | 0.16902 | 0.68886 | -1.29 | 0.23091 | 0.23091 | 0.23091 | 0.23091 | 0.23091 |
| Depreciation | 1,018.0 | 1,228.4 | 1,131.5 | 997.3 | 557.9 | 723.7 | 669.1 | 618.7 | 572.1 | 529.0 |
| Depreciation, % | 1.09 | 1.35 | 1.26 | 1.27 | 0.82559 | 1.16 | 1.16 | 1.16 | 1.16 | 1.16 |
| EBIT | 1,782.5 | -2,524.0 | -979.2 | -455.6 | -1,426.4 | -579.4 | -535.7 | -495.4 | -458.0 | -423.5 |
| EBIT, % | 1.91 | -2.77 | -1.09 | -0.57932 | -2.11 | -0.92729 | -0.92729 | -0.92729 | -0.92729 | -0.92729 |
| Total Cash | 12,246.9 | 10,724.0 | 8,506.8 | 6,575.0 | 7,286.7 | 6,686.0 | 6,182.2 | 5,716.3 | 5,285.6 | 4,887.3 |
| Total Cash, percent | .0 | .0 | .0 | .0 | .0 | .0 | .0 | .0 | .0 | .0 |
| Account Receivables | 3,157.6 | 1,219.4 | 1,180.3 | 985.7 | 654.8 | 1,032.2 | 954.4 | 882.5 | 816.0 | 754.5 |
| Account Receivables, % | 3.39 | 1.34 | 1.31 | 1.25 | 0.96909 | 1.65 | 1.65 | 1.65 | 1.65 | 1.65 |
| Inventories | 10,881.7 | 10,791.5 | 10,466.6 | 8,269.0 | 7,058.4 | 7,011.0 | 6,482.7 | 5,994.2 | 5,542.5 | 5,124.9 |
| Inventories, % | 11.68 | 11.85 | 11.62 | 10.51 | 10.45 | 11.22 | 11.22 | 11.22 | 11.22 | 11.22 |
| Accounts Payable | 12,513.7 | 12,551.6 | 12,155.4 | 9,816.3 | 8,121.1 | 8,148.0 | 7,534.0 | 6,966.3 | 6,441.4 | 5,956.0 |
| Accounts Payable, % | 13.43 | 13.78 | 13.49 | 12.48 | 12.02 | 13.04 | 13.04 | 13.04 | 13.04 | 13.04 |
| Capital Expenditure | -2,086.5 | -2,010.2 | -1,203.7 | -671.4 | -475.3 | -917.2 | -848.1 | -784.2 | -725.1 | -670.4 |
| Capital Expenditure, % | -2.24 | -2.21 | -1.34 | -0.8538 | -0.70339 | -1.47 | -1.47 | -1.47 | -1.47 | -1.47 |
| Tax Rate, % | 10.85 | 10.85 | 10.85 | 10.85 | 10.85 | 10.85 | 10.85 | 10.85 | 10.85 | 10.85 |
| EBITAT | 1,471.2 | -2,108.1 | -840.7 | -444.8 | -1,271.7 | -508.3 | -470.0 | -434.6 | -401.9 | -371.6 |
| Depreciation | ||||||||||
| Changes in Account Receivables | ||||||||||
| Changes in Inventories | ||||||||||
| Changes in Accounts Payable | ||||||||||
| Capital Expenditure | ||||||||||
| UFCF | -1,122.9 | -823.6 | -945.0 | -65.9 | -1,342.8 | -1,004.9 | -656.9 | -607.4 | -561.6 | -519.3 |
| WACC, % | 5.38 | 5.4 | 5.45 | 5.68 | 5.51 | 5.48 | 5.48 | 5.48 | 5.48 | 5.48 |
| PV UFCF | ||||||||||
| SUM PV UFCF | -2,911.8 | |||||||||
| Long Term Growth Rate, % | 3.50 | |||||||||
| Free cash flow (T + 1) | -537 | |||||||||
| Terminal Value | -27,111 | |||||||||
| Present Terminal Value | -20,761 | |||||||||
| Enterprise Value | -23,673 | |||||||||
| Net Debt | 16,442 | |||||||||
| Equity Value | -40,115 | |||||||||
| Diluted Shares Outstanding, MM | 9,159 | |||||||||
| Equity Value Per Share | -4.38 |
What You Will Receive
- Adjustable Forecast Parameters: Seamlessly modify variables (growth %, margins, WACC) to explore various scenarios.
- Actual Market Data: Yonghui Superstores’ financial information pre-loaded to enhance your analysis.
- Instant DCF Calculations: The template automatically computes Net Present Value (NPV) and intrinsic value for you.
- Tailored and Professional: A refined Excel model designed to meet your valuation requirements.
- Designed for Analysts and Investors: Perfect for evaluating projections, confirming strategies, and optimizing efficiency.
Key Features
- Customizable Financial Inputs: Adjust essential metrics such as sales growth, net profit margin, and operating expenses.
- Instant DCF Valuation: Automatically computes intrinsic value, NPV, and other financial metrics in real-time.
- High-Precision Accuracy: Relies on Yonghui Superstores' actual financial data to deliver realistic valuation results.
- Seamless Scenario Planning: Effortlessly evaluate various assumptions and analyze their impacts on outcomes.
- Efficiency Booster: Saves time by avoiding the need to create intricate valuation models from the ground up.
How It Functions
- 1. Access the Template: Download and open the Excel file containing Yonghui Superstores Co., Ltd. (601933SS) preloaded data.
- 2. Modify Assumptions: Adjust crucial inputs such as growth rates, WACC, and capital expenditures.
- 3. Analyze Results in Real-Time: The DCF model automatically computes intrinsic value and NPV.
- 4. Explore Scenarios: Evaluate various forecasts to investigate different valuation results.
- 5. Present with Confidence: Deliver professional valuation insights to enhance your decision-making.
Why Choose This Calculator for Yonghui Superstores Co., Ltd. (601933SS)?
- User-Friendly Interface: Perfectly suited for both novices and seasoned analysts.
- Customizable Inputs: Adjust parameters easily to better suit your evaluation.
- Real-Time Insights: Observe immediate adjustments to Yonghui’s valuation as you modify inputs.
- Preconfigured Data: Comes with Yonghui’s actual financial metrics for swift assessments.
- Relied Upon by Experts: Endorsed by investors and analysts for making well-informed choices.
Who Can Benefit from This Product?
- Investors: Determine the fair value of Yonghui Superstores Co., Ltd. (601933SS) to make informed investment choices.
- CFOs: Utilize a high-quality DCF model for accurate financial reporting and analysis.
- Consultants: Easily modify the template for client valuation reports related to Yonghui Superstores.
- Entrepreneurs: Discover financial modeling techniques employed by leading retail companies.
- Educators: Implement this resource as a teaching aid to illustrate valuation strategies.
Contents of the Template
- Pre-Filled DCF Model: Yonghui Superstores' financial data preloaded for immediate application.
- WACC Calculator: Comprehensive calculations for the Weighted Average Cost of Capital.
- Financial Ratios: Assess Yonghui's profitability, leverage, and operational efficiency.
- Editable Inputs: Modify assumptions such as growth rates, margins, and capital expenditures to suit your scenarios.
- Financial Statements: Annual and quarterly reports provided to facilitate in-depth analysis.
- Interactive Dashboard: Effortlessly visualize key valuation metrics and outcomes.
Disclaimer
All information, articles, and product details provided on this website are for general informational and educational purposes only. We do not claim any ownership over, nor do we intend to infringe upon, any trademarks, copyrights, logos, brand names, or other intellectual property mentioned or depicted on this site. Such intellectual property remains the property of its respective owners, and any references here are made solely for identification or informational purposes, without implying any affiliation, endorsement, or partnership.
We make no representations or warranties, express or implied, regarding the accuracy, completeness, or suitability of any content or products presented. Nothing on this website should be construed as legal, tax, investment, financial, medical, or other professional advice. In addition, no part of this site—including articles or product references—constitutes a solicitation, recommendation, endorsement, advertisement, or offer to buy or sell any securities, franchises, or other financial instruments, particularly in jurisdictions where such activity would be unlawful.
All content is of a general nature and may not address the specific circumstances of any individual or entity. It is not a substitute for professional advice or services. Any actions you take based on the information provided here are strictly at your own risk. You accept full responsibility for any decisions or outcomes arising from your use of this website and agree to release us from any liability in connection with your use of, or reliance upon, the content or products found herein.