
|
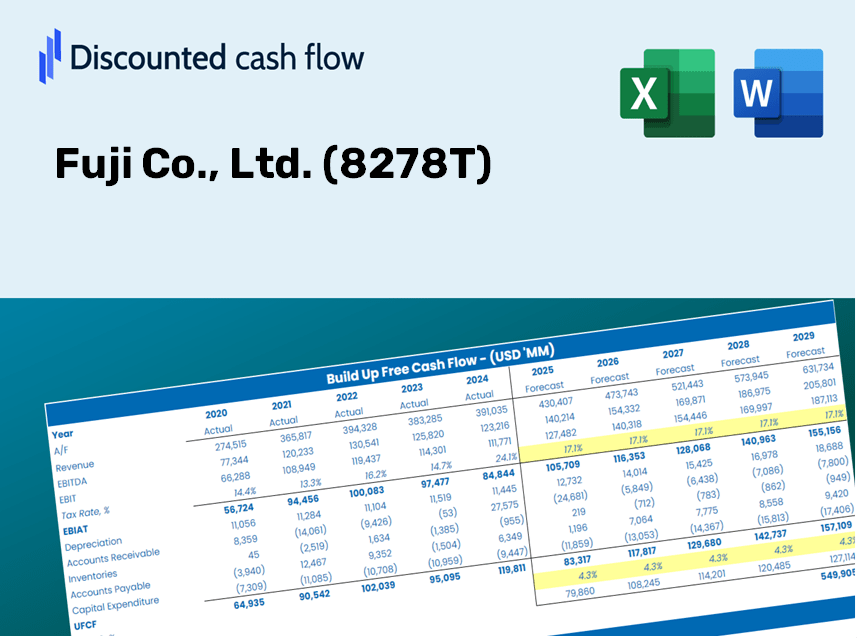
Fuji Co., Ltd. (8278.T) DCF Valuation |
Fully Editable: Tailor To Your Needs In Excel Or Sheets
Professional Design: Trusted, Industry-Standard Templates
Investor-Approved Valuation Models
MAC/PC Compatible, Fully Unlocked
No Expertise Is Needed; Easy To Follow
Fuji Co., Ltd. (8278.T) Bundle
Evaluate Fuji Co., Ltd.'s financial outlook like an expert! This (8278T) DCF Calculator provides pre-filled financial data along with the flexibility to modify revenue growth, WACC, margins, and other crucial assumptions to align with your predictions.
What You Will Receive
- Authentic FUJI Financials: Access to both historical and projected data for precise valuation.
- Customizable Inputs: Adjust WACC, tax rates, revenue growth, and capital expenditures as needed.
- Real-Time Calculations: Intrinsic value and NPV are computed automatically.
- Scenario Analysis: Explore various scenarios to assess Fuji Co., Ltd.'s (8278T) potential future performance.
- User-Friendly Design: Designed for professionals while remaining approachable for newcomers.
Key Features
- 🔍 Real-Life Fuji Co. Financials: Pre-loaded historical and projected data for Fuji Co., Ltd. (8278T).
- ✏️ Fully Customizable Inputs: Modify all essential parameters (yellow cells), including WACC, growth %, and tax rates.
- 📊 Professional DCF Valuation: Integrated formulas assess Fuji’s intrinsic value through the Discounted Cash Flow method.
- ⚡ Instant Results: Visualize Fuji’s valuation in real-time after making adjustments.
- Scenario Analysis: Evaluate and contrast outcomes for different financial assumptions side-by-side.
How It Operates
- Step 1: Download the Excel spreadsheet.
- Step 2: Examine Fuji Co., Ltd.'s pre-populated financial figures and projections.
- Step 3: Adjust key variables such as revenue growth, WACC, and tax rates (highlighted cells).
- Step 4: Observe the DCF model refresh in real-time as you modify your assumptions.
- Step 5: Review the outputs and apply the findings to your investment strategies.
Why Choose the Fuji Co., Ltd. (8278T) Calculator?
- Save Time: Skip the hassle of building a DCF model from the ground up – this tool is ready for immediate use.
- Enhance Accuracy: Rely on dependable financial data and formulas to minimize valuation errors.
- Fully Customizable: Adjust the model to align with your specific assumptions and forecasts.
- User-Friendly: Intuitive charts and outputs make results straightforward to analyze.
- Endorsed by Professionals: Crafted for experts who prioritize both precision and usability.
Who Can Benefit from Fuji Co., Ltd. (8278T)?
- Finance Students: Gain hands-on experience with valuation techniques using real-world data.
- Academics: Integrate cutting-edge financial models into your curriculum and research projects.
- Investors: Validate your investment hypotheses and assess valuation results for Fuji Co., Ltd. (8278T).
- Analysts: Enhance your efficiency with a customizable DCF model designed for your specific needs.
- Small Business Owners: Learn how major publicly traded companies like Fuji Co., Ltd. (8278T) approach financial analysis.
Contents of the Template
- Pre-Filled Data: Featuring Fuji Co., Ltd.’s historical financials and projections.
- Discounted Cash Flow Model: An editable DCF valuation model with automatic computational features.
- Weighted Average Cost of Capital (WACC): A dedicated worksheet for calculating WACC based on user-defined inputs.
- Key Financial Ratios: Assess Fuji Co., Ltd.’s profitability, efficiency, and leverage metrics.
- Customizable Inputs: Easily modify revenue growth rates, profit margins, and tax rates.
- Clear Dashboard: Visual charts and tables summarizing essential valuation outcomes.
Disclaimer
All information, articles, and product details provided on this website are for general informational and educational purposes only. We do not claim any ownership over, nor do we intend to infringe upon, any trademarks, copyrights, logos, brand names, or other intellectual property mentioned or depicted on this site. Such intellectual property remains the property of its respective owners, and any references here are made solely for identification or informational purposes, without implying any affiliation, endorsement, or partnership.
We make no representations or warranties, express or implied, regarding the accuracy, completeness, or suitability of any content or products presented. Nothing on this website should be construed as legal, tax, investment, financial, medical, or other professional advice. In addition, no part of this site—including articles or product references—constitutes a solicitation, recommendation, endorsement, advertisement, or offer to buy or sell any securities, franchises, or other financial instruments, particularly in jurisdictions where such activity would be unlawful.
All content is of a general nature and may not address the specific circumstances of any individual or entity. It is not a substitute for professional advice or services. Any actions you take based on the information provided here are strictly at your own risk. You accept full responsibility for any decisions or outcomes arising from your use of this website and agree to release us from any liability in connection with your use of, or reliance upon, the content or products found herein.