
|
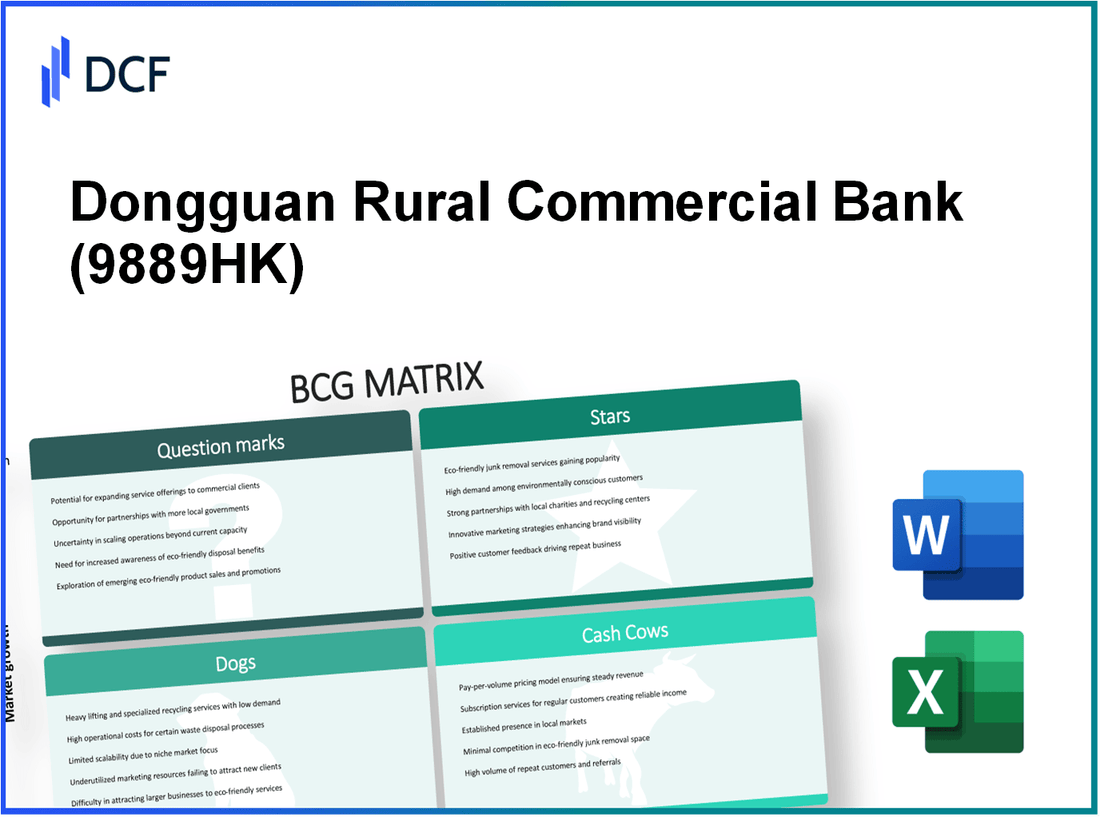
Dongguan Rural Commercial Bank Co., Ltd. (9889.HK): BCG Matrix [Apr-2026 Updated] |
Fully Editable: Tailor To Your Needs In Excel Or Sheets
Professional Design: Trusted, Industry-Standard Templates
Investor-Approved Valuation Models
MAC/PC Compatible, Fully Unlocked
No Expertise Is Needed; Easy To Follow
Dongguan Rural Commercial Bank Co., Ltd. (9889.HK) Bundle
Dongguan Rural Commercial Bank's portfolio balances fast-growing digital, green, SME and wealth "stars" that are absorbing targeted capex and promising outsized returns, against mature cash cows-corporate banking, retail deposits, municipal financing and trade finance-that reliably fund expansion; several high-upside question marks (cross‑border, micro‑lending, blockchain supply‑chain, pensions) require disciplined investment choices to scale, while legacy interbank, manual remittances and other dogs should be pruned to free capital-read on to see how these allocation decisions will shape the bank's competitive trajectory.
Dongguan Rural Commercial Bank Co., Ltd. (9889.HK) - BCG Matrix Analysis: Stars
DIGITAL RETAIL BANKING TRANSFORMATION STRATEGY
The digital retail banking division recorded a 24% year-on-year increase in active mobile users as of late 2025, contributing 18% of total operating income and driving a 30% rise in digital transaction volume over the past 12 months. Total capital expenditure committed to this transformation equals RMB 1.2 billion, allocated to AI-driven credit scoring systems (RMB 600 million) and cloud infrastructure (RMB 600 million). Despite elevated upfront development costs, the observed return on investment (ROI) for digital channels is 14%, substantially higher than branch-based ROI, which remains under 8%.
Ahead-of-market tailwinds include a 15% expansion of the digital economy within the Greater Bay Area, improving addressable market growth and customer acquisition economics. Key operational metrics:
- Active mobile users: +24% YoY (absolute users not disclosed by segment)
- Digital transaction volume: +30% YoY
- Operating income contribution: 18% of group total
- Capital expenditure: RMB 1.2 billion (AI credit scoring: RMB 600M; Cloud: RMB 600M)
- Digital channels ROI: 14% vs. traditional ROI: <8%
- Regional digital economy growth (Greater Bay Area): 15%
GREEN FINANCE AND SUSTAINABLE LENDING PORTFOLIO
Green finance is a high-growth strategic priority, with green credit balances expanding 32% YoY to represent 12.5% of the total loan book. Management targets 15% penetration by the end of the next fiscal year. The portfolio benefits from government-backed interest subsidies that support a net interest margin (NIM) of 2.1% for green infrastructure projects. Asset quality is strong: non-performing loan (NPL) ratio in green lending stands at 0.45% versus a bank-wide NPL of 1.18%. Funding for expansion includes a successful RMB 5 billion green bond issuance earmarked for additional green project financing.
Strategic and financial highlights:
- Green credit growth: +32% YoY
- Share of loan book: 12.5% (target: 15% by next fiscal year)
- NIM on green projects: 2.1%
- Green NPL ratio: 0.45% (bank average NPL: 1.18%)
- Green bond funding: RMB 5.0 billion
INCLUSIVE FINANCE FOR HIGH-TECH SMES
The bank holds a 22% market share in the specialized SME lending market in Dongguan, a segment expanding at 19% annually driven by local manufacturing's shift to high-end electronics and robotics. Loan disbursements to high-tech SMEs totaled RMB 45 billion, up 25% year-over-year. Risk-adjusted return on capital for this segment is 16%, which justifies higher per-loan operational costs for bespoke credit assessment, technical due diligence and monitoring. Market demand is projected to grow ~20% annually through 2027, supporting sustained market-share-driven profitability.
- Market share (specialized SME lending, Dongguan): 22%
- Segment growth rate: 19% annually
- Loan disbursements to high-tech SMEs: RMB 45 billion (+25% YoY)
- Risk-adjusted return on capital: 16%
- Projected demand growth: ~20% p.a. through 2027
SMART WEALTH MANAGEMENT PLATFORM GROWTH
The smart wealth management division recorded AUM growth of 28% in H2 2025, now servicing over 500,000 affluent clients across the Pearl River Delta and contributing 8% to fee-based income. The bank invested RMB 450 million in fintech partnerships to develop automated advisory and algorithmic portfolio management capabilities. Regional market penetration in private banking is approximately 5%, with the segment growing at roughly twice the rate of traditional deposit growth. Profit margins for wealth services have expanded to 35% owing to lower physical branch overhead and higher fee density.
- AUM growth: +28% in H2 2025
- Clients served: 500,000+ affluent clients (Pearl River Delta)
- Fee-based income contribution: 8% of total fee income
- Fintech investment: RMB 450 million
- Regional private banking penetration: 5%
- Wealth services profit margin: 35%
Consolidated Stars Segment Metrics
| Star Segment | Growth Rate | Contribution to Income / Loan Book / AUM | Capital / Funding | Profitability / ROI / NIM | Asset Quality / Market Share |
|---|---|---|---|---|---|
| Digital Retail Banking | Active users +24% YoY; transaction volume +30% YoY | 18% of operating income | CapEx RMB 1.2 bn (AI & Cloud) | ROI 14% | Regional digital economy growth 15% |
| Green Finance | Green credit +32% YoY | 12.5% of loan book (target 15%) | Green bond RMB 5.0 bn | NIM 2.1% | NPL 0.45% vs. bank 1.18% |
| High-Tech SME Lending | Segment growth 19% p.a. | Loan disbursements RMB 45 bn (+25% YoY) | Ongoing working capital and credit assessment spend | Risk-adjusted RoC 16% | Market share 22% (Dongguan) |
| Smart Wealth Management | AUM +28% (H2 2025) | 500,000+ clients; 8% fee income | Fintech investment RMB 450 mn | Profit margin 35% | Private banking penetration 5% |
Dongguan Rural Commercial Bank Co., Ltd. (9889.HK) - BCG Matrix Analysis: Cash Cows
DOMINANT CORPORATE BANKING IN DONGGUAN Corporate banking remains the primary engine of stability, contributing 44 percent of the bank's total revenue in 2025. The bank maintains a commanding 20 percent market share of total corporate loans within the Dongguan municipality. This segment generates a steady net interest margin (NIM) of 1.75 percent and produces annual net interest income of approximately 9.2 billion RMB. The non-performing loan (NPL) ratio for this mature portfolio is stable at 1.15 percent, reflecting deep-rooted local credit expertise and conservative provisioning of 0.65 percent of loan balances. Capital expenditure (CapEx) for this segment is minimal at an estimated 120 million RMB per year, focused primarily on relationship management, CRM upgrades and maintenance of legacy systems.
| Metric | Value |
|---|---|
| Revenue contribution (2025) | 44% |
| Market share (corporate loans, Dongguan) | 20% |
| Net interest margin | 1.75% |
| Annual net interest income | 9.2 billion RMB |
| NPL ratio | 1.15% |
| Provision ratio | 0.65% |
| CapEx (annual) | 120 million RMB |
PERSONAL DEPOSIT AND SAVINGS SERVICES Personal deposits continue to provide a low-cost funding base, accounting for 52 percent of the bank's total liabilities. The bank holds a leading 23 percent market share of retail deposits in its home market, totaling over 400 billion RMB in balances. Annual growth in this segment has stabilized at a modest 4 percent, consistent with mature market dynamics. The weighted average cost of funds for these deposits stands at 1.6 percent, supporting a net interest margin uplift across the consolidated book and enabling a consistent dividend payout ratio targeted at 30 percent. Operational maintenance cost associated with retail deposit channels is estimated at 480 million RMB per year; reinvestment requirements are limited largely to digital channel upkeep estimated at 210 million RMB annually.
- Deposit base: 400+ billion RMB (23% local market share)
- Growth rate: 4% p.a.
- Cost of funds (retail deposits): 1.6%
- Operational expense (retail): 480 million RMB/year
- Digital maintenance spend: 210 million RMB/year
| Metric | Value |
|---|---|
| Share of liabilities | 52% |
| Retail deposit balances | 400+ billion RMB |
| Market share (retail deposits) | 23% |
| Annual growth | 4% |
| Cost of funds | 1.6% |
| Dividend payout ratio | 30% |
LOCAL GOVERNMENT INFRASTRUCTURE FINANCING Financing for municipal infrastructure projects in the Greater Bay Area represents a stable 15 percent of the total loan portfolio, equating to ~75 billion RMB of outstanding balances. These assets deliver an average yield of 4.2 percent and contribute over 3.15 billion RMB in annual net interest income, with nearly zero default risk due to explicit and implicit government guarantees. Portfolio growth is mature at roughly 3 percent per year. The bank benefits from low cost of capital on these exposures and records a retention rate of 95 percent for high-value municipal accounts. Expected annual provisioning for this segment remains negligible at 0.05 percent of balance, reflecting extremely low credit losses.
| Metric | Value |
|---|---|
| Share of loan portfolio | 15% |
| Outstanding balance | ~75 billion RMB |
| Yield / return | 4.2% |
| Annual net interest income | 3.15 billion RMB |
| Portfolio growth | 3% p.a. |
| Retention rate (accounts) | 95% |
| Provisioning | 0.05% of balance |
TRADITIONAL TRADE FINANCE OPERATIONS Trade finance services for the Dongguan export hub contribute a consistent 10 percent to the bank's non-interest income, handling over 150 billion RMB in annual transaction volume with a stable market share of 18 percent in documentary credits and guarantees. The operating margin for this segment is approximately 40 percent, producing ~1.2 billion RMB in operating profit annually. Growth in traditional manufacturing exports has slowed to about 2 percent, but repeat-customer rates exceed 80 percent and capital intensity remains low-annual working capital to support trade finance is roughly 35 billion RMB with utilization at 60 percent. The cash flow from this unit is routinely allocated to subsidize digital supply chain finance pilots and fintech partnerships, with transfers averaging 180 million RMB per year.
- Transaction volume: 150 billion RMB/year
- Market share (trade finance)
- Operating margin: 40%
- Operating profit: ~1.2 billion RMB/year
- Growth rate: 2% p.a.
- Funds reallocated to innovation: 180 million RMB/year
| Metric | Value |
|---|---|
| Contribution to non-interest income | 10% |
| Annual transaction volume | 150 billion RMB |
| Market share | 18% |
| Operating margin | 40% |
| Operating profit | ~1.2 billion RMB |
| Working capital deployed | 35 billion RMB (60% utilization) |
| Annual innovation subsidy | 180 million RMB |
Dongguan Rural Commercial Bank Co., Ltd. (9889.HK) - BCG Matrix Analysis: Question Marks
Dogs - Question Marks
CROSS-BORDER FINANCIAL SERVICES IN GBA
The cross-border finance segment serves Greater Bay Area (GBA) trade corridors and currently holds a 3% market share. Transaction volume grew 40% year-on-year, yet the unit reports a return on equity (ROE) of 2%, reflecting early-stage investment and heavy compliance expenses. The bank has allocated RMB 600 million to develop cross-border payment gateways and FX platforms. GBA financial integration market growth is estimated at 25% annually, presenting scale-driven upside if regulatory and cost hurdles are managed.
- Market share: 3%
- Transaction volume growth: 40% YoY
- Allocated investment: RMB 600 million
- Current ROE: 2%
- Estimated market growth: 25% p.a.
- Main constraints: regulatory compliance costs, low profitability
CONSUMER MICRO-LENDING VIA THIRD-PARTY PLATFORMS
Micro-lending through third-party integrators is expanding at 35% annually but faces intense competition from national digital banks. The segment comprises 4% of the retail loan book and has a volatile non-performing loan (NPL) ratio of 2.1%. Market expansion for online consumer credit is about 18% p.a., but the bank's market share is under 1%. High customer acquisition costs compress net interest margin to approximately 1.2% after risk adjustments. Substantial further investment is required to develop an in-house risk scoring model to reduce dependency on external platforms.
- Segment growth: 35% p.a.
- Share of retail loan book: 4%
- Bank market share in online consumer credit: <1%
- NPL ratio: 2.1%
- Net interest margin (post-risk): 1.2%
- Needed investment: proprietary risk model, customer acquisition optimization
BLOCKCHAIN-BASED SUPPLY CHAIN FINANCE
The blockchain supply chain finance pilot targets a logistics technology market growing ~20% annually. Platform financing support is RMB 2 billion, representing <1% of the bank's corporate portfolio. The platform reduces processing time by ~50%, but SME supplier adoption is uncertain. RMB 300 million has been invested to date; current ROI is negative as the ecosystem matures. Capturing a meaningful share of the estimated RMB 500 billion Pearl River Delta supply chain market is required to reach profitability.
- Platform financing: RMB 2 billion
- Share of corporate portfolio: <1%
- Investment to date: RMB 300 million
- Processing time reduction: ~50%
- Target regional market size: RMB 500 billion
- Market growth (regional logistics/tech): ~20% p.a.
RETAIL PENSION AND ANNUITY PRODUCTS
Retail pension and annuity pilots target the silver economy growing ~15% annually. Current contribution to fee income is <2%; cost-to-income ratio for the unit is ~75% due to product development and marketing spend. Guangdong private pension market size is projected to triple by 2030, but the bank's market share is negligible. Profitability will depend on leveraging the branch network for advisory services and scale in fee-generating assets.
- Current fee income contribution: <2%
- Cost-to-income ratio: 75%
- Projected regional market growth (silver economy): 15% p.a.
- Private pension market projection: 3x by 2030
- Key gap: distribution/advisory scale versus insurance incumbents
Summary metrics table for Question Mark ('Dogs') segments:
| Segment | Market Growth p.a. | Bank Market Share | Current Investment (RMB) | ROE / ROI | Key Operational Metrics |
|---|---|---|---|---|---|
| Cross-border Financial Services (GBA) | 25% | 3% | 600,000,000 | ROE 2% | Transaction volume +40% YoY; high compliance costs |
| Consumer Micro-lending (3rd-party) | 18% (online credit) | <1% in online credit; 4% of retail loans | Incremental investment required (proprietary risk model) | Net interest margin ~1.2% (post-risk) | Segment growth 35% p.a.; NPL 2.1%; high CAC |
| Blockchain Supply Chain Finance | 20% | <1% of corporate portfolio | 300,000,000 | Negative ROI (pilot phase) | Financing supported RMB 2bn; processing time -50% |
| Retail Pension & Annuities | 15% (silver economy) | Negligible | Product development & marketing (undisclosed) | High cost-to-income 75% | Fee income <2%; market to triple by 2030 |
Strategic implications and near-term actions for these Question Marks:
- Prioritize segments where scale can be achieved within 3-5 years (GBA cross-border, supply chain finance) and allocate staged capital contingent on adoption metrics.
- Develop in-house credit/risk models to reduce CAC and improve margins in micro-lending; consider partnerships with fintechs for data and distribution.
- Accelerate SME onboarding and interoperability for blockchain platform; set adoption KPIs (supplier enrollment, transaction volume targets) tied to additional funding.
- For pensions, pilot targeted advisory-driven branches and digital advice to lower cost-to-income before broad rollout.
- Establish clear ROI thresholds and exit or scale-up criteria for each unit to prevent persistent cash drains on core bank capital.
Dongguan Rural Commercial Bank Co., Ltd. (9889.HK) - BCG Matrix Analysis: Dogs
TRADITIONAL INTERBANK TREASURY OPERATIONS
The traditional interbank lending and borrowing segment contributed 5.0% of total revenue in 2025, operating in a low-growth market with national interbank rates near historic lows. Net interest margin for this segment is 0.6%, and the segment's return on assets (ROA) is 0.3%. The bank's share of national interbank trading volume is 0.5%, unchanged year-over-year. Capital consumption is material relative to returns; the bank is executing a strategic de-risking that reduces exposure to these low-yield assets by 10% per annum.
MANUAL BRANCH-BASED REMITTANCE SERVICES
Over-the-counter remittance volumes declined by 15% year-on-year as customers migrate to mobile and online channels. Cost-to-income ratio for manual remittance operations stands at 85% due to labor and security overheads. The regional market for manual banking services in Guangdong is contracting at an annualized rate of 12%. This segment contributes under 1.0% to total net profit while occupying significant branch footprint. Management plans to close or automate 20% of underperforming service points by 2026 to reduce branch operating expense and reallocate staff.
LEGACY NON-PERFORMING ASSET MANAGEMENT
Legacy distressed asset management yields a return on investment of 1.5% and represents 2.0% of the bank's total assets. Legal and recovery costs are disproportionately high and management attention is elevated. Loan recovery rate for these legacy exposures has declined to 18% from 25% in prior cycles. The regional economic transition to high-tech and services has rendered secondary markets for old industrial collateral weak to non-existent. The bank is evaluating bulk disposals to asset management companies to accelerate resolution of RMB 12,000,000,000 in stagnant holdings.
PHYSICAL CREDIT CARD ACQUISITION CHANNELS
Door-to-door and booth-based credit card acquisition effectiveness fell by 20% this year. Cost per acquisition through physical channels is RMB 400, with an activation rate of 30%. Physical channels now account for only 5% of new card issuances, down from 40% five years prior. Market shift toward digital onboarding and POS financing has turned marketing ROI for this channel negative in the current fiscal year.
| Business Unit | Revenue Contribution (2025) | Market Growth | Relative Market Share | Margin / ROI | ROA | Key Metrics | Strategic Action |
|---|---|---|---|---|---|---|---|
| Traditional Interbank Treasury | 5.0% | ~0% (low) | 0.5% national | Margin 0.6% | 0.3% | Exposure reduction 10% pa | De-risking, redeploy capital to retail/green |
| Manual Branch Remittance | <1.0% net profit | -12% p.a. Guangdong | Local presence; no scale | Cost-to-income 85% | N/A (profit negligible) | Volume -15% YoY | Close/automate 20% service points by 2026 |
| Legacy NPA Management | Indirect (2.0% of assets) | Negative (market virtually non-existent) | Not meaningful | ROI 1.5% | Impact on capital ratios | Recovery rate 18% (down from 25%) | Bulk disposal to AMCs; legal cost containment |
| Physical Credit Card Acquisition | 5% of new issuances | Declining fast | Declining share | CPA RMB 400; activation 30% | Negative marketing ROI | Effectiveness -20% YoY | Shift to digital acquisition; cut physical spend |
Consolidated actions and operational levers under consideration:
- Reallocate capital from low-yield interbank assets to higher-margin retail and green finance portfolios.
- Accelerate branch automation and digital remittance channels to reduce branch OPEX and improve cost-to-income ratios.
- Pursue bulk disposals or NPL sales for RMB 12 billion legacy assets to improve balance sheet cleanliness and free managerial bandwidth.
- Terminate or repurpose underperforming physical card acquisition programs; invest in digital onboarding, partnerships with merchants, and POS integration.
- Monitor regulatory and liquidity risk impacts from rapid de-risking and NPL disposition to preserve capital adequacy and liquidity coverage ratios.
Disclaimer
All information, articles, and product details provided on this website are for general informational and educational purposes only. We do not claim any ownership over, nor do we intend to infringe upon, any trademarks, copyrights, logos, brand names, or other intellectual property mentioned or depicted on this site. Such intellectual property remains the property of its respective owners, and any references here are made solely for identification or informational purposes, without implying any affiliation, endorsement, or partnership.
We make no representations or warranties, express or implied, regarding the accuracy, completeness, or suitability of any content or products presented. Nothing on this website should be construed as legal, tax, investment, financial, medical, or other professional advice. In addition, no part of this site—including articles or product references—constitutes a solicitation, recommendation, endorsement, advertisement, or offer to buy or sell any securities, franchises, or other financial instruments, particularly in jurisdictions where such activity would be unlawful.
All content is of a general nature and may not address the specific circumstances of any individual or entity. It is not a substitute for professional advice or services. Any actions you take based on the information provided here are strictly at your own risk. You accept full responsibility for any decisions or outcomes arising from your use of this website and agree to release us from any liability in connection with your use of, or reliance upon, the content or products found herein.