
|
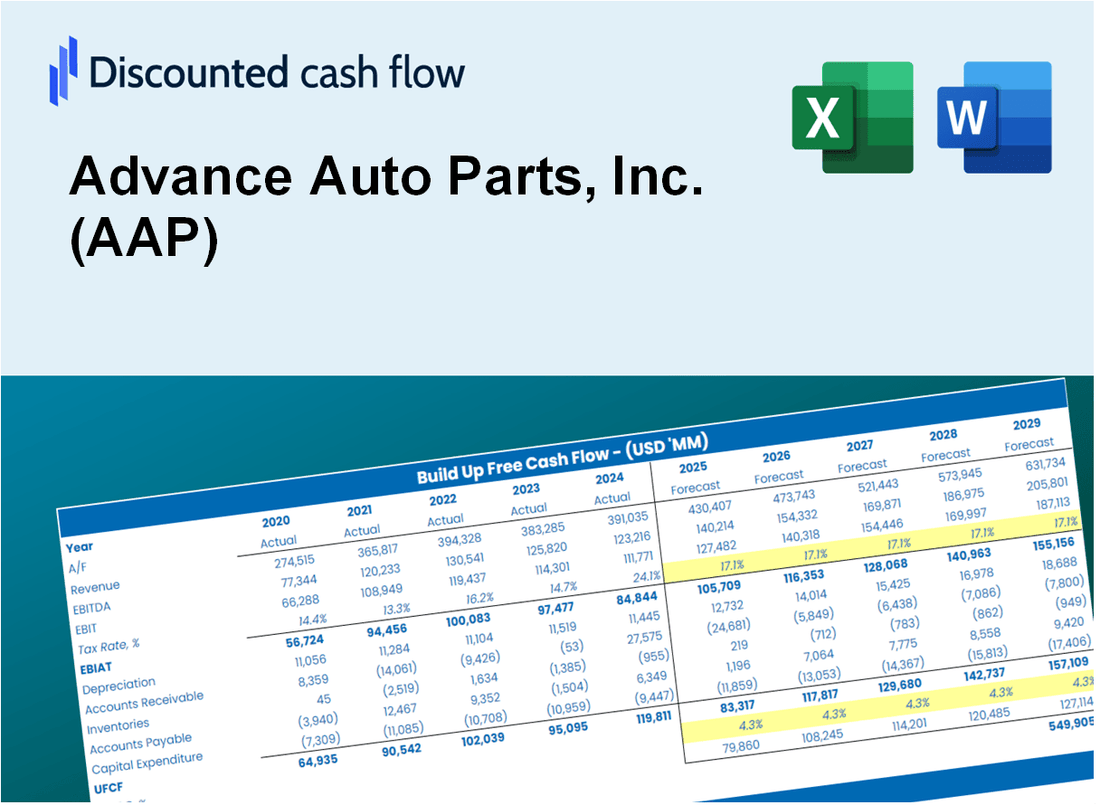
Advance Auto Parts, Inc. (AAP) DCF Valuation |
Fully Editable: Tailor To Your Needs In Excel Or Sheets
Professional Design: Trusted, Industry-Standard Templates
Investor-Approved Valuation Models
MAC/PC Compatible, Fully Unlocked
No Expertise Is Needed; Easy To Follow
Advance Auto Parts, Inc. (AAP) Bundle
Evaluate Advance Auto Parts, Inc. (AAP) financial outlook with professional precision! This (AAP) DCF Calculator provides you with pre-filled financial data and full flexibility to modify revenue growth, WACC, margins, and other essential assumptions to align with your projections.
What You Will Get
- Editable Excel Template: A fully customizable Excel-based DCF Calculator featuring pre-filled real AAP financials.
- Real-World Data: Access to historical data and forward-looking estimates (highlighted in the yellow cells).
- Forecast Flexibility: Adjust forecast assumptions such as revenue growth, EBITDA %, and WACC.
- Automatic Calculations: Instantly observe the effects of your inputs on Advance Auto Parts' valuation.
- Professional Tool: Designed for investors, CFOs, consultants, and financial analysts.
- User-Friendly Design: Organized for clarity and ease of use, complete with step-by-step instructions.
Key Features
- Comprehensive Financial Data: Gain access to precise pre-loaded historical performance and future estimates for Advance Auto Parts, Inc. (AAP).
- Adjustable Forecast Inputs: Modify highlighted cells for key metrics such as WACC, growth rates, and profit margins.
- Real-Time Calculations: Instant updates for DCF, Net Present Value (NPV), and cash flow evaluations.
- User-Friendly Dashboard: Clear charts and summaries to help visualize your valuation outcomes.
- Designed for All Skill Levels: An intuitive layout tailored for investors, CFOs, and consultants alike.
How It Works
- Step 1: Download the Excel file.
- Step 2: Review pre-entered Advance Auto Parts, Inc. (AAP) data (historical and projected).
- Step 3: Adjust key assumptions (yellow cells) based on your analysis.
- Step 4: View automatic recalculations for Advance Auto Parts, Inc. (AAP)'s intrinsic value.
- Step 5: Use the outputs for investment decisions or reporting.
Why Choose Advance Auto Parts (AAP)?
- Convenient Access: Quickly find the parts you need without hassle – everything is organized for you.
- Quality Assurance: High-quality automotive parts ensure reliability and performance in your vehicle.
- Wide Selection: Extensive inventory allows you to find exactly what you’re looking for.
- User-Friendly Experience: Intuitive website and app make shopping easy and efficient.
- Backed by Expertise: Knowledgeable staff and resources help you make informed decisions.
Who Should Use This Product?
- Individual Investors: Make informed decisions about buying or selling Advance Auto Parts, Inc. (AAP) stock.
- Financial Analysts: Streamline valuation processes with ready-to-use financial models specific to the automotive retail sector.
- Consultants: Deliver professional valuation insights on Advance Auto Parts, Inc. (AAP) to clients quickly and accurately.
- Business Owners: Understand how companies like Advance Auto Parts, Inc. (AAP) are valued to inform your own business strategy.
- Finance Students: Learn valuation techniques using real-world data and scenarios related to the automotive industry.
What the Template Contains
- Operating and Balance Sheet Data: Pre-filled Advance Auto Parts, Inc. (AAP) historical data and forecasts, including revenue, EBITDA, EBIT, and capital expenditures.
- WACC Calculation: A dedicated sheet for Weighted Average Cost of Capital (WACC), including parameters like Beta, risk-free rate, and share price.
- DCF Valuation (Unlevered and Levered): Editable Discounted Cash Flow models showing intrinsic value with detailed calculations.
- Financial Statements: Pre-loaded financial statements (annual and quarterly) to support analysis.
- Key Ratios: Includes profitability, leverage, and efficiency ratios for Advance Auto Parts, Inc. (AAP).
- Dashboard and Charts: Visual summary of valuation outputs and assumptions to analyze results easily.
Disclaimer
All information, articles, and product details provided on this website are for general informational and educational purposes only. We do not claim any ownership over, nor do we intend to infringe upon, any trademarks, copyrights, logos, brand names, or other intellectual property mentioned or depicted on this site. Such intellectual property remains the property of its respective owners, and any references here are made solely for identification or informational purposes, without implying any affiliation, endorsement, or partnership.
We make no representations or warranties, express or implied, regarding the accuracy, completeness, or suitability of any content or products presented. Nothing on this website should be construed as legal, tax, investment, financial, medical, or other professional advice. In addition, no part of this site—including articles or product references—constitutes a solicitation, recommendation, endorsement, advertisement, or offer to buy or sell any securities, franchises, or other financial instruments, particularly in jurisdictions where such activity would be unlawful.
All content is of a general nature and may not address the specific circumstances of any individual or entity. It is not a substitute for professional advice or services. Any actions you take based on the information provided here are strictly at your own risk. You accept full responsibility for any decisions or outcomes arising from your use of this website and agree to release us from any liability in connection with your use of, or reliance upon, the content or products found herein.