
|
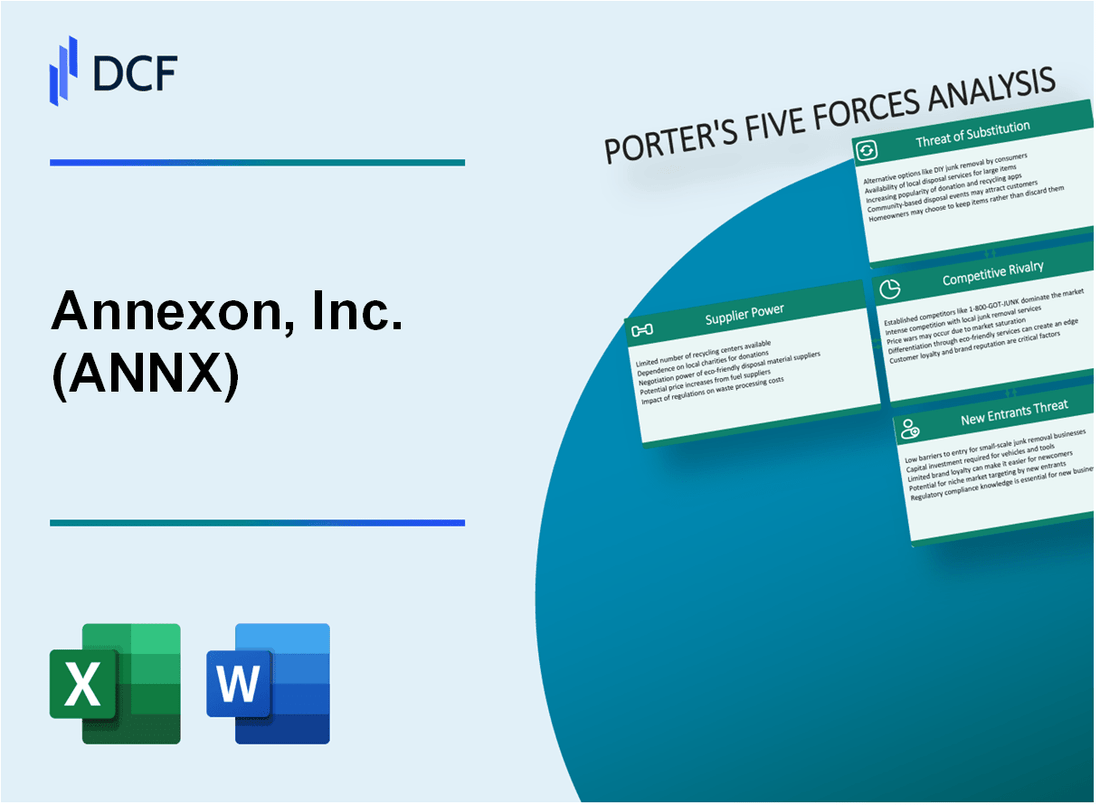
Annexon, Inc. (ANNX): 5 FORCES Analysis [Nov-2025 Updated] |
Fully Editable: Tailor To Your Needs In Excel Or Sheets
Professional Design: Trusted, Industry-Standard Templates
Investor-Approved Valuation Models
MAC/PC Compatible, Fully Unlocked
No Expertise Is Needed; Easy To Follow
Annexon, Inc. (ANNX) Bundle
You're looking at Annexon, Inc. (ANNX) right now, and honestly, it feels like a classic biotech tightrope walk: a clinical-stage company aiming for potential commercialization in 2026, but sitting on a pre-revenue burn rate-they posted a net loss of $49.2 million in Q2 2025. Before you commit capital, you need to know if their C1q-targeting platform can actually win against entrenched rivals and powerful payers. We're mapping out the five core pressures-from the leverage held by specialized suppliers to the intense rivalry in Geographic Atrophy (GA) against approved drugs-to give you a clear, analyst-grade view of the near-term risks and the path to market. Stick around; understanding these forces is key to deciding if this is a calculated bet or just a gamble.
Annexon, Inc. (ANNX) - Porter's Five Forces: Bargaining power of suppliers
You're looking at the supplier landscape for Annexon, Inc. (ANNX) right as they are on the cusp of major regulatory submissions. For a biopharma company this deep into development, supplier power is a critical, often underestimated, risk factor, especially given the specialized nature of their assets.
Annexon has no commercial manufacturing agreements in place as of late 2025. This is standard for a company whose lead assets, tanruprubart (ANX005) and vonaprument (ANX007), are still awaiting approval. However, the focus shifts immediately to securing reliable, qualified suppliers for the impending commercial launch phase. The company's cash position as of June 30, 2025, stood at $227.0 million, with a runway extending into the fourth quarter of 2026. This timeline means securing commercial-scale supply chains must happen concurrently with, or immediately following, the expected January 2026 Marketing Authorization Application (MAA) submission for ANX005 in Europe.
Reliance on a small pool of specialized Contract Manufacturing Organizations (CMOs) for biologics (ANX005, ANX007). Developing complex biologics like C1q-targeting antibodies means the pool of qualified CMOs capable of handling late-stage clinical and future commercial supply is inherently small. This limited competition directly translates to supplier leverage. Annexon's significant Research and Development expenses, which totaled $44.2 million for the quarter ended June 30, 2025, reflect the high cost of developing and scaling these specialized processes.
Specialized raw materials for C1q-targeting antibodies give suppliers leverage. The active pharmaceutical ingredients (APIs) and critical raw materials required for these novel biologics are often proprietary or sourced from a limited number of vendors who possess the specific expertise to meet stringent biomanufacturing standards. This is a classic bottleneck in the biotech supply chain. The complexity of targeting C1q means the starting materials are not commodity items; they are highly specialized components.
The potential impact of supplier issues is magnified by the critical near-term milestones:
- MAA submission for ANX005 planned for January 2026.
- Topline data from the pivotal Phase 3 ARCHER II trial for ANX007 expected in the second half of 2026.
- GBS, the target for ANX005, affects approximately 150,000 people worldwide annually.
Any supply chain disruption could materially impact BLA/MAA submissions planned for 2026. A failure to secure timely supply of clinical trial material or, worse, commercial launch inventory, directly jeopardizes the timeline for ANX005's January 2026 MAA submission and the subsequent BLA discussions with the FDA. Given the company is capitalized into the fourth quarter of 2026, any significant delay caused by a supplier issue could force Annexon to seek additional, potentially dilutive, financing sooner than anticipated.
High switching costs to qualify new suppliers for late-stage clinical and commercial supply. Once a CMO is qualified for a late-stage biologic like ANX005 or ANX007, switching that supplier requires extensive re-validation, comparability studies, and regulatory amendments. This process is time-consuming and expensive, effectively locking Annexon into its current manufacturing partners for the near term, which further entrenches supplier power.
Here's a quick view mapping the supplier leverage points against the company's near-term focus:
| Factor | Impact on Supplier Power | Relevant Annexon Data Point |
|---|---|---|
| Manufacturing Stage | High, due to late-stage/commercial prep | Cash runway extends into Q4 2026 |
| Product Complexity | High, specialized C1q-targeting biologics | R&D Expenses: $44.2 million in Q2 2025 |
| Regulatory Dependency | Critical, as supply is needed for filings | ANX005 MAA submission planned for January 2026 |
| Market Potential | High, first-in-class potential for GBS (150,000 patients annually) | ANX005 showed 90% of patients improved by week 1 in Phase 3 |
Finance: draft a risk mitigation plan for CMO qualification timeline variance by end of Q1 2026.
Annexon, Inc. (ANNX) - Porter's Five Forces: Bargaining power of customers
You're looking at the customer side of the equation for Annexon, Inc. (ANNX), and honestly, for a company with late-stage assets like ANX005 and ANX007, the power held by payers and established prescribers is a defintitely key factor in commercial success.
Power is concentrated with large government payers (Medicare) and private insurers. These entities control access and reimbursement rates, which directly impacts Annexon, Inc.'s net realized price. For instance, Medicare is implementing a $2,000 annual out-of-pocket (OOP) maximum for Part D beneficiaries starting in 2025. While this helps patients, it sets a ceiling on what payers expect to cover, putting pressure on manufacturers to negotiate lower Maximum Fair Prices (MFPs) for future products, though initial negotiated prices under the IRA are not effective until 2027 for the second cycle of selected drugs.
Payers will demand significant discounts and evidence of superior outcomes over existing GBS standard of care (IVIg/PLEX). For Guillain-Barré Syndrome (GBS), Annexon, Inc.'s ANX005 (tanruprubart) is positioned against established, though less convenient, therapies. Payers will scrutinize the clinical benefit of ANX005, which showed a 2.4-fold improvement on the GBS-disability scale (GBS-DS) versus placebo at Week 8 in its Phase 3 trial, against the known costs of the current standard.
Here's the quick math on the cost comparison for the GBS standard of care, which Annexon, Inc.'s single-infusion ANX005 must overcome in value discussions:
| Treatment | Cost Metric | Reported Amount |
|---|---|---|
| IVIg (5 sessions, 2.0 g/kg total) | Direct Hospital Cost | $10,329.85 |
| Therapeutic Plasma Exchange (TPE) (5 procedures) | Direct Hospital Cost | $4,638.16 |
| IVIg (10 gram vial, India pricing as of Feb 2025) | Price (plus tax) | Rs 15,400 |
Formulary inclusion for ANX007 (GA) will be contested by approved rivals Syfovre and Izervay. These existing treatments for Geographic Atrophy (GA) already set the reimbursement baseline. Both Syfovre and Izervay reduce lesion growth by approximately 20% with monthly intraocular injections, though neither reduced vision loss over 12 months in their respective Phase III trials. Annexon, Inc. must demonstrate ANX007's potential as the first vision-preserving treatment, as Phase 2 data showed vision preservation across multiple measures. Still, Syfovre showed a statistically significant 30% greater reduction in GA lesion growth than Izervay after two years, which creates a competitive hurdle for Annexon, Inc. to clear in payer negotiations.
Hospitals/physicians for ANX005 (GBS) have high leverage due to current, established treatment protocols. While ANX005 aims for a single infusion versus the standard five-day IVIg course, the treatment of GBS is concentrated, with 80% of the disease's incidence occurring in just five large states and 'just a few hundred hospitals'. This focused geography allows key prescribing centers to exert significant influence on adoption and utilization patterns, especially given the lack of any FDA-approved GBS therapy prior to Annexon, Inc.'s filing plans.
Patient demand is high in rare diseases, but price sensitivity for specialty drugs remains a defintely key factor. For GA, the market size was estimated at $45.52 billion in 2025, indicating high revenue potential if access is secured. However, high treatment costs are a known barrier for both patients and healthcare systems. Annexon, Inc.'s cash position of $227.0 million as of June 30, 2025, supports operations into the fourth quarter of 2026, which covers the period leading up to expected topline data for ANX007 in H2 2026. This runway is critical for navigating payer pushback on pricing for both GBS and GA assets.
The leverage points for customer pushback include:
- Medicare OOP cap set at $2,000 annually starting in 2025.
- Rival GA drug (Syfovre) showing 30% greater lesion reduction than Izervay after two years.
- GBS standard of care (IVIg) costing over $10,000 for a full course in one analysis.
- High R&D spend in Q2 2025 at $44.2 million needing high net prices to recoup investment.
- Potential for increased Medicare spending on orphan drugs due to 2025 law changes.
Finance: draft 13-week cash view by Friday.
Annexon, Inc. (ANNX) - Porter's Five Forces: Competitive rivalry
You're looking at a market where Annexon, Inc. is entering late to the party in Geographic Atrophy (GA), which means the competitive rivalry is already running hot. The landscape is defined by two FDA-approved complement inhibitors already established with prescribers and payers as of late 2025. This isn't a greenfield; it's a fight for market share against incumbents.
For GA, the rivalry centers on the two therapies that gained approval in 2023. Annexon's Vonaprument (ANX007) is aiming to show a superior clinical profile when its ARCHER II pivotal data lands in the second half of 2026. Here's a quick look at what Annexon is up against in the GA space:
| Competitor/Product | Target Pathway | FDA Approval Date | Reported Lesion Growth Reduction (Approx.) |
|---|---|---|---|
| Apellis Pharmaceuticals / Syfovre (Pegcetacoplan) | C3 Inhibitor | February 2023 | Approximately 20% with monthly injections |
| Astellas Pharma / Izervay (Avacincaptad pegol) | C5 Inhibitor | August 2023 | Approximately 20% with monthly injections |
| Annexon, Inc. / Vonaprument (ANX007) | C1q Inhibitor (Classical Cascade) | Pending (Topline 2H 2026) | Unknown (Aims for vision preservation) |
Still, the competition isn't just from the two immediate GA rivals. You have established pharma giants like Alexion/AstraZeneca, which is advancing its C3 inhibitor, danicopan (ALXN2040), into early clinical testing for GA. That means the pipeline is also crowded with potential future entrants from big players.
The competitive dynamic shifts entirely when we look at Annexon's other lead program, Tanruprubart (ANX005) for Guillain-Barré Syndrome (GBS). Here, the rivalry is against deeply entrenched standards of care: intravenous immunoglobulin (IVIg) and plasma exchange (PLEX). These treatments are widely available and, crucially, well-reimbursed, making them the default choice for this acute, rare condition. Annexon's data suggests a strong case, though: in its Phase 3 study, approximately 90% of Tanruprubart-treated patients improved by week 1, and more than twice as many achieved a normal state at week 26 versus placebo.
The basis for rivalry across these indications is multifaceted. In GA, it's about mechanism-Annexon's C1q approach versus the C3/C5 targets of competitors-and the clinical endpoint: vision preservation versus simply slowing lesion growth, as the approved drugs did not reduce vision loss over 12 months in their primary analyses. For GBS, it's about speed and convenience against the established therapies, which are not C1q inhibitors.
Annexon, Inc.'s pre-revenue position is defintely highlighted by its recent financials when stacked against these larger, profitable rivals. The company reported a net loss of $49.2 million for the second quarter of 2025, driven by Research and Development expenses of $44.2 million in that same quarter.
The current financial footing dictates the intensity of this rivalry you face:
- Cash and short-term investments stood at $227.0 million as of June 30, 2025.
- This cash position is expected to fund operations into the fourth quarter of 2026.
- The European Marketing Authorization Application (MAA) for Tanruprubart in GBS is anticipated in the first quarter of 2026.
Finance: draft 13-week cash view by Friday.
Annexon, Inc. (ANNX) - Porter's Five Forces: Threat of substitutes
The threat of substitutes for Annexon, Inc. (ANNX) products is substantial, stemming from established, cheaper alternatives in Guillain-Barré syndrome (GBS) and direct, though mechanistically distinct, competitors in Geographic Atrophy (GA).
High Threat for GBS from Non-Targeted, Established, and Cheaper Treatments
For GBS, the established standard of care-Intravenous Immunoglobulin (IVIg) and plasma exchange (PLEX)-presents a significant cost and accessibility hurdle for a novel, targeted therapy like Tanruprubart (formerly ANX005). GBS affects at least 150,000 people worldwide each year, creating a large addressable market for any effective treatment. The cost differential is stark; in one analysis, the direct hospital cost for five TPE procedures was $4,638.16, while five IVIg infusion sessions cost $10,329.85 in the U.S. Even in a New Zealand context, PLEX was 4,075 NZD cheaper per patient than IVIg. Tanruprubart must therefore demonstrate a value proposition that far outweighs this established, lower-cost baseline.
The substitution threat is quantified by the comparative efficacy data:
| Metric | ANX005 (30 mg/kg) vs. Placebo (Phase 3) | ANX005 vs. IVIg/PE (RWE Study) |
|---|---|---|
| Odds of Improved Health (Week 8) | 2.4-times greater (OR, 2.4) | >10-point improvement in muscle strength by Week 1 (p < 0.0001) |
| Time to Walk Independently | 31 days sooner (vs. placebo) | Faster functional recovery observed |
| Time on Artificial Ventilation | Median reduction of 28 days by Week 26 (vs. placebo) | Reduced time on ventilation observed |
The market will weigh the functional benefit of Tanruprubart against the known, lower acquisition cost of IVIg and PLEX.
Approved GA Drugs as Direct Substitutes for ANX007 (Vonaprument)
For GA, the recently approved C3 inhibitors, Syfovre and Izervay, are direct substitutes for Vonaprument (formerly ANX007), which targets the upstream C1q molecule. While mechanistically different, both aim to slow the progression of the irreversible vision loss affecting over 5 million people globally. Both Syfovre and Izervay have demonstrated the ability to slow the development of GA lesions by approximately 14% to 20% in clinical trials.
The cost and safety profile of these existing treatments set a benchmark:
- Syfovre (pegcetacoplan) per-unit cost is approximately $22,117.00 (for 0.1 mL).
- Izervay (avacincaptad pegol) per-unit cost is approximately $20,591.80 (for 0.1 mL).
- Syfovre adoption has been reportedly weakened due to safety events like retinal vasculitis.
Annexon, Inc. (ANNX) has suggested Vonaprument could command a premium pricing over these approved therapies, banking on its differentiated mechanism and neuroprotective benefits. The Phase 2 ARCHER trial showed a 72% reduction in the risk of greater than 15-letter vision loss (n=89, p=0.006) with monthly Vonaprument, a functional benefit that may justify a higher price point than the lesion-slowing effect of the current standard.
Other Complement Cascade Inhibitors as Platform Substitutes
The entire C1q-targeting platform of Annexon, Inc. (ANNX) faces substitution from other complement cascade inhibitors targeting downstream components. Regeneron's pozelimab, a C5 inhibitor, is in Phase III trials for GA and represents a direct therapeutic substitute backed by a strong corporate portfolio. The existence of multiple C3/C5 inhibitors validates the complement pathway as a target but also means Annexon, Inc. (ANNX) must prove that inhibiting the initiating molecule, C1q, offers a superior clinical or safety advantage over inhibiting C3 (Syfovre) or C5 (Pozelimab). This competition is fierce, as the dry AMD market is set for robust growth, valued in the low billions.
Emerging Long-Term Substitutes
Long-term threats for GA come from non-injection modalities that address the treatment burden and patient preference. Belite Bio's Tinlarebant, an oral RBP4 inhibitor, offers a daily pill alternative, sidestepping the need for repeated intravitreal injections. Furthermore, the broader field of cell and gene therapies is advancing, with over 4,000 candidates in the pipeline as of Q3 2024, half of which are gene therapies. These therapies, while facing their own hurdles like high cost (e.g., $2.1 million for one gene therapy, with annual US spending projected at $20.4 billion), offer the potential for one-time, potentially curative treatments that could completely redefine the standard of care for chronic retinal diseases.
ANX005 Must Justify Benefit Over Existing GBS Care
For Tanruprubart (ANX005) to gain traction against the cheaper, established IVIg and PLEX, the functional benefit must translate into a clear, quantifiable advantage that justifies a higher cost structure, which is typical for a first-in-class targeted therapy. The data shows a 2.4-fold improvement in odds of better health at week 8 over placebo, and a 31-day earlier walk independence compared to placebo. The challenge is proving that the benefit over the standard of care (IVIg/PLEX), which was shown to be a >10-point improvement in muscle strength by week 1 in the RWE study, translates into a significant reduction in long-term healthcare utilization or improved quality of life that offsets the higher acquisition price. Finance: draft 13-week cash view by Friday.
Annexon, Inc. (ANNX) - Porter's Five Forces: Threat of new entrants
The threat of new entrants for Annexon, Inc. remains relatively low, primarily due to the steep financial and regulatory hurdles inherent in the late-stage biopharmaceutical sector, especially for novel complement-targeting therapies.
Low due to extremely high capital requirements for late-stage clinical trials; Annexon's June 2025 cash was $227.0 million. You see, running a global Phase 3 trial, like the one for vonaprument (ANX007) in Geographic Atrophy (GA), demands massive, sustained investment. Annexon reported Research and Development (R&D) expenses of $44.2 million for the quarter ended June 30, 2025, reflecting this cost. Even with a recent capital raise, the burn rate associated with pivotal trials acts as a significant deterrent for smaller players looking to enter this specific therapeutic space.
Significant regulatory barriers, including FDA Biologics License Application (BLA) and EMA Marketing Authorization Application (MAA) processes, also keep the door shut. Annexon is actively navigating these, with the Tanruprubart (ANX005) MAA submission in Europe anticipated in the first quarter of 2026. Furthermore, ongoing discussions with the FDA regarding a generalizability package to support a BLA show the complexity of meeting agency requirements for novel data sets. The sheer volume of documentation and clinical evidence required to even file these applications is a barrier in itself.
Strong intellectual property (IP) protection around the C1q-targeting platform creates a patent barrier. Annexon's entire platform hinges on this proprietary science, which is protected by patents covering their mechanism of action and specific molecules. Any new entrant would face the immediate challenge of designing around this existing, established IP estate, a process that is both time-consuming and expensive. The company's ability to adequately maintain intellectual property rights for its product candidates is a stated risk, but the existing protection is robust.
Need for highly specialized scientific expertise in complement biology and neuroinflammation is another major entry barrier. Developing therapies that precisely modulate the classical complement cascade, as Annexon does with its C1q-targeting approach, requires deep, niche scientific understanding. This isn't a field where a generalist biotech can easily pivot; it demands specialized teams with proven track records in this specific area of immunology and neuroscience.
Long development timeline; ANX007 Phase 3 topline data is not expected until H2 2026. This extended timeline means a new entrant would need years of capital and operational runway just to reach the same inflection point Annexon is targeting in the second half of 2026. The ARCHER II trial for vonaprument completed enrollment of 659 GA patients in July 2025, and the data readout is still over a year away from the late 2025 perspective. This long gestation period ties up capital that could otherwise be deployed elsewhere.
Here's a quick look at the financial context surrounding these late-stage efforts as of late 2025:
| Financial Metric | Date of Record | Amount/Value |
| Cash and Short-Term Investments | June 30, 2025 | $227.0 million |
| Cash and Short-Term Investments | September 30, 2025 | $188.7 million |
| R&D Expenses (Q2 2025) | Quarter Ended June 30, 2025 | $44.2 million |
| R&D Expenses (Q3 2025) | Quarter Ended September 30, 2025 | $49.7 million |
| Projected Cash Runway (from June 30, 2025) | Into | Q4 2026 |
| Projected Cash Runway (from Sept 30, 2025) | Into | Late Q1 2027 |
The regulatory and development milestones Annexon is facing also illustrate the required commitment:
- Vonaprument (ANX007) Phase 3 ARCHER II Enrollment: 659 patients completed enrollment by July 2025.
- Tanruprubart (ANX005) MAA Submission Target: First quarter of 2026.
- Vonaprument (ANX007) Topline Data Expectation: Second half of 2026.
- ANX1502 Proof-of-Concept Study Completion Target: 2026.
Honestly, the combination of needing hundreds of millions to fund trials and the uncertainty of regulatory success means only well-capitalized, specialized firms could realistically attempt to enter this specific segment of complement biology right now.
Finance: draft 13-week cash view by Friday.Disclaimer
All information, articles, and product details provided on this website are for general informational and educational purposes only. We do not claim any ownership over, nor do we intend to infringe upon, any trademarks, copyrights, logos, brand names, or other intellectual property mentioned or depicted on this site. Such intellectual property remains the property of its respective owners, and any references here are made solely for identification or informational purposes, without implying any affiliation, endorsement, or partnership.
We make no representations or warranties, express or implied, regarding the accuracy, completeness, or suitability of any content or products presented. Nothing on this website should be construed as legal, tax, investment, financial, medical, or other professional advice. In addition, no part of this site—including articles or product references—constitutes a solicitation, recommendation, endorsement, advertisement, or offer to buy or sell any securities, franchises, or other financial instruments, particularly in jurisdictions where such activity would be unlawful.
All content is of a general nature and may not address the specific circumstances of any individual or entity. It is not a substitute for professional advice or services. Any actions you take based on the information provided here are strictly at your own risk. You accept full responsibility for any decisions or outcomes arising from your use of this website and agree to release us from any liability in connection with your use of, or reliance upon, the content or products found herein.