
|
Alexandria Real Estate Equities, Inc. (ARE) DCF Valuation |
Fully Editable: Tailor To Your Needs In Excel Or Sheets
Professional Design: Trusted, Industry-Standard Templates
Investor-Approved Valuation Models
MAC/PC Compatible, Fully Unlocked
No Expertise Is Needed; Easy To Follow
Alexandria Real Estate Equities, Inc. (ARE) Bundle
Whether you’re an investor or an analyst, this (ARE) DCF Calculator is your go-to resource for accurate valuation. Equipped with real data from Alexandria Real Estate Equities, Inc., you can adjust forecasts and observe the effects in real-time.
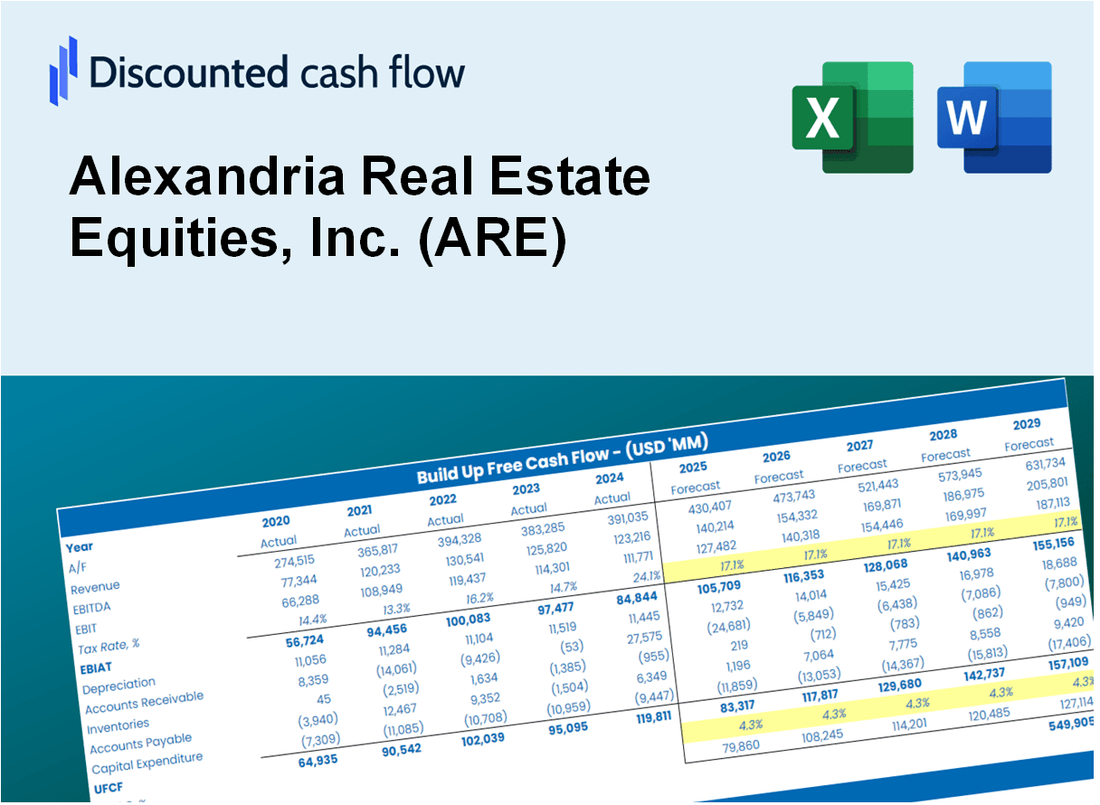
Discounted Cash Flow (DCF) - (USD MM)
| Year | AY1 2020 |
AY2 2021 |
AY3 2022 |
AY4 2023 |
AY5 2024 |
FY1 2025 |
FY2 2026 |
FY3 2027 |
FY4 2028 |
FY5 2029 |
|---|---|---|---|---|---|---|---|---|---|---|
| Revenue | 1,885.6 | 2,114.2 | 2,589.0 | 2,842.5 | 3,049.7 | 3,443.6 | 3,888.3 | 4,390.5 | 4,957.5 | 5,597.8 |
| Revenue Growth, % | 0 | 12.12 | 22.46 | 9.79 | 7.29 | 12.91 | 12.91 | 12.91 | 12.91 | 12.91 |
| EBITDA | 1,230.2 | 1,351.4 | 1,629.2 | 1,448.7 | 1,899.0 | 2,102.8 | 2,374.4 | 2,681.0 | 3,027.3 | 3,418.3 |
| EBITDA, % | 65.24 | 63.92 | 62.93 | 50.97 | 62.27 | 61.06 | 61.06 | 61.06 | 61.06 | 61.06 |
| Depreciation | 987.6 | 1,552.4 | 2,374.8 | 1,093.5 | 1,202.4 | 2,034.7 | 2,297.4 | 2,594.2 | 2,929.2 | 3,307.5 |
| Depreciation, % | 52.38 | 73.43 | 91.73 | 38.47 | 39.43 | 59.09 | 59.09 | 59.09 | 59.09 | 59.09 |
| EBIT | 242.6 | -201.1 | -745.6 | 355.2 | 696.6 | 68.1 | 76.9 | 86.9 | 98.1 | 110.8 |
| EBIT, % | 12.86 | -9.51 | -28.8 | 12.5 | 22.84 | 1.98 | 1.98 | 1.98 | 1.98 | 1.98 |
| Total Cash | 568.5 | 361.3 | 825.2 | 618.2 | 552.1 | 819.4 | 925.2 | 1,044.7 | 1,179.6 | 1,331.9 |
| Total Cash, percent | .0 | .0 | .0 | .0 | .0 | .0 | .0 | .0 | .0 | .0 |
| Account Receivables | 48.6 | 91.1 | 66.8 | 64.1 | 168.5 | 118.8 | 134.1 | 151.5 | 171.0 | 193.1 |
| Account Receivables, % | 2.58 | 4.31 | 2.58 | 2.26 | 5.52 | 3.45 | 3.45 | 3.45 | 3.45 | 3.45 |
| Inventories | .0 | .0 | .0 | .0 | .0 | .0 | .0 | .0 | .0 | .0 |
| Inventories, % | 0 | 0 | 0 | 0 | 0 | 0 | 0 | 0 | 0 | 0 |
| Accounts Payable | 285.0 | 513.4 | 389.7 | 524.4 | 534.8 | 622.9 | 703.3 | 794.2 | 896.7 | 1,012.5 |
| Accounts Payable, % | 15.12 | 24.28 | 15.05 | 18.45 | 17.54 | 18.09 | 18.09 | 18.09 | 18.09 | 18.09 |
| Capital Expenditure | -3,268.8 | -7,333.9 | .0 | .0 | .0 | -1,377.4 | -1,555.3 | -1,756.2 | -1,983.0 | -2,239.1 |
| Capital Expenditure, % | -173.35 | -346.9 | 0 | 0 | 0 | -40 | -40 | -40 | -40 | -40 |
| Tax Rate, % | 36.77 | 36.77 | 36.77 | 36.77 | 36.77 | 36.77 | 36.77 | 36.77 | 36.77 | 36.77 |
| EBITAT | 173.4 | -128.1 | -579.9 | 131.0 | 440.5 | 42.7 | 48.2 | 54.4 | 61.4 | 69.3 |
| Depreciation | ||||||||||
| Changes in Account Receivables | ||||||||||
| Changes in Inventories | ||||||||||
| Changes in Accounts Payable | ||||||||||
| Capital Expenditure | ||||||||||
| UFCF | -1,871.4 | -5,723.7 | 1,695.5 | 1,361.9 | 1,548.9 | 837.6 | 855.4 | 965.9 | 1,090.6 | 1,231.5 |
| WACC, % | 5.7 | 5.53 | 5.84 | 4.94 | 5.52 | 5.51 | 5.51 | 5.51 | 5.51 | 5.51 |
| PV UFCF | ||||||||||
| SUM PV UFCF | 4,207.0 | |||||||||
| Long Term Growth Rate, % | 4.00 | |||||||||
| Free cash flow (T + 1) | 1,281 | |||||||||
| Terminal Value | 85,066 | |||||||||
| Present Terminal Value | 65,070 | |||||||||
| Enterprise Value | 69,277 | |||||||||
| Net Debt | 12,199 | |||||||||
| Equity Value | 57,078 | |||||||||
| Diluted Shares Outstanding, MM | 172 | |||||||||
| Equity Value Per Share | 331.71 |
What You Will Get
- Editable Excel Template: A fully customizable Excel-based DCF Calculator featuring pre-filled real ARE financials.
- Real-World Data: Historical data and forward-looking estimates (as highlighted in the yellow cells).
- Forecast Flexibility: Adjust forecast assumptions such as revenue growth, EBITDA %, and WACC.
- Automatic Calculations: Instantly observe how your inputs affect Alexandria Real Estate Equities, Inc. (ARE) valuation.
- Professional Tool: Designed for investors, CFOs, consultants, and financial analysts.
- User-Friendly Design: Organized for clarity and ease of use, complete with step-by-step instructions.
Key Features
- Real-Life ARE Data: Pre-filled with Alexandria Real Estate Equities, Inc.'s historical financials and future growth projections.
- Fully Customizable Inputs: Modify revenue growth rates, operating margins, WACC, tax rates, and capital expenditures as needed.
- Dynamic Valuation Model: Automatically updates Net Present Value (NPV) and intrinsic value based on your customized inputs.
- Scenario Testing: Develop multiple forecasting scenarios to explore various valuation outcomes.
- User-Friendly Design: Intuitive, organized, and crafted for both professionals and newcomers.
How It Works
- Download the Template: Gain immediate access to the Excel-based ARE DCF Calculator.
- Input Your Assumptions: Modify the yellow-highlighted cells for growth rates, WACC, margins, and more.
- Instant Calculations: The model automatically recalculates Alexandria Real Estate Equities' intrinsic value.
- Test Scenarios: Experiment with various assumptions to assess potential valuation fluctuations.
- Analyze and Decide: Utilize the findings to inform your investment or financial analysis.
Why Choose Alexandria Real Estate Equities, Inc. (ARE)?
- Save Time: Utilize our comprehensive tools without the hassle of building from the ground up.
- Enhance Accuracy: Access to trusted real estate data and analytics minimizes valuation errors.
- Fully Customizable: Adjust the model to align with your specific market insights and forecasts.
- User-Friendly: Intuitive visuals and outputs simplify the interpretation of results.
- Preferred by Professionals: Developed for industry leaders who prioritize accuracy and efficiency.
Who Should Use Alexandria Real Estate Equities, Inc. (ARE)?
- Real Estate Students: Explore property valuation methods and apply them to real-world scenarios.
- Researchers: Integrate advanced real estate models into academic studies or projects.
- Investors: Validate your investment strategies and evaluate market trends for Alexandria Real Estate Equities, Inc. (ARE).
- Market Analysts: Enhance your analysis with a ready-to-use, customizable financial model tailored for real estate.
- Property Managers: Understand how large-scale real estate companies like Alexandria Real Estate Equities, Inc. (ARE) operate and are assessed.
What the Template Contains
- Preloaded ARE Data: Historical and projected financial data, including revenue, EBIT, and capital expenditures.
- DCF and WACC Models: Professional-grade sheets for calculating intrinsic value and Weighted Average Cost of Capital.
- Editable Inputs: Yellow-highlighted cells for adjusting revenue growth, tax rates, and discount rates.
- Financial Statements: Comprehensive annual and quarterly financials for deeper analysis.
- Key Ratios: Profitability, leverage, and efficiency ratios to evaluate performance.
- Dashboard and Charts: Visual summaries of valuation outcomes and assumptions.
Disclaimer
All information, articles, and product details provided on this website are for general informational and educational purposes only. We do not claim any ownership over, nor do we intend to infringe upon, any trademarks, copyrights, logos, brand names, or other intellectual property mentioned or depicted on this site. Such intellectual property remains the property of its respective owners, and any references here are made solely for identification or informational purposes, without implying any affiliation, endorsement, or partnership.
We make no representations or warranties, express or implied, regarding the accuracy, completeness, or suitability of any content or products presented. Nothing on this website should be construed as legal, tax, investment, financial, medical, or other professional advice. In addition, no part of this site—including articles or product references—constitutes a solicitation, recommendation, endorsement, advertisement, or offer to buy or sell any securities, franchises, or other financial instruments, particularly in jurisdictions where such activity would be unlawful.
All content is of a general nature and may not address the specific circumstances of any individual or entity. It is not a substitute for professional advice or services. Any actions you take based on the information provided here are strictly at your own risk. You accept full responsibility for any decisions or outcomes arising from your use of this website and agree to release us from any liability in connection with your use of, or reliance upon, the content or products found herein.