
|
Amer Sports, Inc. (AS) DCF Valuation |
Fully Editable: Tailor To Your Needs In Excel Or Sheets
Professional Design: Trusted, Industry-Standard Templates
Investor-Approved Valuation Models
MAC/PC Compatible, Fully Unlocked
No Expertise Is Needed; Easy To Follow
Amer Sports, Inc. (AS) Bundle
Designed for accuracy, our (AS) DCF Calculator empowers you to assess the valuation of Amer Sports, Inc. using real-world financial data, along with complete flexibility to modify all essential parameters for improved projections.
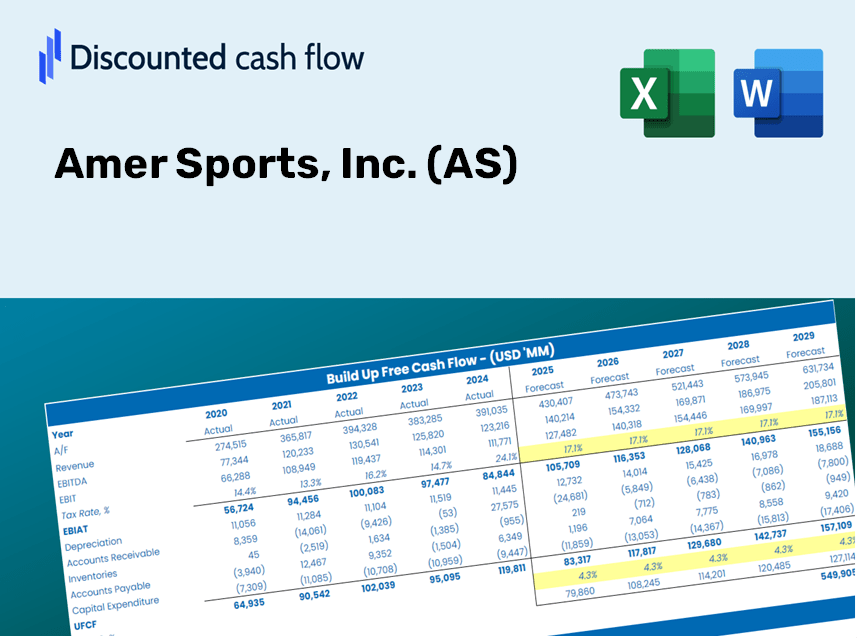
Discounted Cash Flow (DCF) - (USD MM)
| Year | AY1 2020 |
AY2 2021 |
AY3 2022 |
AY4 2023 |
AY5 2024 |
FY1 2025 |
FY2 2026 |
FY3 2027 |
FY4 2028 |
FY5 2029 |
|---|---|---|---|---|---|---|---|---|---|---|
| Revenue | 2,446.3 | 3,066.5 | 3,571.2 | 4,368.4 | 5,183.3 | 6,256.1 | 7,550.9 | 9,113.8 | 11,000.0 | 13,276.7 |
| Revenue Growth, % | 0 | 25.35 | 16.46 | 22.32 | 18.65 | 20.7 | 20.7 | 20.7 | 20.7 | 20.7 |
| EBITDA | 304.9 | 384.5 | 260.6 | 521.1 | 653.8 | 711.2 | 858.4 | 1,036.1 | 1,250.5 | 1,509.4 |
| EBITDA, % | 12.46 | 12.54 | 7.3 | 11.93 | 12.61 | 11.37 | 11.37 | 11.37 | 11.37 | 11.37 |
| Depreciation | 179.9 | 195.7 | 194.3 | 220.9 | 273.8 | 369.3 | 445.7 | 538.0 | 649.3 | 783.7 |
| Depreciation, % | 7.35 | 6.38 | 5.44 | 5.06 | 5.28 | 5.9 | 5.9 | 5.9 | 5.9 | 5.9 |
| EBIT | 125.0 | 188.8 | 66.3 | 300.2 | 380.0 | 341.9 | 412.7 | 498.1 | 601.2 | 725.6 |
| EBIT, % | 5.11 | 6.16 | 1.86 | 6.87 | 7.33 | 5.47 | 5.47 | 5.47 | 5.47 | 5.47 |
| Total Cash | 389.5 | 566.7 | 402.0 | 483.4 | 345.4 | 793.1 | 957.3 | 1,155.4 | 1,394.6 | 1,683.2 |
| Total Cash, percent | .0 | .0 | .0 | .0 | .0 | .0 | .0 | .0 | .0 | .0 |
| Account Receivables | 602.9 | 629.7 | 757.9 | 717.0 | 746.7 | 1,216.5 | 1,468.2 | 1,772.1 | 2,138.9 | 2,581.6 |
| Account Receivables, % | 24.65 | 20.53 | 21.22 | 16.41 | 14.41 | 19.44 | 19.44 | 19.44 | 19.44 | 19.44 |
| Inventories | 569.5 | 512.5 | 855.0 | 1,099.6 | 1,223.3 | 1,410.2 | 1,702.1 | 2,054.4 | 2,479.6 | 2,992.7 |
| Inventories, % | 23.28 | 16.71 | 23.94 | 25.17 | 23.6 | 22.54 | 22.54 | 22.54 | 22.54 | 22.54 |
| Accounts Payable | 293.0 | 320.2 | 435.6 | 426.5 | 549.0 | 687.8 | 830.2 | 1,002.0 | 1,209.4 | 1,459.7 |
| Accounts Payable, % | 11.98 | 10.44 | 12.2 | 9.76 | 10.59 | 10.99 | 10.99 | 10.99 | 10.99 | 10.99 |
| Capital Expenditure | -93.7 | -83.7 | -113.9 | -151.8 | -288.0 | -235.0 | -283.6 | -342.3 | -413.1 | -498.6 |
| Capital Expenditure, % | -3.83 | -2.73 | -3.19 | -3.47 | -5.56 | -3.76 | -3.76 | -3.76 | -3.76 | -3.76 |
| Tax Rate, % | 54.96 | 54.96 | 54.96 | 54.96 | 54.96 | 54.96 | 54.96 | 54.96 | 54.96 | 54.96 |
| EBITAT | 201.2 | 509.4 | 89.8 | 598.7 | 171.1 | 304.3 | 367.3 | 443.3 | 535.1 | 645.8 |
| Depreciation | ||||||||||
| Changes in Account Receivables | ||||||||||
| Changes in Inventories | ||||||||||
| Changes in Accounts Payable | ||||||||||
| Capital Expenditure | ||||||||||
| UFCF | -592.0 | 678.9 | -185.2 | 455.0 | 126.0 | -79.2 | 128.2 | 154.7 | 186.7 | 225.4 |
| WACC, % | 17.57 | 17.57 | 17.57 | 17.57 | 16.81 | 17.42 | 17.42 | 17.42 | 17.42 | 17.42 |
| PV UFCF | ||||||||||
| SUM PV UFCF | 320.3 | |||||||||
| Long Term Growth Rate, % | 2.00 | |||||||||
| Free cash flow (T + 1) | 230 | |||||||||
| Terminal Value | 1,491 | |||||||||
| Present Terminal Value | 668 | |||||||||
| Enterprise Value | 988 | |||||||||
| Net Debt | 1,138 | |||||||||
| Equity Value | -150 | |||||||||
| Diluted Shares Outstanding, MM | 502 | |||||||||
| Equity Value Per Share | -0.30 |
What You Will Receive
- Authentic AS Financial Data: Pre-populated with Amer Sports’ historical and forecasted data for accurate analysis.
- Completely Customizable Template: Easily adjust essential inputs such as revenue growth, WACC, and EBITDA %.
- Instant Calculations: Watch the intrinsic value of Amer Sports update in real-time as you make adjustments.
- Professional Valuation Tool: Tailored for investors, analysts, and consultants looking for reliable DCF insights.
- User-Friendly Interface: Straightforward layout and clear guidance suitable for all skill levels.
Key Features
- Real-Life AS Data: Pre-populated with Amer Sports’ historical financial performance and forward-looking estimates.
- Fully Customizable Inputs: Modify revenue growth rates, profit margins, WACC, tax rates, and capital expenditures as needed.
- Dynamic Valuation Model: Instant updates to Net Present Value (NPV) and intrinsic value based on your customized inputs.
- Scenario Testing: Develop multiple forecasting scenarios to evaluate various valuation outcomes.
- User-Friendly Design: A straightforward and structured interface tailored for both professionals and those new to finance.
How It Works
- Step 1: Download the Excel file.
- Step 2: Examine Amer Sports, Inc.'s (AS) pre-filled financial data and projections.
- Step 3: Adjust key inputs such as revenue growth, WACC, and tax rates (highlighted cells).
- Step 4: Observe the DCF model update immediately as you modify assumptions.
- Step 5: Evaluate the results and utilize the findings for your investment strategies.
Why Choose This Calculator for Amer Sports, Inc. (AS)?
- Precision: Rely on accurate financial data from Amer Sports for informed decision-making.
- Versatility: Tailored for users to freely experiment with and adjust inputs as needed.
- Efficiency: Eliminate the complexity of creating a DCF model from the ground up.
- Expert-Level: Crafted with the meticulousness and practicality suited for CFOs.
- Accessible: Intuitive design makes it suitable for users of all skill levels, including those new to financial modeling.
Who Can Benefit from Amer Sports, Inc. (AS)?
- Sports Management Students: Understand valuation methods and apply them to real-world scenarios.
- Researchers: Utilize industry-standard models in your academic studies or publications.
- Investors: Evaluate your investment strategies and assess valuation results for Amer Sports, Inc. (AS).
- Market Analysts: Enhance your analysis with a customizable DCF model tailored for sports industry insights.
- Entrepreneurs: Discover how major sports companies like Amer Sports, Inc. (AS) are valued in the market.
What the Template Includes
- Preloaded AS Data: Historical and projected financial information, encompassing revenue, EBIT, and capital expenditures.
- DCF and WACC Models: High-quality sheets for calculating intrinsic value and Weighted Average Cost of Capital.
- Editable Inputs: Yellow-highlighted cells for modifying revenue growth, tax rates, and discount rates.
- Financial Statements: Detailed annual and quarterly financials for in-depth analysis.
- Key Ratios: Profitability, leverage, and efficiency ratios to assess performance.
- Dashboard and Charts: Visual representations of valuation results and key assumptions.
Disclaimer
All information, articles, and product details provided on this website are for general informational and educational purposes only. We do not claim any ownership over, nor do we intend to infringe upon, any trademarks, copyrights, logos, brand names, or other intellectual property mentioned or depicted on this site. Such intellectual property remains the property of its respective owners, and any references here are made solely for identification or informational purposes, without implying any affiliation, endorsement, or partnership.
We make no representations or warranties, express or implied, regarding the accuracy, completeness, or suitability of any content or products presented. Nothing on this website should be construed as legal, tax, investment, financial, medical, or other professional advice. In addition, no part of this site—including articles or product references—constitutes a solicitation, recommendation, endorsement, advertisement, or offer to buy or sell any securities, franchises, or other financial instruments, particularly in jurisdictions where such activity would be unlawful.
All content is of a general nature and may not address the specific circumstances of any individual or entity. It is not a substitute for professional advice or services. Any actions you take based on the information provided here are strictly at your own risk. You accept full responsibility for any decisions or outcomes arising from your use of this website and agree to release us from any liability in connection with your use of, or reliance upon, the content or products found herein.