
|
Asana, Inc. (ASAN): 5 FORCES Analysis [Nov-2025 Updated] |
Fully Editable: Tailor To Your Needs In Excel Or Sheets
Professional Design: Trusted, Industry-Standard Templates
Investor-Approved Valuation Models
MAC/PC Compatible, Fully Unlocked
No Expertise Is Needed; Easy To Follow
Asana, Inc. (ASAN) Bundle
You're looking to size up the real competitive moat around Asana, Inc. (ASAN) as we hit late 2025, and honestly, the landscape is brutal. With FY2025 revenue growth slowing to 11% because of the fight against giants like Microsoft and well-funded peers like ClickUp, understanding the pressure points is critical. We see high customer leverage, evidenced by a dollar-based net retention rate dipping to 96% in Q4 FY2025, balanced against moderate switching costs for those 726 enterprise accounts spending over $100k. To get the full, precise picture of where the risks and opportunities truly lie-from supplier dependencies like AWS to the threat of new entrants-you need to see the five forces breakdown we mapped out right here.
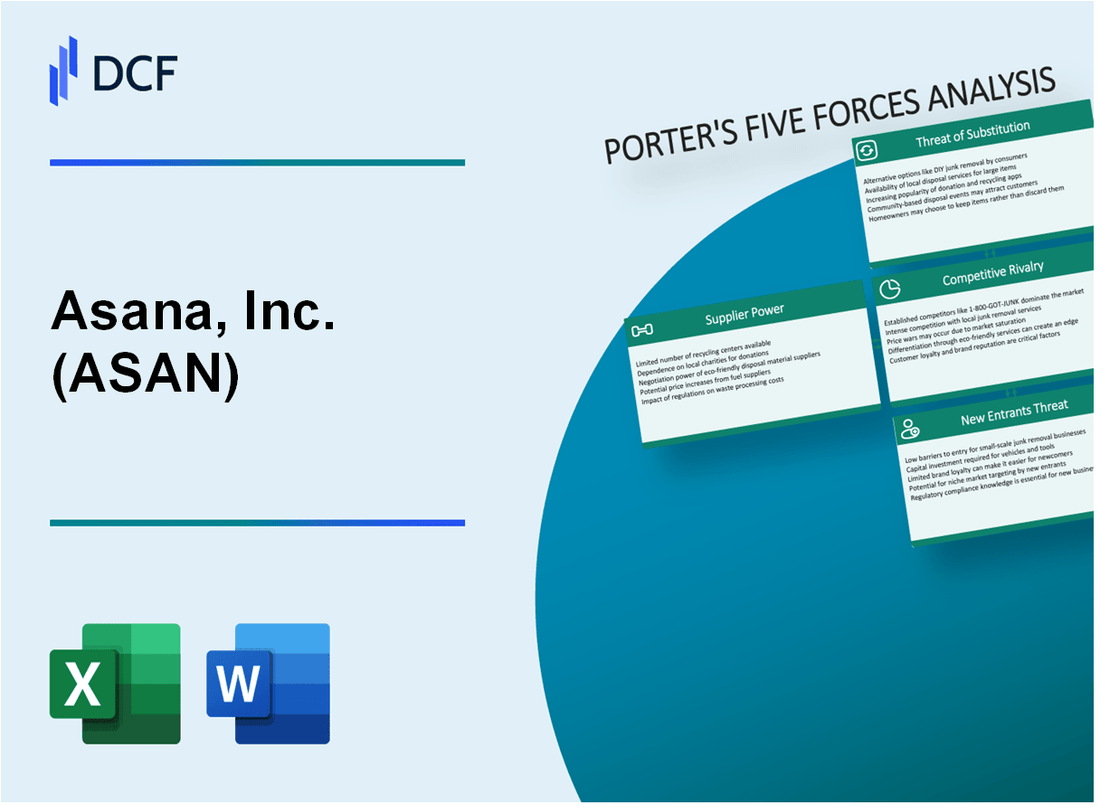
Asana, Inc. (ASAN) - Porter's Five Forces: Bargaining power of suppliers
When looking at Asana, Inc.'s supplier landscape as of late 2025, you see a mixed bag of power dynamics. It's not a simple case of high or low power; it really depends on which supplier category we are discussing. For a company that reported revenues of $723.9 million for the full fiscal year 2025, managing these external dependencies is key to maintaining margin control, especially as the company works toward its Non-GAAP operating margin goal of at least 5% for fiscal year 2026.
Low power from generic software developers; core technology is proprietary Work Graph
For the foundational elements of the platform that aren't infrastructure, the power held by generic software component developers is relatively low. Asana's core competitive advantage rests on its proprietary Work Graph data model. This technology is designed to connect tasks, projects, portfolios, and goals, adding structure to unstructured work. Because this data model is unique to Asana, Inc., it insulates the company from having to rely heavily on off-the-shelf software solutions for its central value proposition, which helps keep the bargaining power of those generalist suppliers in check.
High power from cloud infrastructure providers like AWS, a critical dependency for scale
The story flips dramatically when we consider the infrastructure layer. As a modern SaaS provider, Asana, Inc. is critically dependent on hyperscale cloud infrastructure providers, with the 'big three'-including AWS-dominating the market. In 2025, global public cloud spend is projected to surpass $679 billion, underscoring the essential nature of this input. While Asana, Inc.'s scale-evidenced by having 683 customers spending $100,000 or more annualized in Q3 FY2025, an 18% year-over-year increase-gives it some negotiating muscle, the fundamental dependency remains high. For organizations, moving mission-critical workloads to the cloud means that vendor lock-in is a real concern, as switching providers is a massive undertaking that requires re-architecting significant operational layers.
Increasing power from specialized AI model providers, a new input for Asana AI Studio
A new and rapidly evolving source of supplier power comes from specialized Artificial Intelligence (AI) model providers. Asana, Inc. has heavily invested in integrating AI via its AI Studio, which launched to the entire customer base by September 2025. This studio allows customers to design and deploy AI agents within workflows, leveraging the Work Graph for context. The consumption-based model for AI Studio means that the cost of these underlying models directly impacts Asana's variable costs and margin potential. While Asana, Inc. offers a free tier of 200,000 credits per month, usage beyond that requires paid add-ons, putting the pricing power of the foundational model suppliers directly into play for Asana's future profitability.
Asana's scale gives some leverage, but switching cloud providers is still a massive undertaking
You can definitely push for better terms, but the commitment is sticky. For instance, negotiation guides suggest that leveraging multi-year agreements with Asana, Inc. can yield discounts in the range of 5% to 15% on their subscription fees. This suggests that while Asana, Inc. has leverage over its customers in contract negotiations, the leverage Asana, Inc. itself has over its primary infrastructure suppliers is constrained by the sheer difficulty and cost of migration. The industry recognizes that 32% of cloud spend is wasted in 2025, yet companies are still hesitant to move workloads due to complexity. This reality means that even with Asana, Inc.'s growth, the cost structure is heavily influenced by the pricing power of the dominant cloud platforms.
Here is a quick look at the financial context influencing supplier negotiations:
| Metric | Value (FY2025 or Latest Data) | Source Context |
|---|---|---|
| FY2025 Total Revenue | $723.9 million | Reported full fiscal year revenue |
| Q3 FY2025 Revenue | $183.9 million | Quarterly revenue performance |
| Customers Spending $100k+ (Q3 FY2025) | 683 | Indication of enterprise scale and customer concentration |
| AI Studio Free Credit Cap (Monthly) | 200,000 credits | Base level for consumption-based AI features |
| Estimated Wasted Cloud Spend (2025) | 32% | Industry benchmark highlighting infrastructure cost challenges |
The power dynamic is further complicated by the nature of the AI input, which is consumption-based and tied to external models. You need to watch the gross margin impact of the AI Studio rollout closely.
- Proprietary Work Graph reduces reliance on generic software components.
- Cloud infrastructure dependency is high for scale and resilience.
- AI model providers gain leverage through the AI Studio consumption model.
- Scale provides some negotiation leverage, but cloud switching costs are immense.
Finance: draft 13-week cash view by Friday.
Asana, Inc. (ASAN) - Porter's Five Forces: Bargaining power of customers
You're looking at the customer leverage in the work management space, and for Asana, Inc., it's a mixed picture. For smaller teams, the power is definitely higher because the barrier to entry is low. Think about it: there are plenty of low-cost or free tools out there, so if Asana, Inc. pushes pricing too hard, those smaller accounts can walk without much friction.
That pressure shows up in the net retention figures. The overall dollar-based net retention rate (DBNRR) for Asana, Inc. in the fourth quarter of fiscal year 2025 clocked in at 96%. When that number dips below 100%, it means that the revenue lost from customers downgrading or churning outweighed the expansion revenue from existing customers over that trailing twelve-month period. That 4% gap represents real customer leverage.
Now, look at the big spenders. The number of enterprise customers spending $100,000 or more on an annualized basis reached 726 in Q4 FY2025, which was a 20% increase year over year. These 726 organizations definitely have leverage for custom deals; they are large enough to demand specific terms, integrations, or pricing structures. They are the ones who can negotiate.
Still, the deep integration into workflows creates stickiness, especially at the high end. The DBNRR for these top-tier customers spending $100,000+ was 96% in Q4 FY2025, which is the same as the overall rate, suggesting that while some contraction happened, the stickiness is holding the large accounts relatively stable, even if it's not showing net expansion in that specific quarter.
Here's a quick look at how the retention rates break down across the customer base as of Q4 FY2025:
| Customer Segment | Annual Spend Threshold | Q4 FY2025 DBNRR |
| Overall | N/A | 96% |
| Core Customers | $\ge \$5,000$ | 97% |
| Enterprise Customers | $\ge \$100,000$ | 96% |
The fact that Core Customers (those spending $\ge \$5,000$ annually, numbering 24,062 in Q4 FY2025) had a slightly better DBNRR at 97% compared to the enterprise segment at 96% is interesting. It suggests that while the small-to-mid-market segment is growing slightly faster from its base, the largest customers are either plateauing or experiencing slightly more net contraction.
The moderate switching costs are tied directly to workflow depth. When a team has built out complex processes, custom fields, and integrations-especially with new features like the Asana AI Studio integration with AWS' Q Business-the cost to rip and replace becomes significant. You're not just moving data; you're re-engineering how work connects to goals across the organization.
The leverage points for customers are clear:
- Low-cost alternatives exist for smaller deployments.
- Overall DBNRR of 96% shows net revenue loss from existing customers.
- 726 customers spending $\ge \$100,000+$ demand custom terms.
- Enterprise DBNRR of 96% indicates some level of contraction at the top end.
Finance: draft the impact analysis of the 4% net revenue contraction on the Q1 FY2026 revenue guidance by Friday.
Asana, Inc. (ASAN) - Porter's Five Forces: Competitive rivalry
You're looking at a market where every new feature announcement is met with an immediate, often better-funded, response. Honestly, the competitive rivalry in the collaborative work management (CWM) space is defintely a top-tier concern for Asana, Inc. (ASAN). This isn't a quiet niche; it's a battleground for how the world organizes its work.
The intensity is clear when you map out the revenue scale of the direct, publicly-traded peers. Asana, Inc. (ASAN) posted Fiscal Year 2025 revenue of $723.9 million. That 11% year-over-year growth for FY2025 reflects the constant pressure to acquire and retain seats in this crowded field.
The competition isn't just from other pure-play CWM vendors; it's from platform giants whose collaboration tools are bundled or deeply integrated. Microsoft, for instance, leads the broader Collaboration software market with a 19.1% share in 2024, leveraging Copilot across Teams and Planner. Atlassian, with Jira and Trello, owns significant mindshare, especially in technical and agile environments.
Here's a quick look at the revenue scale of the most direct, well-funded rivals based on their latest reported or guided figures for the same period:
| Competitor | Metric | Amount (USD/Approx.) | Context/Year |
|---|---|---|---|
| Asana, Inc. (ASAN) | FY2025 Revenue | $723.9 million | FY2025 (Ended Jan 31, 2025) |
| monday.com (MNDY) | FY2025 Revenue Guidance | $1,226 million to $1,228 million | FY2025 Guidance |
| Smartsheet (SMAR) | FY2025 Revenue Guidance | $1.116 billion to $1.121 billion | FY2025 Guidance |
| Microsoft | Collaboration Software Market Share | 19.1% | 2024 |
The battle is fought on multiple fronts, from enterprise adoption to feature parity. You see this in the customer metrics Asana, Inc. (ASAN) reports, which are direct indicators of competitive wins and losses. If onboarding takes 14+ days, churn risk rises because a competitor is likely offering a faster path to value.
The competitive landscape includes a broad set of players, each chipping away at the CWM market, which is projected to hit $12.2 billion by 2025. The top five vendors in this space account for 50% of the market share, meaning the remaining half is highly fragmented, which is where smaller, focused rivals can gain traction.
The key rivals vying for the same customer spend include:
- Atlassian (Jira, Trello)
- ClickUp
- Microsoft (Teams, Planner)
- Smartsheet
- monday.com
- Wrike
- Airtable
- Notion
The pressure forces Asana, Inc. (ASAN) to invest heavily, evidenced by their focus on AI Studio, which is meant to expand the addressable market, but also requires significant R&D spend to keep pace with rivals integrating generative AI across their platforms. The slowing growth rate-FY2026 revenue guidance suggests 8% to 9% growth, down from the 11% in FY2025-is a direct symptom of this intense rivalry. Finance: draft 13-week cash view by Friday.
Asana, Inc. (ASAN) - Porter's Five Forces: Threat of substitutes
You're looking at the landscape where Asana, Inc. has to fight for every dollar of spend, and honestly, the substitutes are everywhere, from the inbox to specialized enterprise suites. The threat here isn't just another project management app; it's the default way people have always worked.
Simple, non-specialized tools present a persistent, low-friction alternative for basic coordination. Consider the sheer volume of time dedicated to these substitutes. On average, an employee spends about 4.1 hours a day managing emails, and the average inbox contains only 38% truly important emails. That time spent sifting through threads and attachments is time not spent in a dedicated work graph. For smaller teams or simple projects, the cost and complexity of adopting a full platform like Asana, Inc. is a high barrier when a shared spreadsheet or a quick chat thread seems sufficient.
The broader productivity management software market size was valued at $70.44 billion in 2025, showing the massive pool of tools competing for the same budget dollars. While Asana, Inc. is focused on the enterprise, simpler, cheaper project management platforms still siphon off the low-hanging fruit. These alternatives often compete on price, offering basic task management for significantly less than Asana, Inc.'s per-seat licensing structure, though Asana, Inc. is pivoting with consumption-based models for AI Studio.
The threat also comes from above, where larger Enterprise Resource Planning (ERP) or Customer Relationship Management (CRM) systems are building out native project management capabilities to keep spending consolidated. These giants-think Microsoft Corporation or Oracle-can bundle work management features, making the marginal cost of using their existing platform for project tracking near zero for their existing customers. This absorption strategy is a major hurdle for pure-play SaaS companies like Asana, Inc.
Asana, Inc.'s primary defense against this substitution risk is its push into artificial intelligence. The launch of Asana AI Studio is designed to make the product fundamentally different from non-AI tools. This move is critical because, while 36% of knowledge workers are using AI at least weekly, the integration of AI directly into the workflow-like Asana AI Studio's no-code builder-creates stickiness. The company reported that customers spending $100,000 or more annually grew by 18% in Q3 Fiscal 2025, reaching 683 customers, signaling that larger clients are buying into this advanced differentiation.
Here's a quick look at the scale of the market and Asana, Inc.'s enterprise focus as of Q3 Fiscal 2025:
| Metric | Value | Context/Timeframe |
|---|---|---|
| Global Productivity Management Software Market Size | $70.44 billion | 2025 Estimate |
| Asana, Inc. Q3 FY2025 Revenue | $183.9 million | Year-over-Year Growth: 10% |
| Asana, Inc. Core Customers ($5k+ ARR) | 23,609 | Year-over-Year Growth: 11% |
| Asana, Inc. $100k+ ARR Customers | 683 | Year-over-Year Growth: 18% |
| Knowledge Workers Using AI Weekly | 36% | Current State of AI at Work |
The vectors for substitution are clear, but Asana, Inc. is fighting back with embedded intelligence. You need to watch how quickly AI Studio adoption translates into expansion revenue, especially since the dollar-based net retention rate for the $100k+ cohort was 99% in Q3 FY2025.
The main avenues for substitution include:
- Email and basic chat platforms for informal task tracking.
- Cheaper, feature-limited project management tools.
- Integrated modules within major ERP or CRM suites.
- Internal, custom-built solutions in large enterprises.
The success of Asana AI Studio, which the company believes has the potential to eclipse its current revenue scale over time, is the key lever to raise the switching cost and make substitution prohibitively difficult for high-value customers. If onboarding takes 14+ days, churn risk rises, but AI integration should shorten the perceived time-to-value.
Finance: draft 13-week cash view by Friday.
Asana, Inc. (ASAN) - Porter's Five Forces: Threat of new entrants
The ease of launching a basic work management tool is relatively low today, you know this well. Public cloud infrastructure means a new entrant does not need massive server farms to start. Asana, Inc. itself operates on a Software as a Service (SaaS) model, generating revenue on a per-seat basis across several pricing tiers, which is the standard entry point for many competitors.
However, scaling to Asana, Inc.'s enterprise level requires significant capital outlay. Developing features like the proprietary Work Graph data model and advanced AI capabilities, such as the recently launched Asana AI Studio, demands heavy, sustained investment in research and development. Furthermore, securing the trust of large organizations requires investment in compliance and security, as evidenced by the recent launch of Asana Gov, which is targeted to operate in a FedRAMP Moderate environment (currently designated "In Process"). This necessary investment creates a substantial capital barrier for any new player aiming for the high-value enterprise segment.
The threat from established tech giants is significant because they can enter the market effectively for free by bundling. You see this pressure clearly when looking at the productivity market share held by incumbents. Microsoft Office 365 commands 23.58% of the productivity market, and Google Docs holds 9.09%. These platforms can integrate a competing work management feature directly into their existing, universally adopted suites, bypassing the customer acquisition cost that Asana, Inc. must bear.
Asana, Inc. counters this threat by building stickiness through its proprietary technology and network effects. The Work Graph® is designed to capture the relationship between work, information, and people, aiming to break down silos. This platform scale is supported by a large installed base. As of fiscal 2025, Asana, Inc. reported having over 175,000 customers. The high-value segment shows this stickiness: as of July 31, 2025, the company reported 770 customers spending over \$100,000 annually. The momentum in AI adoption, where one customer cut manual work by 60% after adopting AI Studio, suggests these advanced features are increasing the cost of switching.
| Metric | Value / Amount | Date / Period |
|---|---|---|
| Total Customers | Over 175,000 | Fiscal Year 2025 |
| Customers Spending $\ge\$100,000$ Annually | 770 | As of July 31, 2025 |
| Customers Spending $\ge\$5,000$ Annually (Core) | 25,006 | As of July 31, 2025 |
| Fiscal Year 2025 Revenue | \$723.9 million | Ended January 31, 2025 |
| Q3 2025 Revenue | \$196.9 million | Quarter ended October 31, 2025 (reported Sept 3) |
| Fiscal Year 2025 GAAP Net Loss | \$255.5 million | Ended January 31, 2025 |
The barriers to entry for a basic offering include:
- Low initial cloud hosting costs.
- SaaS model adoption ease.
- Publicly available development tools.
The barriers to entry for an enterprise competitor include:
- Investment in proprietary data models like Work Graph.
- Achieving FedRAMP Moderate status for government.
- R&D spend for advanced AI Studio features.
- Building a customer base of 726+ companies spending over \$100,000 annually.
Disclaimer
All information, articles, and product details provided on this website are for general informational and educational purposes only. We do not claim any ownership over, nor do we intend to infringe upon, any trademarks, copyrights, logos, brand names, or other intellectual property mentioned or depicted on this site. Such intellectual property remains the property of its respective owners, and any references here are made solely for identification or informational purposes, without implying any affiliation, endorsement, or partnership.
We make no representations or warranties, express or implied, regarding the accuracy, completeness, or suitability of any content or products presented. Nothing on this website should be construed as legal, tax, investment, financial, medical, or other professional advice. In addition, no part of this site—including articles or product references—constitutes a solicitation, recommendation, endorsement, advertisement, or offer to buy or sell any securities, franchises, or other financial instruments, particularly in jurisdictions where such activity would be unlawful.
All content is of a general nature and may not address the specific circumstances of any individual or entity. It is not a substitute for professional advice or services. Any actions you take based on the information provided here are strictly at your own risk. You accept full responsibility for any decisions or outcomes arising from your use of this website and agree to release us from any liability in connection with your use of, or reliance upon, the content or products found herein.