
|
Alibaba Group Holding Limited (BABA) DCF Valuation |
Fully Editable: Tailor To Your Needs In Excel Or Sheets
Professional Design: Trusted, Industry-Standard Templates
Investor-Approved Valuation Models
MAC/PC Compatible, Fully Unlocked
No Expertise Is Needed; Easy To Follow
Alibaba Group Holding Limited (BABA) Bundle
Discover the true potential of Alibaba Group Holding Limited (BABA) with our advanced DCF Calculator! Adjust key assumptions, explore various scenarios, and evaluate the effects of changes on Alibaba Group Holding Limited (BABA) valuation – all within a single Excel template.
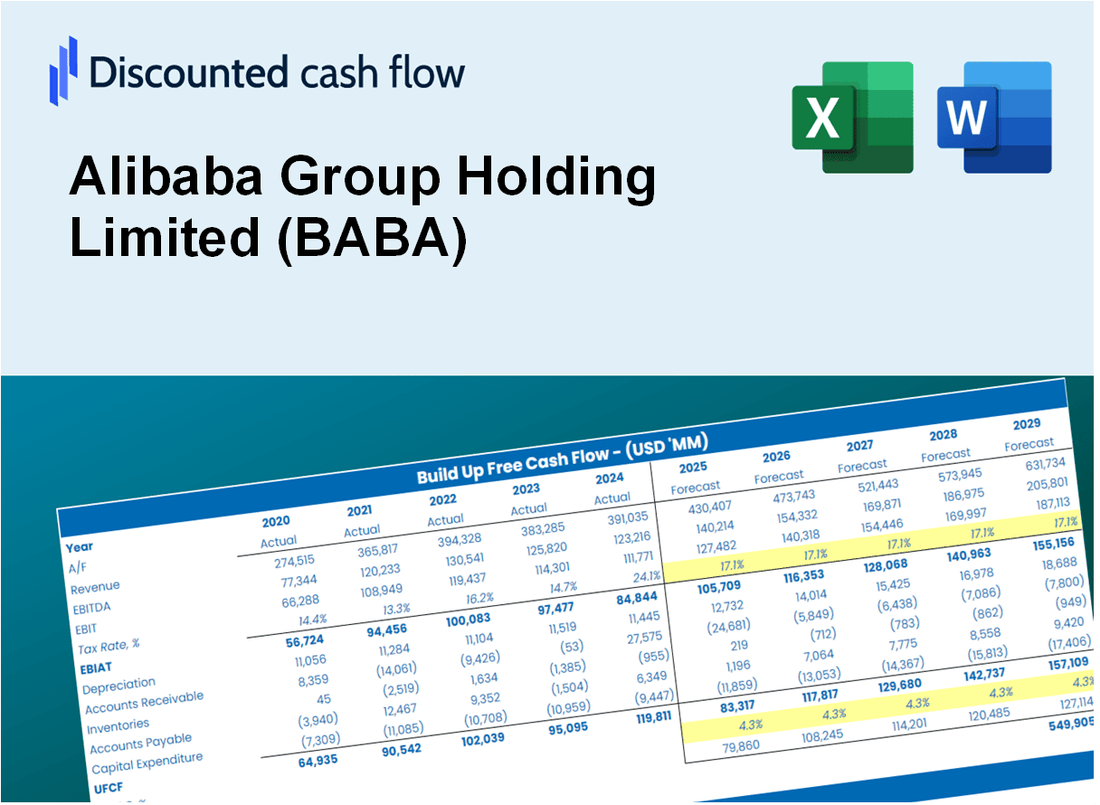
Discounted Cash Flow (DCF) - (USD MM)
| Year | AY1 2021 |
AY2 2022 |
AY3 2023 |
AY4 2024 |
AY5 2025 |
FY1 2026 |
FY2 2027 |
FY3 2028 |
FY4 2029 |
FY5 2030 |
|---|---|---|---|---|---|---|---|---|---|---|
| Revenue | 101,130.6 | 120,273.2 | 122,476.2 | 132,695.3 | 140,475.0 | 150,679.1 | 161,624.5 | 173,364.9 | 185,958.2 | 199,466.2 |
| Revenue Growth, % | 0 | 18.93 | 1.83 | 8.34 | 5.86 | 7.26 | 7.26 | 7.26 | 7.26 | 7.26 |
| EBITDA | 30,730.6 | 18,078.6 | 21,587.3 | 23,123.9 | 25,754.9 | 29,775.6 | 31,938.5 | 34,258.5 | 36,747.0 | 39,416.3 |
| EBITDA, % | 30.39 | 15.03 | 17.63 | 17.43 | 18.33 | 19.76 | 19.76 | 19.76 | 19.76 | 19.76 |
| Depreciation | 6,754.7 | 6,776.7 | 6,617.8 | 6,274.6 | 4,929.3 | 7,821.6 | 8,389.8 | 8,999.2 | 9,652.9 | 10,354.1 |
| Depreciation, % | 6.68 | 5.63 | 5.4 | 4.73 | 3.51 | 5.19 | 5.19 | 5.19 | 5.19 | 5.19 |
| EBIT | 23,975.9 | 11,301.9 | 14,969.5 | 16,849.3 | 20,825.6 | 21,953.9 | 23,548.7 | 25,259.3 | 27,094.1 | 29,062.2 |
| EBIT, % | 23.71 | 9.4 | 12.22 | 12.7 | 14.83 | 14.57 | 14.57 | 14.57 | 14.57 | 14.57 |
| Total Cash | 68,160.9 | 64,162.4 | 73,945.0 | 80,509.4 | 60,356.8 | 85,814.7 | 92,048.3 | 98,734.7 | 105,906.8 | 113,599.9 |
| Total Cash, percent | .0 | .0 | .0 | .0 | .0 | .0 | .0 | .0 | .0 | .0 |
| Account Receivables | 4,827.4 | 6,206.1 | 6,574.8 | 11,337.0 | 18,198.3 | 11,090.0 | 11,895.6 | 12,759.7 | 13,686.5 | 14,680.7 |
| Account Receivables, % | 4.77 | 5.16 | 5.37 | 8.54 | 12.95 | 7.36 | 7.36 | 7.36 | 7.36 | 7.36 |
| Inventories | 3,927.7 | 4,242.0 | 4,024.8 | 3,589.6 | .0 | 4,038.8 | 4,332.2 | 4,646.9 | 4,984.5 | 5,346.5 |
| Inventories, % | 3.88 | 3.53 | 3.29 | 2.71 | 0 | 2.68 | 2.68 | 2.68 | 2.68 | 2.68 |
| Accounts Payable | 13,304.9 | 15,114.8 | 14,574.0 | 17,984.7 | .0 | 15,422.3 | 16,542.6 | 17,744.3 | 19,033.2 | 20,415.8 |
| Accounts Payable, % | 13.16 | 12.57 | 11.9 | 13.55 | 0 | 10.24 | 10.24 | 10.24 | 10.24 | 10.24 |
| Capital Expenditure | -6,088.7 | -7,518.2 | -4,843.3 | -4,642.7 | -12,121.2 | -8,544.5 | -9,165.2 | -9,831.0 | -10,545.1 | -11,311.1 |
| Capital Expenditure, % | -6.02 | -6.25 | -3.95 | -3.5 | -8.63 | -5.67 | -5.67 | -5.67 | -5.67 | -5.67 |
| Tax Rate, % | 19.4 | 19.4 | 19.4 | 19.4 | 19.4 | 19.4 | 19.4 | 19.4 | 19.4 | 19.4 |
| EBITAT | 20,921.4 | 9,520.8 | 13,430.7 | 14,362.7 | 16,785.9 | 18,751.6 | 20,113.7 | 21,574.7 | 23,141.9 | 24,823.0 |
| Depreciation | ||||||||||
| Changes in Account Receivables | ||||||||||
| Changes in Inventories | ||||||||||
| Changes in Accounts Payable | ||||||||||
| Capital Expenditure | ||||||||||
| UFCF | 26,137.4 | 8,896.2 | 14,512.8 | 15,078.3 | -11,662.3 | 36,520.4 | 19,359.6 | 20,765.8 | 22,274.3 | 23,892.3 |
| WACC, % | 4.4 | 4.35 | 4.44 | 4.37 | 4.29 | 4.37 | 4.37 | 4.37 | 4.37 | 4.37 |
| PV UFCF | ||||||||||
| SUM PV UFCF | 109,088.6 | |||||||||
| Long Term Growth Rate, % | 2.00 | |||||||||
| Free cash flow (T + 1) | 24,370 | |||||||||
| Terminal Value | 1,027,690 | |||||||||
| Present Terminal Value | 829,766 | |||||||||
| Enterprise Value | 938,855 | |||||||||
| Net Debt | 15,058 | |||||||||
| Equity Value | 923,797 | |||||||||
| Diluted Shares Outstanding, MM | 302 | |||||||||
| Equity Value Per Share | 3,060.51 |
What You Will Get
- Editable Excel Template: A fully customizable Excel-based DCF Calculator featuring pre-filled real BABA financials.
- Real-World Data: Historical data and forward-looking estimates (highlighted in the yellow cells).
- Forecast Flexibility: Adjust forecast assumptions such as revenue growth, EBITDA %, and WACC.
- Automatic Calculations: Instantly observe how your inputs affect Alibaba’s valuation.
- Professional Tool: Designed for investors, CFOs, consultants, and financial analysts.
- User-Friendly Design: Organized for clarity and ease of use, complete with step-by-step instructions.
Key Features
- Customizable Revenue Assumptions: Adjust key metrics such as sales growth, profit margins, and operating expenses.
- Instant DCF Valuation: Automatically computes intrinsic value, NPV, and other financial metrics in real-time.
- High-Precision Analysis: Incorporates Alibaba's actual financial data for accurate valuation results.
- Effortless Scenario Testing: Evaluate various scenarios and analyze results with ease.
- Efficiency Booster: Streamline your workflow by avoiding the complexities of building valuation models from the ground up.
How It Works
- Download the Template: Get immediate access to the Excel-based BABA DCF Calculator.
- Input Your Assumptions: Modify the yellow-highlighted cells for growth rates, WACC, margins, and other parameters.
- Instant Calculations: The model automatically refreshes Alibaba’s intrinsic value.
- Test Scenarios: Experiment with different assumptions to assess potential changes in valuation.
- Analyze and Decide: Utilize the outcomes to inform your investment or financial analysis.
Why Choose Alibaba Group Holding Limited (BABA) Stock?
- Global Reach: Benefit from Alibaba's extensive international market presence.
- Diverse Revenue Streams: Enjoy the stability offered by multiple business segments, including e-commerce and cloud computing.
- Innovative Technology: Leverage Alibaba's cutting-edge technology to stay ahead in the digital economy.
- Strong Growth Potential: Tap into the significant growth opportunities in the Asian markets and beyond.
- Expert Analysis: Rely on insights from industry experts who recognize Alibaba's market leadership.
Who Should Use This Product?
- Investors: Evaluate Alibaba’s valuation before making stock trades.
- CFOs and Financial Analysts: Enhance valuation workflows and assess financial forecasts.
- Startup Founders: Understand the valuation methods applied to large public companies like Alibaba.
- Consultants: Provide comprehensive valuation reports for your clientele.
- Students and Educators: Utilize real-world examples to learn and teach valuation strategies.
What the Template Contains
- Historical Data: Includes Alibaba Group’s past financials and baseline forecasts.
- DCF and Levered DCF Models: Detailed templates to calculate Alibaba Group’s intrinsic value.
- WACC Sheet: Pre-built calculations for Weighted Average Cost of Capital.
- Editable Inputs: Modify key drivers like growth rates, EBITDA %, and CAPEX assumptions.
- Quarterly and Annual Statements: A complete breakdown of Alibaba Group’s financials.
- Interactive Dashboard: Visualize valuation results and projections dynamically.
Disclaimer
All information, articles, and product details provided on this website are for general informational and educational purposes only. We do not claim any ownership over, nor do we intend to infringe upon, any trademarks, copyrights, logos, brand names, or other intellectual property mentioned or depicted on this site. Such intellectual property remains the property of its respective owners, and any references here are made solely for identification or informational purposes, without implying any affiliation, endorsement, or partnership.
We make no representations or warranties, express or implied, regarding the accuracy, completeness, or suitability of any content or products presented. Nothing on this website should be construed as legal, tax, investment, financial, medical, or other professional advice. In addition, no part of this site—including articles or product references—constitutes a solicitation, recommendation, endorsement, advertisement, or offer to buy or sell any securities, franchises, or other financial instruments, particularly in jurisdictions where such activity would be unlawful.
All content is of a general nature and may not address the specific circumstances of any individual or entity. It is not a substitute for professional advice or services. Any actions you take based on the information provided here are strictly at your own risk. You accept full responsibility for any decisions or outcomes arising from your use of this website and agree to release us from any liability in connection with your use of, or reliance upon, the content or products found herein.