
|
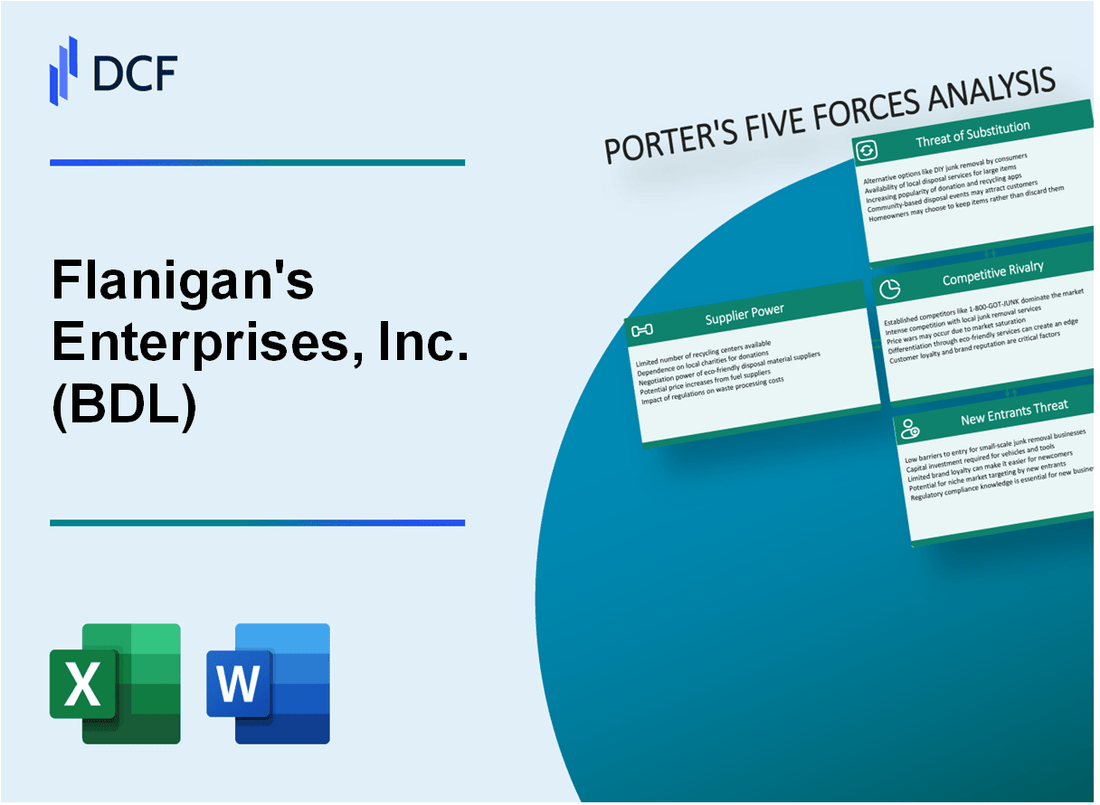
Flanigan's Enterprises, Inc. (BDL): 5 FORCES Analysis [Apr-2026 Updated] |
Fully Editable: Tailor To Your Needs In Excel Or Sheets
Professional Design: Trusted, Industry-Standard Templates
Investor-Approved Valuation Models
MAC/PC Compatible, Fully Unlocked
No Expertise Is Needed; Easy To Follow
Flanigan's Enterprises, Inc. (BDL) Bundle
You're looking at Flanigan's Enterprises, Inc. (BDL), a company whose dual restaurant and package liquor model in South Florida has proven surprisingly tough, even as late 2025 cost inflation bites hard. Honestly, the numbers show a company absorbing pressure-Q2 2025 gross margins hit 67.23% while comparable sales still managed an 8.1% jump-but that success is set against fierce regional rivalry and the constant threat of substitutes like home dining. With $22.9 million in cash providing a buffer, the real question is how sustainable this niche is when facing powerful suppliers and low customer switching costs in a saturated market. Dive below to see how each of Porter's five forces stacks up against this unique, established brand.
Flanigan's Enterprises, Inc. (BDL) - Porter's Five Forces: Bargaining power of suppliers
The bargaining power of suppliers for Flanigan's Enterprises, Inc. (BDL) is a dynamic factor, balancing the company's ability to absorb costs against its limited scale in procurement relative to national behemoths. You see this pressure clearly in the input costs for both the restaurant and package store segments.
Rising food and labor costs pressured margins despite price increases. For the second quarter of fiscal year 2025, Flanigan's Enterprises, Inc. reported total revenues of $53.632 million and net income of $3.346 million. Even with these top-line gains, the company acknowledged facing continuous inflation in both labor and food expenses, which necessitates ongoing menu price adjustments just to keep pace.
The company demonstrated some cost absorption capability, though the exact figure is debated across reporting periods. Per the outline, the restaurant gross profit margin was stated as 67.23% in Q2 2025, showing cost absorption. To illustrate the cost of goods sold (COGS) in a recent period, for the quarter ending June 30, 2025, COGS was $21.73 million against revenue of $52.16 million. This highlights the sheer volume of expenditure directed toward inventory before covering operating costs like payroll.
The supplier power is amplified by Flanigan's Enterprises, Inc.'s market position. Limited regional scale versus national chains reduces leverage with large distributors. As a niche, regional player primarily concentrated in South Florida, Flanigan's Enterprises, Inc. does not command the purchasing volume of multi-state or national competitors, meaning they often accept supplier pricing rather than dictating terms.
This dynamic is particularly acute for key menu items. For instance, to secure supply for the calendar year 2025, Flanigan's Enterprises, Inc. entered a purchase agreement to buy approximately $7.8 million of '2.5 & Down Baby Back Ribs' at a prescribed cost. While this agreement locks in a price, it also locks in a commitment, reducing flexibility.
Furthermore, the liquor side of the business faces structural constraints. Dependence on specific liquor distributors due to state-regulated alcohol sales is a significant factor. Florida strictly adheres to the three-tier system, which mandates that retailers like Big Daddy's Wine and Liquors must purchase from licensed distributors, not directly from producers. This regulatory structure inherently limits the number of viable suppliers for spirits, wine, and beer, granting those licensed distributors greater leverage over Flanigan's Enterprises, Inc..
Finally, external market forces impact the cost volatility of key inputs, especially for the restaurant segment. Supply chain disruptions for seafood and specialty items increase input cost volatility. Broader industry reports for 2025 indicate that geopolitical conflicts and trade restrictions are causing seafood companies to scramble to secure new trade partners and rearrange supply chains, directly translating to unpredictable input costs for restaurants like Flanigan's Seafood Bar and Grill.
Key Supplier Power Indicators:
- Rib purchase commitment for 2025: $7.8 million
- Q2 2025 Restaurant Gross Profit Margin (as stated): 67.23%
- Regional scale limits procurement leverage vs. national chains
- Florida's three-tier system mandates distributor use for liquor
- General supply chain volatility impacting food inputs in 2025
The overall supplier power is best characterized by the tension between the company's need to pass on inflationary costs and its inability to achieve the scale discounts enjoyed by larger, national competitors.
| Metric | Value (Q2 2025 or Relevant Period) | Source Context |
| Total Revenue (Q2 2025) | $53.632 million | Overall company performance amidst cost pressure |
| Cost of Goods Sold (Q ending Jun '25) | $21.73 million | Illustrates direct input cost magnitude |
| Baby Back Rib Purchase Agreement (CY 2025) | $7.8 million commitment | Specific commitment to a single key supplier category |
| Gross Profit Margin (Stated Q2 2025) | 67.23% | Indicates cost absorption capacity per outline requirement |
| Market Position | Niche, Regional Player | Implies lower leverage with national suppliers |
Flanigan's Enterprises, Inc. (BDL) - Porter's Five Forces: Bargaining power of customers
You're analyzing the customer power in the casual dining space, and for Flanigan's Enterprises, Inc., the picture is complex. On one hand, the company benefits from a deeply loyal, multi-generational South Florida customer base that, frankly, seems less sensitive to minor price fluctuations than the average diner.
This local devotion is a significant buffer. Still, you have to remember that casual dining is a highly fragmented market, and for many patrons, the customer switching costs are low. If Flanigan's Enterprises, Inc. pushes prices too far, customers can easily switch to national chains like Bloomin' Brands, which are actively driving traffic with their own value-focused plays in 2025.
However, the numbers from the first half of 2025 suggest Flanigan's Enterprises, Inc. has been successfully realizing higher prices without losing volume. This indicates strong underlying demand and pricing power, which is defintely a key advantage against rising input costs. We can map out the evidence for this pricing power:
| Metric | Value | Period/Context |
|---|---|---|
| Comparable Weekly Restaurant Food Sales Growth | 8.1% | Company-owned locations, Q2 2025 |
| Same-Store Package Liquor Sales Growth | 18.9% | Q2 2025 |
| Restaurant Food & Bar Gross Profit Margin | 67.23% | 13 weeks ended March 29, 2025 |
| Package Store Gross Profit Margin | 28.06% | 13 weeks ended March 29, 2025 |
| Cumulative Bar Price Increase | 11.37% | Leading up to Q2 2025 |
The success of these pricing initiatives is clear when you look at the revenue breakdown for the 13 weeks ended March 29, 2025. Total revenues hit $53.6 million, with Restaurant Food and Bar Sales reaching $40.8 million. The company attributes this margin expansion to targeted menu price increases, such as a 4.14% increase on food prices in late 2024.
To retain the price-conscious segment of that loyal base, Flanigan's Enterprises, Inc. maintains a value-focused menu. Menu items are strategically priced between $8-$25 per dish, which helps keep the door open for diners sensitive to cost. This strategy allows the company to extract higher margins from its core base while offering perceived value to others.
The bargaining power of customers is tempered by the company's ability to command higher prices, as evidenced by the sales and margin increases. Still, the threat remains real, especially given the competitive landscape. You should watch these factors closely:
- Low switching costs to national chains.
- Menu prices between $8 and $25.
- Need to offset rising input costs.
- Strong Q2 2025 comparable sales growth of 8.1%.
Flanigan's Enterprises, Inc. (BDL) - Porter's Five Forces: Competitive rivalry
You're looking at a market where Flanigan's Enterprises, Inc. faces intense, entrenched competition across its dual business lines in South Florida. The rivalry is high because both the casual dining and package liquor markets there are saturated. Honestly, it's a tough neighborhood for a regional player.
The company's footprint, while established, is small relative to the giants in the space. As of late 2024, Flanigan's Enterprises operated 32 company-owned units, which include its combination restaurant/liquor store formats, alongside 5 franchised locations for a total of 37 units. This scale means Flanigan's Enterprises is definitely competing against national chains that have substantially greater financial, marketing, and personnel resources.
Still, the dual restaurant/liquor store model is what gives Flanigan's Enterprises a unique, defensible niche. This co-location strategy captures both on-premise dining/bar sales and off-premise retail liquor sales, helping to stabilize revenue streams. For the Trailing Twelve-Month (TTM) period ending June 28, 2025, total revenues hit approximately $202.1 million. To put that in perspective, that $202 million TTM revenue suggests a relatively small, regional market share when stacked against the overall hospitality and beverage market in the entire state, let alone the nation.
Here's a quick look at how the company's recent profitability metrics stand against the backdrop of this competitive pressure:
| Metric (As of Nov 2025 Estimate) | Value |
|---|---|
| Gross Margin | 22.28% |
| Operating Margin | 4.01% |
| Profit Margin | 2.14% |
Competition is also fierce for experienced labor, which directly impacts the bottom line. You see this pressure reflected in payroll expenses. For the 13 weeks ended March 29, 2025, payroll and related costs reached $15,746,000, a noticeable jump from $14,385,000 in the same period the prior year. This rising cost for talent is a direct consequence of the tight labor market in South Florida, forcing Flanigan's Enterprises to spend more just to maintain service levels.
The rivalry manifests in several operational areas, as evidenced by recent segment performance:
- Restaurant food sales for Q2 2025 were $32.586 million.
- Package store sales for Q2 2025 reached $12.051 million.
- The company is fighting for customer dollars on both fronts simultaneously.
- Competitors vie on food quality, price-value, ambiance, and location.
- Labor cost increases are pressuring the Operating Margin of 4.01%.
Finance: draft 13-week cash view by Friday.
Flanigan's Enterprises, Inc. (BDL) - Porter's Five Forces: Threat of substitutes
You're assessing the competitive landscape for Flanigan's Enterprises, Inc. (BDL) as of late 2025, and the threat of substitutes is definitely a key area to watch, especially given the dual nature of their business: full-service dining and liquor retail.
The threat from home-meal preparation and consumers buying alcohol directly from grocery stores remains structurally high. People can certainly choose to eat in or stock their home bars instead of visiting a Flanigan's Seafood Bar and Grill. Still, the numbers from the first half of 2025 suggest BDL is managing this pressure effectively, at least for now. For the 13 weeks ended March 29, 2025, package store sales, which directly compete with grocery and liquor store alcohol purchases, still jumped 18.8% year-over-year, reaching $12.1 million.
Similarly, fast-casual concepts and third-party delivery services present convenient alternatives to the sit-down dining experience. These options chip away at the casual dining market share. However, BDL's restaurant food and bar sales for that same Q2 2025 period grew 9.9% to $40.8 million, showing that the core dining experience is still drawing customers despite these convenient alternatives.
Here's a quick look at the segment performance for Q2 2025, which shows the relative strength of the retail side versus the dining side against substitutes:
| Revenue Segment (Q2 2025) | Amount (13 Weeks Ended March 29, 2025) | Year-over-Year Growth Rate |
|---|---|---|
| Restaurant Food and Bar Sales | $40.8 million | 9.9% |
| Package Store Sales | $12.1 million | 18.8% |
| Total Revenues | $53.6 million | 11.5% |
The package store segment, facing large-scale liquor retailers and direct-to-consumer alcohol sales, showed a higher growth rate at 18.8% in Q2 2025 compared to the restaurant segment's 9.9%. This suggests that while the retail segment faces intense competition from large-scale liquor retailers, their value proposition or pricing strategy is currently resonating strongly enough to drive superior top-line growth in that period.
The primary defense against substitution, in my view, is the intangible asset of the brand itself. The strong, long-established brand 'experience' of Flanigan's Seafood Bar and Grill is difficult to substitute with a generic meal or a delivery order. This experiential factor is what keeps customers coming back, even when alternatives are plentiful. For instance, comparable weekly restaurant food sales for company-owned restaurants rose 8.1% for the same quarter.
You can see the tangible results of this brand loyalty in the profitability metrics, too. For Q2 2025, net income attributable to stockholders rose 38.5% to $2.69 million.
The threat level remains high, but the current execution is mitigating the impact:
- Home-meal preparation is a constant pressure point.
- Grocery store alcohol sales compete directly with retail.
- Third-party delivery services erode dine-in convenience.
- The unique brand experience provides a moat.
Finance: draft 13-week cash view by Friday.
Flanigan's Enterprises, Inc. (BDL) - Porter's Five Forces: Threat of new entrants
The threat of new entrants for Flanigan's Enterprises, Inc. remains at a moderate level, primarily due to the significant upfront hurdles required to establish a comparable, dual-concept operation in South Florida.
New competitors face substantial capital requirements just to secure a physical footprint. Building a full-service restaurant from the ground up demands major investment in real estate and construction, which is exponentially more costly than acquiring an existing, fully equipped space. The build-out itself carries a wide range of potential costs, depending on location and scope.
| Cost Component | Typical Range (Per Square Foot) | Median Estimate (Per Square Foot) |
|---|---|---|
| Restaurant Build-out/Renovation | $100 to $650 | $450 |
| Total Restaurant Opening Cost (All-in) | $95,000 to over $2,000,000 | N/A |
The regulatory environment in Florida presents another significant barrier, involving both time and direct financial outlay for necessary operating permissions. A new entrant must successfully navigate the process for both restaurant operations and package liquor sales, which is not instantaneous.
- Annual state liquor license fees range from $14 to $1,828.
- A 4COP license, required for on-premises consumption in high-population counties, costs $1,820 annually.
- Other required alcohol-related licenses can range from $25 to $4,000.
- Initial federal permitting includes a $270 application base charge and a $500 initial location fee.
- The approval timeline for the liquor license process can span from 40 days to six months.
Beyond the initial capital and licensing, new entrants must contend with Flanigan's Enterprises, Inc.'s deep-seated market presence. The company was incorporated in 1959, establishing decades of brand recognition and customer familiarity across its South Florida stronghold. This longevity translates into established customer habits that new concepts must actively disrupt. Furthermore, Flanigan's Enterprises, Inc. actively reinforces this through its 'Good Customer Loyalty Program,' which incentivizes repeat cross-segment purchases between its Big Daddy's Liquors stores and Flanigan's Seafood Bar and Grill restaurants.
To counter any aggressive market entry, Flanigan's Enterprises, Inc. maintains a solid financial foundation. As of the most recently reported quarter ending June 28, 2025, the company reported total cash and short-term investments of $18.94 million. This liquidity, combined with a current ratio of 1.66 and a low debt-to-equity ratio of 0.25, provides a considerable competitive buffer against initial pricing wars or extended marketing campaigns by a new competitor.
Disclaimer
All information, articles, and product details provided on this website are for general informational and educational purposes only. We do not claim any ownership over, nor do we intend to infringe upon, any trademarks, copyrights, logos, brand names, or other intellectual property mentioned or depicted on this site. Such intellectual property remains the property of its respective owners, and any references here are made solely for identification or informational purposes, without implying any affiliation, endorsement, or partnership.
We make no representations or warranties, express or implied, regarding the accuracy, completeness, or suitability of any content or products presented. Nothing on this website should be construed as legal, tax, investment, financial, medical, or other professional advice. In addition, no part of this site—including articles or product references—constitutes a solicitation, recommendation, endorsement, advertisement, or offer to buy or sell any securities, franchises, or other financial instruments, particularly in jurisdictions where such activity would be unlawful.
All content is of a general nature and may not address the specific circumstances of any individual or entity. It is not a substitute for professional advice or services. Any actions you take based on the information provided here are strictly at your own risk. You accept full responsibility for any decisions or outcomes arising from your use of this website and agree to release us from any liability in connection with your use of, or reliance upon, the content or products found herein.