
|
Becton, Dickinson and Company (BDX) DCF Valuation |
Fully Editable: Tailor To Your Needs In Excel Or Sheets
Professional Design: Trusted, Industry-Standard Templates
Investor-Approved Valuation Models
MAC/PC Compatible, Fully Unlocked
No Expertise Is Needed; Easy To Follow
Becton, Dickinson and Company (BDX) Bundle
Streamline your analysis and improve precision with our (BDX) DCF Calculator! Utilizing real data from Becton, Dickinson and Company and customizable assumptions, this tool empowers you to forecast, analyze, and value BDX like a seasoned investor.
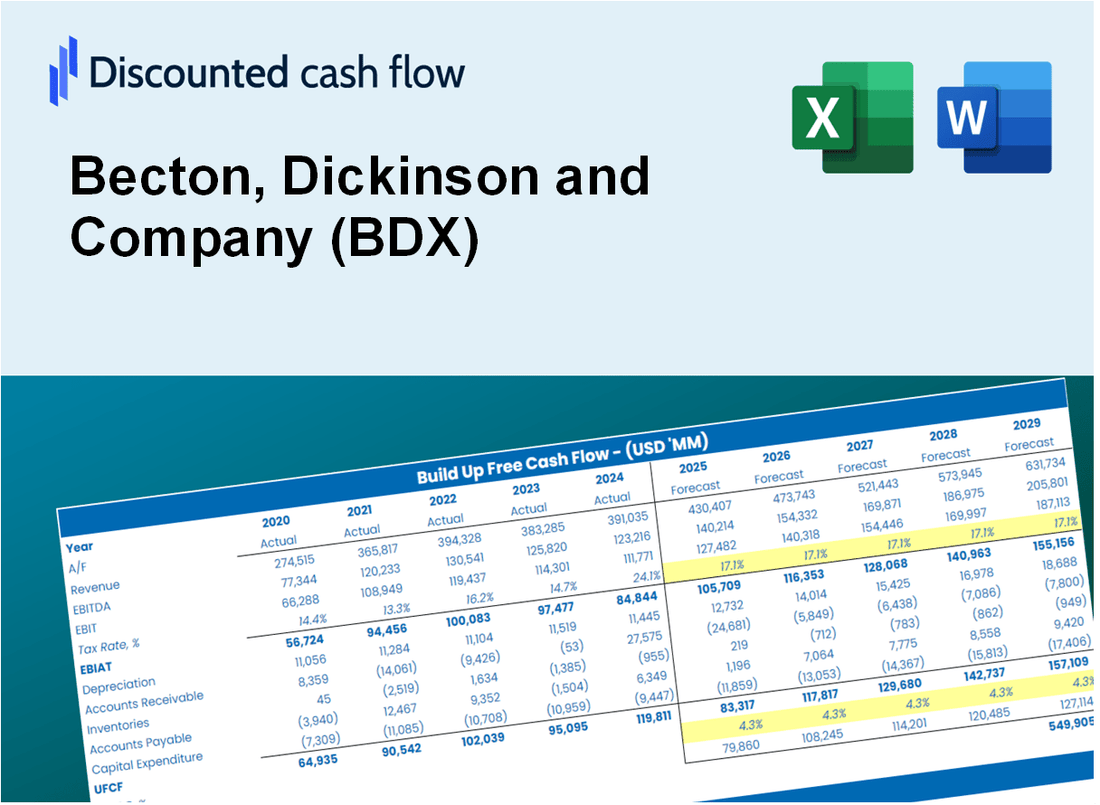
Discounted Cash Flow (DCF) - (USD MM)
| Year | AY1 2020 |
AY2 2021 |
AY3 2022 |
AY4 2023 |
AY5 2024 |
FY1 2025 |
FY2 2026 |
FY3 2027 |
FY4 2028 |
FY5 2029 |
|---|---|---|---|---|---|---|---|---|---|---|
| Revenue | 16,074.0 | 19,131.0 | 18,870.0 | 19,372.0 | 20,178.0 | 21,412.6 | 22,722.8 | 24,113.2 | 25,588.6 | 27,154.3 |
| Revenue Growth, % | 0 | 19.02 | -1.36 | 2.66 | 4.16 | 6.12 | 6.12 | 6.12 | 6.12 | 6.12 |
| EBITDA | 3,057.0 | 4,391.0 | 4,410.0 | 4,402.0 | 4,819.0 | 4,794.2 | 5,087.5 | 5,398.8 | 5,729.1 | 6,079.7 |
| EBITDA, % | 19.02 | 22.95 | 23.37 | 22.72 | 23.88 | 22.39 | 22.39 | 22.39 | 22.39 | 22.39 |
| Depreciation | 2,115.0 | 2,230.0 | 2,229.0 | 2,288.0 | 2,286.0 | 2,559.5 | 2,716.1 | 2,882.3 | 3,058.7 | 3,245.9 |
| Depreciation, % | 13.16 | 11.66 | 11.81 | 11.81 | 11.33 | 11.95 | 11.95 | 11.95 | 11.95 | 11.95 |
| EBIT | 942.0 | 2,161.0 | 2,181.0 | 2,114.0 | 2,533.0 | 2,234.6 | 2,371.4 | 2,516.5 | 2,670.4 | 2,833.8 |
| EBIT, % | 5.86 | 11.3 | 11.56 | 10.91 | 12.55 | 10.44 | 10.44 | 10.44 | 10.44 | 10.44 |
| Total Cash | 2,845.0 | 2,295.0 | 1,014.0 | 1,424.0 | 2,162.0 | 2,275.5 | 2,414.7 | 2,562.5 | 2,719.3 | 2,885.7 |
| Total Cash, percent | .0 | .0 | .0 | .0 | .0 | .0 | .0 | .0 | .0 | .0 |
| Account Receivables | 2,398.0 | 2,350.0 | 2,191.0 | 2,534.0 | 3,033.0 | 2,866.1 | 3,041.5 | 3,227.6 | 3,425.0 | 3,634.6 |
| Account Receivables, % | 14.92 | 12.28 | 11.61 | 13.08 | 15.03 | 13.39 | 13.39 | 13.39 | 13.39 | 13.39 |
| Inventories | 2,743.0 | 2,743.0 | 3,224.0 | 3,273.0 | 3,843.0 | 3,615.7 | 3,836.9 | 4,071.7 | 4,320.8 | 4,585.2 |
| Inventories, % | 17.06 | 14.34 | 17.09 | 16.9 | 19.05 | 16.89 | 16.89 | 16.89 | 16.89 | 16.89 |
| Accounts Payable | 1,355.0 | 1,739.0 | 1,699.0 | 1,641.0 | 1,896.0 | 1,901.0 | 2,017.4 | 2,140.8 | 2,271.8 | 2,410.8 |
| Accounts Payable, % | 8.43 | 9.09 | 9 | 8.47 | 9.4 | 8.88 | 8.88 | 8.88 | 8.88 | 8.88 |
| Capital Expenditure | -810.0 | -1,231.0 | -973.0 | -874.0 | -725.0 | -1,059.3 | -1,124.1 | -1,192.9 | -1,265.9 | -1,343.3 |
| Capital Expenditure, % | -5.04 | -6.43 | -5.16 | -4.51 | -3.59 | -4.95 | -4.95 | -4.95 | -4.95 | -4.95 |
| Tax Rate, % | 14.96 | 14.96 | 14.96 | 14.96 | 14.96 | 14.96 | 14.96 | 14.96 | 14.96 | 14.96 |
| EBITAT | 1,988.7 | 2,671.9 | 2,176.1 | 1,887.6 | 2,154.0 | 2,118.9 | 2,248.5 | 2,386.1 | 2,532.1 | 2,687.1 |
| Depreciation | ||||||||||
| Changes in Account Receivables | ||||||||||
| Changes in Inventories | ||||||||||
| Changes in Accounts Payable | ||||||||||
| Capital Expenditure | ||||||||||
| UFCF | -492.3 | 4,102.9 | 3,070.1 | 2,851.6 | 2,901.0 | 4,018.4 | 3,560.3 | 3,778.2 | 4,009.3 | 4,254.6 |
| WACC, % | 4.68 | 4.68 | 4.68 | 4.57 | 4.53 | 4.63 | 4.63 | 4.63 | 4.63 | 4.63 |
| PV UFCF | ||||||||||
| SUM PV UFCF | 17,130.6 | |||||||||
| Long Term Growth Rate, % | 4.00 | |||||||||
| Free cash flow (T + 1) | 4,425 | |||||||||
| Terminal Value | 704,590 | |||||||||
| Present Terminal Value | 561,949 | |||||||||
| Enterprise Value | 579,079 | |||||||||
| Net Debt | 19,202 | |||||||||
| Equity Value | 559,877 | |||||||||
| Diluted Shares Outstanding, MM | 291 | |||||||||
| Equity Value Per Share | 1,923.92 |
What You Will Get
- Editable Forecast Inputs: Easily modify assumptions (growth %, margins, WACC) to generate various scenarios.
- Real-World Data: Becton, Dickinson and Company’s (BDX) financial data pre-loaded to kickstart your analysis.
- Automatic DCF Outputs: The template computes Net Present Value (NPV) and intrinsic value for you.
- Customizable and Professional: A refined Excel model that adjusts to your valuation requirements.
- Built for Analysts and Investors: Perfect for evaluating projections, confirming strategies, and enhancing efficiency.
Key Features
- Pre-Loaded Data: Becton, Dickinson and Company’s historical financial statements and pre-filled forecasts.
- Fully Adjustable Inputs: Edit WACC, tax rates, revenue growth, and EBITDA margins.
- Instant Results: See Becton, Dickinson and Company’s intrinsic value recalculate in real time.
- Clear Visual Outputs: Dashboard charts display valuation results and key metrics.
- Built for Accuracy: A professional tool for analysts, investors, and finance experts.
How It Works
- Download: Get the pre-configured Excel file containing Becton, Dickinson and Company's (BDX) financial data.
- Customize: Modify projections, such as revenue growth rates, EBITDA %, and WACC.
- Update Automatically: The intrinsic value and NPV calculations refresh in real-time.
- Test Scenarios: Develop various forecasts and compare results instantly.
- Make Decisions: Leverage the valuation outcomes to inform your investment strategy.
Why Choose This Calculator for Becton, Dickinson and Company (BDX)?
- Accurate Data: Utilize real BDX financials to ensure dependable valuation outcomes.
- Customizable: Tailor essential parameters such as growth rates, WACC, and tax rates to fit your forecasts.
- Time-Saving: Pre-configured calculations save you from starting from the ground up.
- Professional-Grade Tool: Crafted for investors, analysts, and consultants in the healthcare sector.
- User-Friendly: An intuitive design and step-by-step guidance make it accessible for all users.
Who Should Use This Product?
- Healthcare Professionals: Understand the latest innovations and applications of Becton, Dickinson and Company's (BDX) products.
- Researchers: Utilize BDX's data to enhance studies in medical technology and device development.
- Investors: Evaluate market trends and performance metrics for Becton, Dickinson and Company (BDX) stock.
- Educators: Integrate BDX's case studies into teaching materials for courses in healthcare management.
- Pharmaceutical Companies: Collaborate with BDX to explore synergies in product offerings and market strategies.
What the Template Contains
- Historical Data: Includes Becton, Dickinson and Company’s (BDX) past financials and baseline forecasts.
- DCF and Levered DCF Models: Detailed templates to calculate Becton, Dickinson and Company’s (BDX) intrinsic value.
- WACC Sheet: Pre-built calculations for Weighted Average Cost of Capital.
- Editable Inputs: Modify key drivers like growth rates, EBITDA %, and CAPEX assumptions.
- Quarterly and Annual Statements: A complete breakdown of Becton, Dickinson and Company’s (BDX) financials.
- Interactive Dashboard: Visualize valuation results and projections dynamically.
Disclaimer
All information, articles, and product details provided on this website are for general informational and educational purposes only. We do not claim any ownership over, nor do we intend to infringe upon, any trademarks, copyrights, logos, brand names, or other intellectual property mentioned or depicted on this site. Such intellectual property remains the property of its respective owners, and any references here are made solely for identification or informational purposes, without implying any affiliation, endorsement, or partnership.
We make no representations or warranties, express or implied, regarding the accuracy, completeness, or suitability of any content or products presented. Nothing on this website should be construed as legal, tax, investment, financial, medical, or other professional advice. In addition, no part of this site—including articles or product references—constitutes a solicitation, recommendation, endorsement, advertisement, or offer to buy or sell any securities, franchises, or other financial instruments, particularly in jurisdictions where such activity would be unlawful.
All content is of a general nature and may not address the specific circumstances of any individual or entity. It is not a substitute for professional advice or services. Any actions you take based on the information provided here are strictly at your own risk. You accept full responsibility for any decisions or outcomes arising from your use of this website and agree to release us from any liability in connection with your use of, or reliance upon, the content or products found herein.