
|
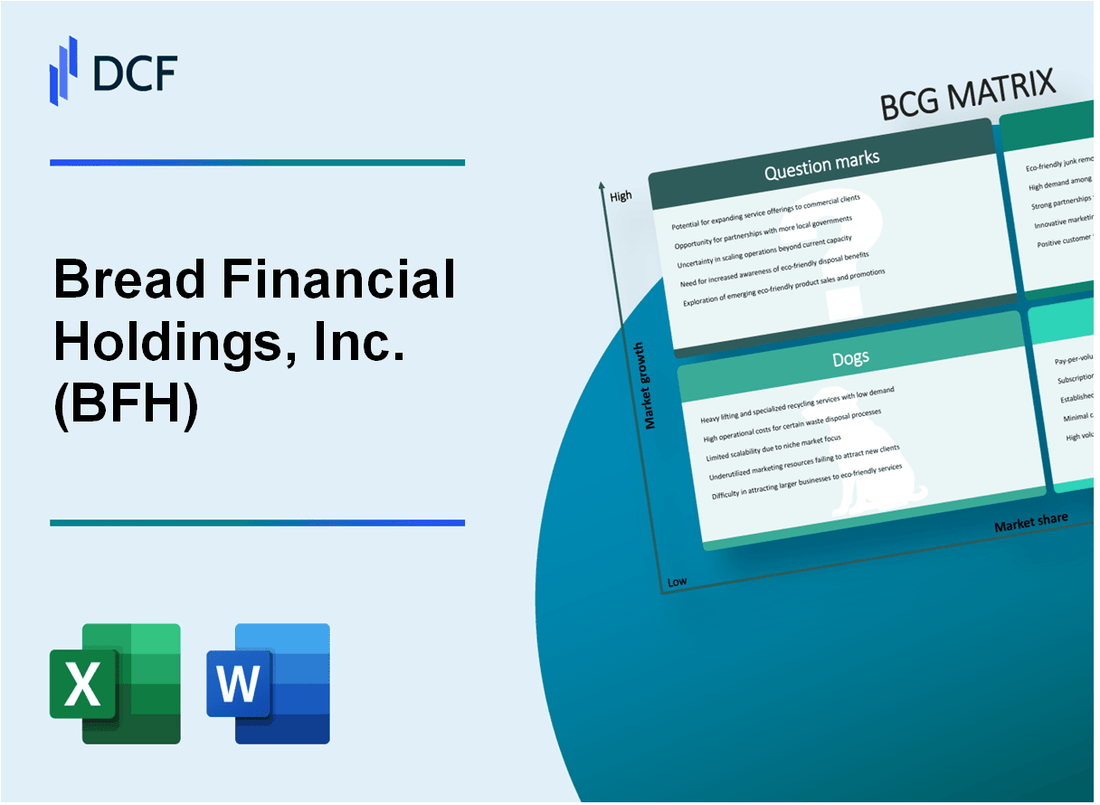
Bread Financial Holdings, Inc. (BFH): BCG Matrix [Dec-2025 Updated] |
Fully Editable: Tailor To Your Needs In Excel Or Sheets
Professional Design: Trusted, Industry-Standard Templates
Investor-Approved Valuation Models
MAC/PC Compatible, Fully Unlocked
No Expertise Is Needed; Easy To Follow
Bread Financial Holdings, Inc. (BFH) Bundle
You're looking for a clear-eyed assessment of Bread Financial Holdings, Inc.'s (BFH) business mix as of late 2025, and the BCG Matrix is the perfect tool to map their current strategic position against market growth and relative market share. We've mapped their portfolio: high-profit Stars, driven by 5% sales growth to $6.8$ billion, are funding the core Cash Cows, which still represent 55% of end-of-period loans, but the Dogs are being pressured by a net loss rate near 7.9%. The real question is whether the small 2% loan share from their Question Mark Buy Now, Pay Later products can scale fast enough to justify the investment needed to move them out of that quadrant. Dive in below to see precisely where Bread Financial Holdings, Inc. needs to invest, hold, or divest right now.
Background of Bread Financial Holdings, Inc. (BFH)
You're looking at Bread Financial Holdings, Inc. (BFH), which is a tech-forward financial services company operating in the U.S. consumer space. Honestly, it's built on a foundation combining parts of JCPenney's credit card processing unit and The Limited's old credit card bank business. That history helps explain why its core business is so tied to retail partnerships.
The company's main focus, as reflected in its single reportable segment, is generating revenue from interest and fees on its various credit card and other loan products. Bread Financial Holdings, Inc. provides millions of U.S. consumers with simple, flexible payment, lending, and saving solutions. These offerings include general purpose credit cards, like the Bread CashbackTM American Express Credit Card, and direct-to-consumer savings products.
Where Bread Financial Holdings, Inc. really drives growth is through its private label and co-brand credit cards, plus its pay-over-time options such as installment loans. They deliver these services to support major brands across sectors like travel & entertainment, health & beauty, jewelry, and specialty apparel. For instance, in the third quarter of 2025, credit sales hit $6.8 billion, which was a 5% increase year-over-year, showing that the partnership engine is still running strong.
Looking at the latest numbers from the third quarter of 2025, the company posted a net income of $188 million. Revenue for that quarter was $971 million, representing a slight dip of 1% compared to the same period last year. Still, the management team is clearly focused on credit quality; the delinquency rate improved to 6.0% from 6.4% in the third quarter of 2024, and the net loss rate for the quarter was 7.4%.
Financially, as of late 2025, Bread Financial Holdings, Inc. shows some solid underlying strength. The return on average tangible common equity was 28.6% for the quarter, and the tangible book value per common share reached $56.36, marking a 19% increase year-over-year. Furthermore, their direct-to-consumer deposits grew 9% year-over-year to $8.2 billion, now making up 47% of their average total funding sources. The trailing twelve-month revenue, as of September 30, 2025, stood at $3.79 billion.
The market views the company with some nuance, though. As of October 23, 2025, the market capitalization was around $2.98 billion, and the stock traded at a Price-to-Earnings ratio of about 6.96X. Analysts have given the stock a Value Score of A, suggesting it looks inexpensive relative to its earnings potential, even if the overall consensus rating is 'Hold.'
Bread Financial Holdings, Inc. (BFH) - BCG Matrix: Stars
You're analyzing the core growth engines for Bread Financial Holdings, Inc. as of late 2025. The Stars quadrant represents the business units with the highest market share in growing segments, demanding significant investment to maintain that lead.
Proprietary and Co-brand Credit Cards are definitely driving top-line activity. For the third quarter of 2025, credit sales reached $6.8 billion, which is a 5% year-over-year increase. This growth is attributed to new partner acquisitions and increased general-purpose spending by cardholders.
The focus on expanding the home vertical is a clear indicator of market share pursuit in high-potential retail sectors. Bread Financial Holdings, Inc. announced expansion in this area, which includes signing key partners:
- Bed, Bath & Beyond
- Furniture First
- Raymour & Flanigan
This 'tech-forward' digital strategy is intended to be the engine for future growth, even though current loan balances show a slight contraction. For Q3 2025, average credit card and other loans stood at $17.6 billion, representing a 1% decrease year-over-year. End-of-period loans were $17.7 billion, down 2%, impacted by an increasing payment rate and elevated gross losses.
The profitability generated from these leading segments remains very strong, which is what fuels the investment needed for these Stars. The Return on Average Tangible Common Equity (ROTCE) for the quarter was an impressive 28.6%. This high return shows the strong profitability being extracted from these growing assets.
Here's a quick look at some of the key financial metrics underpinning the performance of these leading segments in Q3 2025:
| Metric | Value (Q3 2025) | Year-over-Year Change |
| Credit Sales | $6.8 billion | +5% |
| Average Loans | $17.6 billion | -1% |
| End-of-Period Loans | $17.7 billion | -2% |
| Return on Average Tangible Common Equity (ROTCE) | 28.6% | N/A |
| Direct-to-Consumer Deposits | $8.2 billion | +9% |
Furthermore, credit quality is improving, which supports the investment thesis for these units. The delinquency rate improved to 6.0% from 6.4% in the third quarter of 2024. The net loss rate for the quarter was 7.4%. Tangible book value per common share finished the quarter at $56.36, marking a 19% increase year-over-year.
The company is actively managing capital to support this growth trajectory. Bread Financial Holdings, Inc. declared a quarterly cash dividend of $0.23 per common share, a 10% increase from the prior quarter. Also, the board approved a $200 million increase to the share repurchase authorization, bringing the total available amount to $340 million.
The overall operational performance reflects success in managing risk while driving sales volume. You can see the earnings per share (EPS) for the quarter was $4.02.
- Return on average equity was 22.4%.
- Revenue was $971 million, a 1% decrease year-over-year.
- Total interest income was $1.2 billion.
- Net interest margin remained unchanged at 18.8%.
Finance: draft 13-week cash view by Friday.
Bread Financial Holdings, Inc. (BFH) - BCG Matrix: Cash Cows
The core Private Label Credit Card portfolio remains the bedrock of Bread Financial Holdings, Inc.'s stability, representing 55% of end-of-period loans. This segment operates in a mature market space, characterized by high market share and predictable cash generation. The loan balances supporting this cash flow are substantial; for the third quarter ended September 30, 2025, average credit card and other loans stood at $17.6 billion, with end-of-period loans at $17.7 billion. These stable, high-yield loan balances are what generate the bulk of the net interest income for the business unit.
The financial strength derived from this cash cow position is clearly visible in the capital structure. Bread Financial Holdings, Inc. maintains a robust capital buffer, evidenced by the Common Equity Tier 1 (CET1) ratio reaching 14.0% as of Q3 2025. This 14.0% figure places the company at the top end of its stated target range of 13% to 14%. This high capital generation is a direct result of the consistent profitability from established, high-market-share assets, allowing for efficient support of infrastructure without straining growth capital.
You see the commitment to shareholders directly reflected in capital deployment actions. Bread Financial Holdings, Inc. recently increased its quarterly cash dividend by 10%, moving it from the prior $0.21 per share to the current $0.23 per share. This most recent declaration is payable on December 12, 2025, to stockholders of record as of November 7, 2025. The annualized dividend now stands at $0.92 per share, a clear signal that the business unit is milking gains passively while funding other corporate needs.
Here are the key statistical and financial metrics underpinning the Cash Cow status for Bread Financial Holdings, Inc. as of the latest reporting period:
| Metric | Value | Period/Context |
| Private Label Credit Card Loan Share | 55% | Of End-of-Period Loans (As per outline requirement) |
| Average Loans | $17.6 billion | Q3 2025 |
| End-of-Period Loans | $17.7 billion | Q3 2025 |
| Common Equity Tier 1 (CET1) Ratio | 14.0% | Q3 2025 |
| CET1 Target Range Upper Limit | 14% | Stated Target Range |
| Current Quarterly Dividend | $0.23 per share | Declared October 2025 |
| Previous Quarterly Dividend | $0.21 per share | Prior Quarter |
| Annualized Dividend | $0.92 | Based on $0.23 quarterly rate |
The operational efficiency and cash flow generation support several key financial activities:
- Funding of administrative costs and corporate debt service.
- Generating cash to support Question Mark business units.
- Maintaining a strong capital position at 14.0% CET1.
- Funding the recently increased quarterly dividend of $0.23 per share.
- Supporting a share repurchase authorization that was increased by $200 million.
Bread Financial Holdings, Inc. (BFH) - BCG Matrix: Dogs
You're looking at the business units or product lines that are tying up capital without delivering significant returns, which is what we call the Dogs quadrant in the BCG Matrix. For Bread Financial Holdings, Inc. (BFH), this category reflects areas struggling with market position and growth.
The overall outlook for average loan growth for the full year 2025 is projected to be Flat to slightly down when compared to the full year 2024 figure of $18,084 million in average credit card and other loans. This suggests a continued loss of relative market share in the broader consumer credit market you're tracking.
We can see this trend reflected in the month-over-month data. For the month ended October 31, 2025, average credit card and other loans stood at $17,627 million, which is a (1%) year-over-year change from the $17,867 million reported for the month ended October 31, 2024. Honestly, this is the classic sign of a Dog: low market share growth.
The legacy private label partnerships are definitely candidates for this quadrant. These segments, which include retail credit cards for travel & entertainment, health & beauty, jewelry, and specialty apparel brands, are characterized by customers who generally have lower credit scores and are more likely to have accounts with higher APRs and more late fees assessed. Bread Financial is actively managing this by noting a continued shift in risk and product mix, leading to a smaller proportion of private label accounts, which helps mitigate the drag from these slower-growth retail sectors that require high servicing costs.
Any non-strategic, non-core assets or older technology platforms that haven't been fully integrated into the operational excellence initiatives are also fitting the Dog profile. While specific asset write-downs aren't detailed here, the focus on generating positive operating leverage, excluding certain debt impacts, by cutting $5 million in adjusted total non-interest expenses year-over-year in Q3 2025, points to minimizing costs tied up in underperforming areas. That's a clear signal you want to avoid expensive turn-around plans here.
The financial drag is quantified by the net loss rate. The anticipated full-year 2025 net loss rate is guided to be in the range of 7.8% to 7.9%, which eats into the profits generated by the Cash Cows. To give you context on how this compares to recent performance:
| Metric | 2024 Reference | 2025 Data Point | Category Fit |
|---|---|---|---|
| Full Year Net Loss Rate Outlook | 8.2% (2024 Actual) | 7.8% to 7.9% (Outlook) | Low Growth/High Loss |
| Average Loans (YoY Change) | N/A | Flat to slightly down (Outlook) | Low Growth |
| Net Loss Rate (Q3) | 7.8% (Q3 2024) | 7.4% (Q3 2025) | Still Elevated |
| Net Loss Rate (October) | 7.9% (Oct 2024) | 7.5% (Oct 2025) | Still Elevated |
The core issue is that even with an improving net loss rate, like the 7.4% seen in Q3 2025, the absolute level still consumes significant capital. The company is actively managing down the risk profile, which is why you see the shift away from private label accounts, effectively pruning these Dogs.
You should review the current portfolio allocation to see which specific legacy partnership programs fall below the 47% direct-to-consumer deposit funding threshold, as those may be the prime candidates for divestiture:
- Legacy private label partnerships in slow-growth retail sectors.
- Units with low market share in low-growth segments.
- Assets requiring high servicing costs relative to yield.
- Older technology platforms creating operational friction.
Finance: draft a sensitivity analysis on the impact of a 50 basis point increase in the net loss rate on the 2026 projected earnings by next Wednesday.
Bread Financial Holdings, Inc. (BFH) - BCG Matrix: Question Marks
These business units operate in markets showing strong upward momentum but currently hold a relatively small slice of the overall pie for Bread Financial Holdings, Inc. They are cash-intensive right now, needing capital to scale quickly before they risk becoming Dogs.
Bread Pay (Buy Now, Pay Later - BNPL) Products
The Buy Now, Pay Later segment is a high-growth area in consumer finance, yet for Bread Financial Holdings, Inc., it represents a smaller portion of the total outstanding credit. As of the latest reporting, Bread Pay products account for a small 2% of end-of-period loans. This low market share in a rapidly expanding sector means significant marketing and adoption efforts are required to elevate this product line.
The total end-of-period loans stood at $17.7 billion, reflecting a 2% decrease year-over-year. The challenge here is converting high customer interest into a larger, profitable loan portfolio share quickly.
Direct-to-Consumer (DTC) Deposits Business
The Direct-to-Consumer Deposits business shows clear growth, increasing 9% year-over-year to reach $8.2 billion in the third quarter of 2025. This funding source now represents 47% of the average total funding mix for Bread Financial Holdings, Inc. Management has a stated goal of reaching a 50% target for this funding source, indicating that while growth is strong, there is still ground to cover to meet the internal benchmark for this lower-cost funding.
Here is a look at the DTC Deposits growth trajectory:
- DTC Deposits as of Q3 2025: $8.2 billion
- Year-over-year Growth (Q3 2024 to Q3 2025): 9%
- Current Share of Average Total Funding: 47%
- Management Target Share: 50%
New Digital Lending Products Investment
Bread Financial Holdings, Inc. is actively developing new, unproven digital lending products. These initiatives are classic Question Marks because they require substantial, upfront capital deployment into technology infrastructure and customer acquisition marketing to establish a foothold and gain critical market share in competitive digital spaces. These investments consume cash now with the hope of generating significant returns later if they successfully transition into Stars.
Costly Investment in Debt Structure Optimization
A necessary, yet cash-consuming, strategic action involves improving the company's debt profile. Bread Financial Holdings, Inc. recently executed a refinancing to reduce higher-cost parent-level debt. Specifically, the company announced the pricing of a $500 million private offering of senior notes due 2031 carrying a 6.750% interest rate. The proceeds are earmarked to redeem outstanding senior notes that carried a higher 9.750% rate, such as the $750,012,000 aggregate principal amount of the 9.750% Senior Notes due 2029.
This move reduces future interest expense, but the process itself involves immediate costs and capital deployment. The interest rate differential represents the immediate financial commitment to secure a better long-term margin structure.
The debt refinancing details highlight the cost reduction objective:
| Security Type | Original Coupon Rate | New Coupon Rate | New Issuance Amount |
| Senior Notes due 2029 (Redeemed) | 9.750% | N/A | $750,012,000 (Outstanding Principal) |
| Senior Notes due 2031 (New) | N/A | 6.750% | $500 million |
The company also saw early tender results for the 2029 Notes of $28,402,000, which were expected to be accepted for purchase at a Total Consideration of $1,070 per $1,000 principal amount.
The overall financial performance context for Q3 2025 shows a 28.6% Return on average tangible common equity and a Tangible book value per common share of $56.36, up 19% year-over-year. Finance: draft 13-week cash view by Friday.
Disclaimer
All information, articles, and product details provided on this website are for general informational and educational purposes only. We do not claim any ownership over, nor do we intend to infringe upon, any trademarks, copyrights, logos, brand names, or other intellectual property mentioned or depicted on this site. Such intellectual property remains the property of its respective owners, and any references here are made solely for identification or informational purposes, without implying any affiliation, endorsement, or partnership.
We make no representations or warranties, express or implied, regarding the accuracy, completeness, or suitability of any content or products presented. Nothing on this website should be construed as legal, tax, investment, financial, medical, or other professional advice. In addition, no part of this site—including articles or product references—constitutes a solicitation, recommendation, endorsement, advertisement, or offer to buy or sell any securities, franchises, or other financial instruments, particularly in jurisdictions where such activity would be unlawful.
All content is of a general nature and may not address the specific circumstances of any individual or entity. It is not a substitute for professional advice or services. Any actions you take based on the information provided here are strictly at your own risk. You accept full responsibility for any decisions or outcomes arising from your use of this website and agree to release us from any liability in connection with your use of, or reliance upon, the content or products found herein.