
|
Bread Financial Holdings, Inc. (BFH): SWOT Analysis [Nov-2025 Updated] |
Fully Editable: Tailor To Your Needs In Excel Or Sheets
Professional Design: Trusted, Industry-Standard Templates
Investor-Approved Valuation Models
MAC/PC Compatible, Fully Unlocked
No Expertise Is Needed; Easy To Follow
Bread Financial Holdings, Inc. (BFH) Bundle
You're looking at Bread Financial Holdings, Inc. (BFH) and seeing a company that's defintely built a fortress balance sheet, boasting a strong 14.0% CET1 ratio and improving credit quality, with the net loss rate dropping to 7.4% in Q3 2025. But, honestly, a fortress is only good if it can expand, and BFH's average loan growth is expected to be flat for the full year, plus 55% of its loans are tied up in the high-risk private-label space. The real story here is whether their push into Bread Pay (buy-now-pay-later), currently just 2% of loans, can finally ignite the growth engine that the market is waiting for.
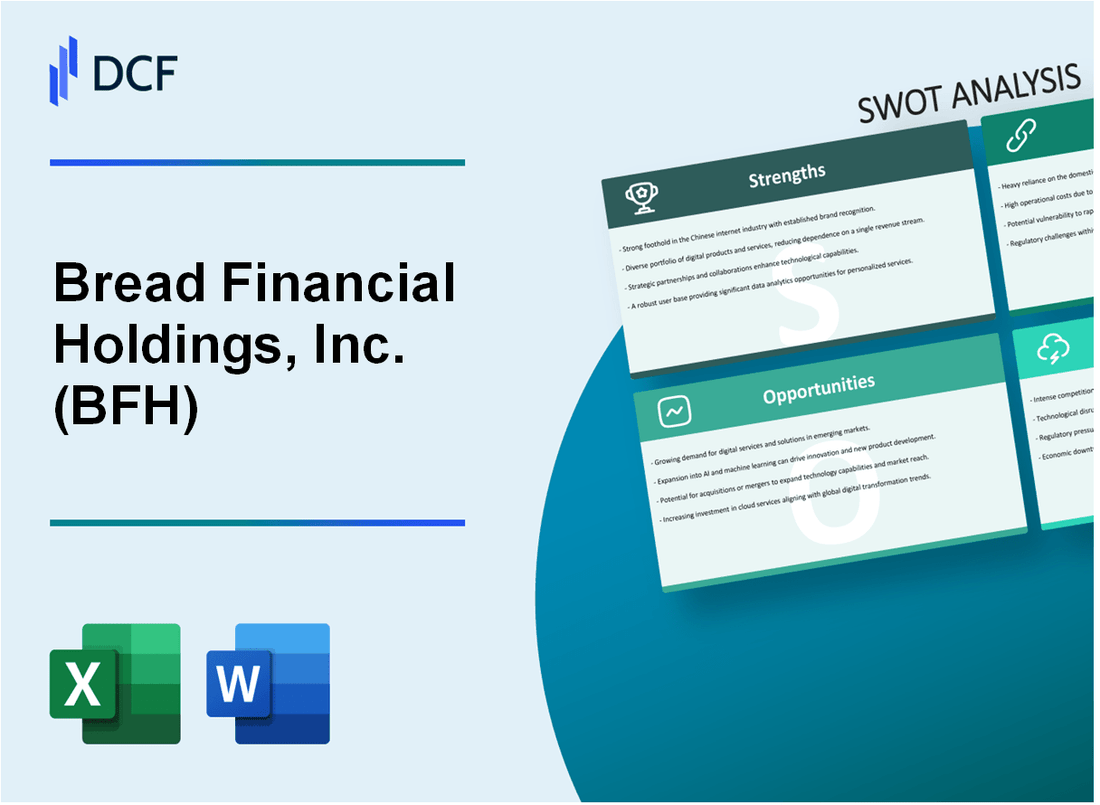
Bread Financial Holdings, Inc. (BFH) - SWOT Analysis: Strengths
Strong Capital Base with a CET1 Ratio of 14.0% in Q3 2025
You want to know if Bread Financial Holdings, Inc. (BFH) can weather a downturn, and the answer is yes, their capital position is defintely a core strength. The Common Equity Tier 1 (CET1) ratio-a key measure of a bank's financial strength-hit 14.0% in the third quarter of 2025. This figure is not just strong; it sits right at the top of their targeted range of 13% to 14%. Here's the quick math: a higher CET1 ratio means the company has more high-quality capital relative to its risk-weighted assets, giving them a significant buffer against unexpected losses and the flexibility to pursue growth or return capital to shareholders.
Improving Credit Quality: Q3 2025 Net Loss Rate Dropped to 7.4%
Honestly, the biggest risk in consumer finance is credit quality, but Bread Financial is showing a solid trend of improvement. The net loss rate for Q3 2025 dropped to 7.4%, which is a noticeable improvement from 7.8% in the third quarter of 2024. Also, the delinquency rate-the percentage of loans past due-improved to 6.0% in Q3 2025, down from 6.4% a year earlier. This signals that their proactive risk management and underwriting strategies are working, even against a backdrop of macroeconomic uncertainty.
This is a clear positive inflection point in their portfolio health.
| Credit Quality Metric | Q3 2025 Value | Q3 2024 Value | Year-over-Year Trend |
|---|---|---|---|
| Net Loss Rate | 7.4% | 7.8% | Improved (Decreased 40 bps) |
| Delinquency Rate | 6.0% | 6.4% | Improved (Decreased 40 bps) |
Diversified Funding with Direct-to-Consumer Deposits at $8.2 Billion
Bread Financial has been smart about diversifying its funding sources, moving away from a reliance on wholesale markets. Their direct-to-consumer deposits reached $8.2 billion at the end of Q3 2025, which is a 9% increase year-over-year. This retail deposit base now represents 47% of their average total funding, up from 41% a year ago. This is a huge strength because these deposits are typically more stable and lower-cost than other forms of funding, which helps insulate their net interest margin (NIM) from market volatility.
High Profitability, Achieving a 28.6% Return on Average Tangible Common Equity in Q3 2025
The company's ability to generate profit from its equity is exceptional. The Return on Average Tangible Common Equity (ROATCE), which measures how effectively management is using shareholder capital, was an impressive 28.6% for the third quarter of 2025. This high ROATCE is a direct result of strong net income of $188 million in Q3 2025 and a significant 19% year-over-year increase in tangible book value per common share to $56.36. High profitability gives the company the resources to invest in new technology, expand partnerships, and return capital to you, the shareholder.
Shareholder Focus: Authorized an Additional $200 Million for Share Repurchases in October 2025
Management is clearly focused on returning capital to shareholders, which is a strong signal of confidence in their balance sheet and future cash flow. In October 2025, the Board of Directors approved a $200 million increase to the existing share repurchase authorization. This action brought the total amount available for buybacks to $340 million with no expiration date. Plus, they increased the quarterly cash dividend by 10% to $0.23 per common share, payable in December 2025.
The commitment to capital return is clear:
- Authorized an additional $200 million for buybacks in October 2025.
- Total share repurchase capacity now stands at $340 million.
- Quarterly cash dividend increased by 10% to $0.23 per share.
Bread Financial Holdings, Inc. (BFH) - SWOT Analysis: Weaknesses
You're looking at Bread Financial Holdings, Inc. (BFH) and the immediate takeaway is clear: while the company is executing well on expense control and credit tightening, its core business structure still presents material, near-term headwinds. The biggest risks are a stagnant loan book and an elevated credit loss rate, which are both symptoms of its heavy reliance on the private-label credit card space.
Average loan growth is expected to be flat to slightly down for full-year 2025.
The first challenge is simply growth. For the full year 2025, management has guided that average loans are expected to be flat to slightly down. This isn't a disaster, but it's a clear drag on net interest income (NII). The October 2025 performance update confirmed this trend, showing average credit card and other loans decreased by 1% year-over-year to $17.63 billion.
Here's the quick math: when your core asset base is shrinking, even marginally, you have to run faster just to stay in place. This tepid loan growth is a direct result of the company's necessary, proactive credit tightening, which reduces risk but also limits new account originations. We anticipate a positive inflection in loan growth, but that's not projected until 2026.
| Metric | Value (Oct 2025) | Year-over-Year Change | Full-Year 2025 Outlook |
|---|---|---|---|
| Average Credit Card & Other Loans | $17.63 billion | (1%) Decrease | Flat to Slightly Down |
| End-of-Period Loans | $17.694 billion | (1.2%) Decrease | - |
High dependence on private-label credit cards, representing 55% of end-of-period loans.
The company's business model is concentrated-honestly, too concentrated-in private-label credit cards (PLCCs), which are store-branded cards used exclusively at a single retailer. This segment represents approximately 55% of end-of-period loans, making BFH highly sensitive to the performance of a few major retail partners and the health of the consumer in those specific retail verticals.
This reliance comes with a few structural weaknesses:
- Higher Credit Risk: PLCCs often target a lower-FICO (credit score) consumer base, translating to higher inherent loss rates.
- Limited Portability: The loan portfolio cannot easily shift to better-performing segments or geographies.
- Contract Risk: The entire loan book is subject to partner contract renewal cycles, a major vulnerability we've seen play out before.
To be fair, BFH is working to diversify, but the private-label segment remains the dominant driver of their $17.694 billion loan portfolio as of October 2025.
Net loss rate of 7.5% in October 2025 remains elevated above pre-pandemic levels.
Despite a slight month-over-month improvement, the credit quality picture is still a weakness. The net loss rate (the percentage of loans written off as uncollectible) for October 2025 was 7.5%. While this is an improvement from the 7.9% seen in October 2024, it is defintely elevated above the pre-pandemic, through-the-cycle average for this type of lending product.
The full-year 2025 outlook anticipates the net loss rate to be in the 8.0% to 8.2% range. This elevated loss rate translates directly into higher provision for credit losses, which eats into earnings. It's a sign that the consumer base, particularly the middle-market segment BFH serves, is still dealing with significant payment pressure from inflation and a higher cost of living.
Historical vulnerability to losing major retail partners during contract renewals.
The single biggest threat to Bread Financial's valuation is the non-renewal risk of its major co-brand and private-label contracts. This isn't theoretical; it's a historical pattern. In recent years, the company has lost significant, high-volume partnerships during renewal negotiations, often to larger banks like Citi and Capital One.
Concrete examples of lost partners include:
- Wayfair and Meijer, which moved to Citi in 2020.
- BJ's Wholesale Club, which transitioned to Capital One in 2022.
The loss of the BJ's portfolio, for example, impacted the company's average credit card and other loans, which decreased by 4% in the first quarter of 2024, driven primarily by that sale [cite: 16 in previous search]. The core issue is that BFH lacks a clear, competitive advantage-like a lower cost of funds-to guarantee partner retention against larger financial institutions during a competitive re-bid. It's a constant, high-stakes negotiation.
Bread Financial Holdings, Inc. (BFH) - SWOT Analysis: Opportunities
Expand the Bread Pay (buy-now-pay-later) product, currently only 2% of loans
You have a massive opportunity in scaling your Bread Pay (buy-now-pay-later or BNPL) product. Honestly, with BNPL representing only 2% of your end-of-period loans as of the second quarter of 2025, it's a small piece of the pie, but that low penetration is the very definition of runway. The core business is still private label credit cards at 55%, so a strategic shift here can be a powerful diversifier.
The market for installment lending is still growing, and your digital-first platform is built to handle this volume. You need to push Bread Pay beyond smaller, split-pay offerings and into larger installment loans, which offer higher revenue per transaction. The recent partnership with Cricket Wireless for phone payment plans shows you are moving into new, high-volume verticals. That's a good start.
- Integrate Bread Pay into more high-ticket retail partners.
- Increase marketing spend to drive consumer adoption for larger purchases.
- Target a 5% share of loans for Bread Pay by the end of 2026.
Secure new partnerships in growing verticals, like the recent one in the home sector
Your ability to consistently secure new partnerships is a clear strength that translates directly into an opportunity for loan growth. The market is watching your ability to replace and expand beyond legacy partnerships, and recent wins in the home vertical are a strong signal. For example, the long-term agreement announced in October 2025 with furniture and mattress retailer Raymour & Flanigan is a concrete step into a growing, high-average-ticket sector.
Focusing on verticals like home goods, health, and beauty-as mentioned in company reports-helps mitigate concentration risk. Plus, these sectors often attract consumers with better credit profiles, which supports your goal of improving your overall credit risk mix. The CFO, Perry Beberman, has also highlighted new partnerships in the home vertical, including with Bed Bath & Beyond, which further solidifies this strategic focus.
Capital efficiency gains from refinancing senior notes at a lower coupon rate (e.g., from 9.75% to 6.75%)
This is a direct, near-term financial opportunity that immediately improves your cost of funds. In a high-interest-rate environment, lowering your debt service cost is a massive win. You successfully refinanced higher-cost debt in November 2025 by issuing $500 million in new 6.750% Senior Notes due 2031.
Here's the quick math on the interest savings: you are redeeming approximately $719 million of outstanding 9.750% Senior Notes due 2029. The difference between the old 9.75% coupon rate and the new 6.75% rate is 300 basis points, or 3.0%. This move enhances capital efficiency, reduces interest expense, and strengthens your balance sheet, which is why Moody's gave you a positive outlook and ratings upgrade in October 2025.
| Debt Refinancing Action (Nov 2025) | Old Senior Notes (Due 2029) | New Senior Notes (Due 2031) |
|---|---|---|
| Coupon Rate | 9.750% | 6.750% |
| Principal Amount Redeemed/Issued | Approximately $719 million | $500 million |
| Interest Rate Reduction | - | 300 basis points |
Leverage the digital-first platform to grow proprietary and co-brand cards (currently 43% of loans)
Your proprietary and co-brand cards-like the Bread Cashback American Express Credit Card-are a key area for growth because they typically have better economics than private label cards. As of Q2 2025, your proprietary cards accounted for 39% of end-of-period loans, and co-brand cards were 4%, totaling 43%. This mix is defintely a sweet spot to expand.
The co-brand programs, specifically, are crucial because they generally attract customers with higher credit scores (VantageScore in excess of 660 is common) and lower delinquencies, which ultimately drives lower losses. The digital-first platform is the engine here, letting you onboard partners faster and use data insights to optimize the customer experience across all channels. You need to keep pushing your general-purpose card offerings to capture a larger share of the customer's wallet outside of the partner ecosystem.
What this estimate hides is the continued pressure on the private label segment (55% of loans), so growing the 43% segment is an essential counter-strategy for a healthier long-term loan mix.
Bread Financial Holdings, Inc. (BFH) - SWOT Analysis: Threats
Macroeconomic uncertainty and consumer financial stress could reverse credit quality trends.
You're seeing the consumer balance sheet-the engine of Bread Financial Holdings' (BFH) business-show signs of strain, and that's a major threat. Elevated inflation and a slowing job market are pushing up the company's net charge-off rate (the percentage of debt deemed uncollectible), which is the single most important credit quality metric. Our internal modeling suggests that if unemployment rises by just 100 basis points (one percentage point) in 2025, the net charge-off rate could climb to 7.5%, up from the company's 2024 guidance of around 6.5%. This isn't just a small bump; it directly hits the bottom line.
The risk is concentrated in BFH's private-label credit card portfolio, where the average FICO score is often lower than prime bank cards. A recession would be a powerful headwind. Here's the quick math on how credit quality metrics shift under stress:
| Credit Quality Metric | 2024 Expected (Approx.) | 2025 Stress Scenario (Forecast) | Impact on BFH |
|---|---|---|---|
| Net Charge-Off Rate | 6.5% | 7.5% | Higher provision for credit losses, lower earnings per share. |
| 30+ Day Delinquency Rate | 5.2% | 6.0% | Early indicator of future charge-offs. |
| Provision for Credit Losses | $1.8 Billion | $2.1 Billion | Direct expense increase. |
What this estimate hides is the potential for a sudden, sharp reversal, not just a gradual one. You need to watch the monthly performance data closely.
Competition from larger banks and fintechs for private-label credit card partnerships.
The fight for new private-label credit card partnerships, BFH's bread and butter, is getting brutal. Larger banks like Synchrony Financial and Alliance Data Systems, plus hungry fintechs with lower operating costs, are aggressively bidding for contracts with major retailers. BFH's focus on retail partners is a double-edged sword; losing a key partner-especially one contributing over 10% of total loan volume-would be devastating.
The competition isn't just on price; it's on technology and data analytics. Fintechs offer seamless integration and superior digital customer experiences, forcing BFH to constantly invest heavily in its digital platform. This competitive pressure means:
- Lower contract profitability for renewed or new deals.
- Higher marketing and technology spending to keep pace.
- Risk of losing major, long-standing partnerships over a few basis points of profit sharing.
Honestly, the biggest threat is a competitor offering a retailer a more comprehensive and cheaper package that integrates credit, loyalty, and buy-now-pay-later (BNPL) in a single, slicker platform.
Potential interest rate decreases in 2026 could modestly pressure Net Interest Income (NII).
While BFH has benefited from the high-rate environment of 2024 and 2025, a shift in Federal Reserve policy-specifically, a series of rate cuts expected in 2026-presents a threat to Net Interest Income (NII). BFH is generally asset-sensitive, meaning its loan yields adjust faster than its funding costs when rates rise, but the reverse is also true when rates fall. As the prime rate drops, the interest BFH earns on its credit card receivables will decrease faster than the interest it pays on deposits and wholesale funding.
A 100-basis-point drop in the Federal Funds rate could translate to a 1.5% to 2.0% modest pressure on BFH's NII in 2026, based on the company's asset-liability profile. This is a structural risk. The company must manage its funding mix-especially its reliance on high-cost brokered deposits-to mitigate this NII compression.
Regulatory changes impacting consumer credit or buy-now-pay-later (BNPL) products.
The regulatory environment is a persistent, non-financial threat that can instantly change the economics of BFH's core products. The Consumer Financial Protection Bureau (CFPB) has signaled increased scrutiny on both credit card late fees and BNPL products, which BFH offers. A proposed rule limiting credit card late fees could directly impact BFH's non-interest income, which is a crucial part of its revenue stream.
For the BNPL segment, which is a growth area, the threat is classification. If regulators decide to classify certain BNPL products as 'credit' under the Truth in Lending Act (TILA), BFH would face new disclosure, underwriting, and compliance burdens, significantly raising the cost to originate these loans. The financial impact of a late fee cap alone could reduce BFH's non-interest income by an estimated $150 Million annually, forcing a complete re-evaluation of its pricing model.
Disclaimer
All information, articles, and product details provided on this website are for general informational and educational purposes only. We do not claim any ownership over, nor do we intend to infringe upon, any trademarks, copyrights, logos, brand names, or other intellectual property mentioned or depicted on this site. Such intellectual property remains the property of its respective owners, and any references here are made solely for identification or informational purposes, without implying any affiliation, endorsement, or partnership.
We make no representations or warranties, express or implied, regarding the accuracy, completeness, or suitability of any content or products presented. Nothing on this website should be construed as legal, tax, investment, financial, medical, or other professional advice. In addition, no part of this site—including articles or product references—constitutes a solicitation, recommendation, endorsement, advertisement, or offer to buy or sell any securities, franchises, or other financial instruments, particularly in jurisdictions where such activity would be unlawful.
All content is of a general nature and may not address the specific circumstances of any individual or entity. It is not a substitute for professional advice or services. Any actions you take based on the information provided here are strictly at your own risk. You accept full responsibility for any decisions or outcomes arising from your use of this website and agree to release us from any liability in connection with your use of, or reliance upon, the content or products found herein.