
|
Blue Foundry Bancorp (BLFY): 5 FORCES Analysis [Nov-2025 Updated] |
Fully Editable: Tailor To Your Needs In Excel Or Sheets
Professional Design: Trusted, Industry-Standard Templates
Investor-Approved Valuation Models
MAC/PC Compatible, Fully Unlocked
No Expertise Is Needed; Easy To Follow
Blue Foundry Bancorp (BLFY) Bundle
You're digging into the competitive landscape for Blue Foundry Bancorp right now, and honestly, the story isn't just about the bank itself; it's about the clock ticking before the $243 million merger with Fulton Financial closes. Before that deal finalizes, we need to see how the independent entity stands up to market pressures. Here's the quick math: high supplier power driven by expensive time deposits-making up 53% of funds in Q3 2025-is squeezing an already tight Net Interest Margin of 2.34% against customers who can easily walk away. Plus, that reported Q3 net loss of $1.9 million shows just how tough the rivalry is in northern New Jersey. Let's break down exactly where the leverage sits across all five of Porter's forces so you can map the risk profile before the acquisition completes.
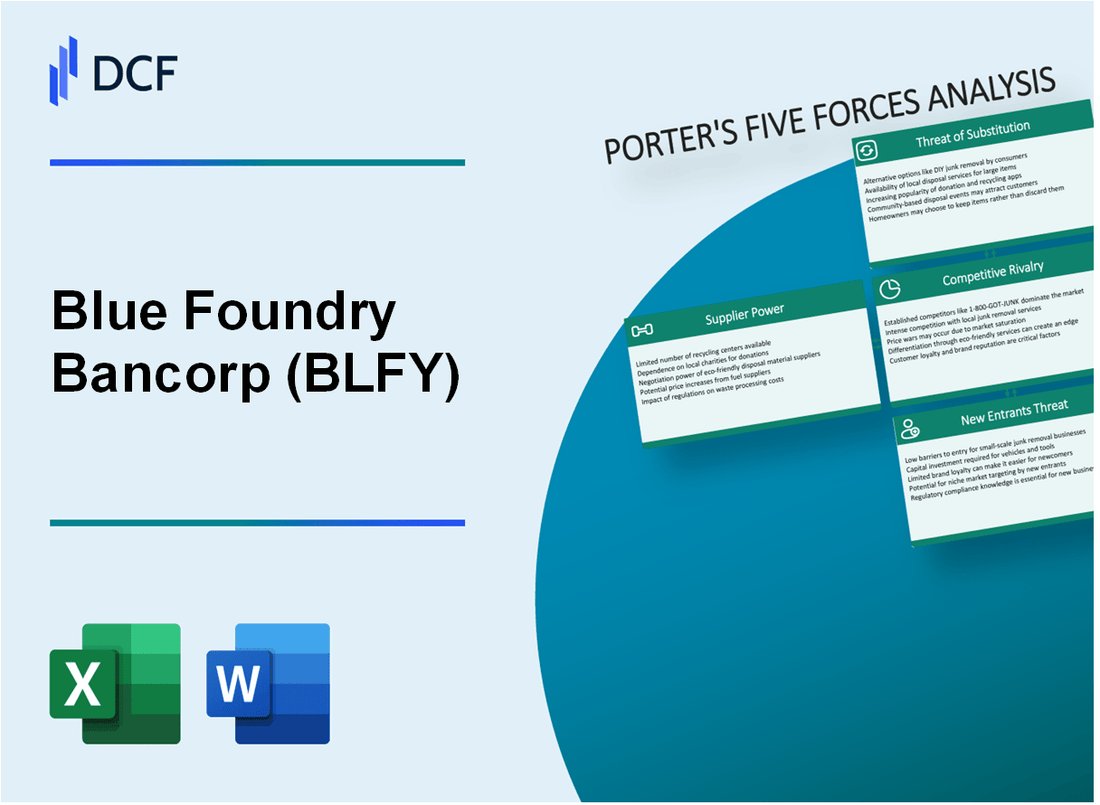
Blue Foundry Bancorp (BLFY) - Porter's Five Forces: Bargaining power of suppliers
The bargaining power of suppliers in the banking sector primarily relates to the cost and availability of funds, which are the raw materials for lending. For Blue Foundry Bancorp, the suppliers are the depositors, and their power is directly influenced by competitive deposit pricing and the composition of the bank's funding base.
High cost of funds due to significant time deposits, which were 53% of total deposits in Q3 2025.
The funding structure at the end of the third quarter of 2025 showed total deposits at $1.49 billion. While the exact figure for time deposits at 53% is not directly confirmed, the composition shows that Core Deposits-which are typically lower-cost-represented 57.8% of total deposits when excluding brokered deposits as of September 30, 2025. The reliance on more rate-sensitive funding sources is evident in the growth of brokered deposits.
Intense competition in New Jersey forces higher deposit rates to retain the $1.49 billion deposit base.
Retaining the $1.49 billion deposit base in the northern New Jersey market requires competitive pricing. The reliance on brokered funding, which is inherently more sensitive to market rates, suggests upward pressure on funding costs. For context on the cost of these alternative funds, brokered deposits secured in the first quarter of 2025 were noted at rates around 3.75%.
Reliance on brokered deposits, totaling $205.0 million in Q1 2025, increases funding cost sensitivity.
The use of wholesale funding channels highlights a supplier dynamic where cost can spike quickly. Blue Foundry Bancorp utilized $205.0 million in brokered deposits as of March 31, 2025. This figure was an increase from $155.0 million at the end of the prior year, indicating a strategic supplement to retail time deposits that were being reduced.
Core deposit growth of only $18.6 million in Q3 2025 shows difficulty in attracting low-cost funds.
The ability to attract stable, low-cost funding-the most favorable supplier relationship-is a key metric. In the third quarter of 2025, Blue Foundry Bancorp reported core deposit growth of only $18.6 million over the linked quarter. This slow growth, despite an overall deposit increase of $77.1 million to reach $1.49 billion, suggests that a significant portion of the recent funding came from more expensive sources, such as the increased brokered deposits which rose to $275.0 million by Q3 2025.
Key Funding Metrics Comparison:
| Metric | Date/Period | Amount/Percentage |
|---|---|---|
| Total Deposits | Q3 2025 (September 30) | $1.49 billion |
| Brokered Deposits | Q1 2025 (March 31) | $205.0 million |
| Brokered Deposits | Q3 2025 (September 30) | $275.0 million |
| Core Deposit Growth | Q3 2025 (vs. Q2 2025) | $18.6 million |
| Core Deposits as % of Total Deposits (Excl. Brokered) | Q3 2025 (September 30) | 57.8% |
| Core Deposits as % of Total Deposits | Q1 2025 (March 31) | 47.6% |
The supplier power is further illustrated by the shift in funding composition:
- Core deposits increased $68.2 million over the nine months ending September 30, 2025.
- Brokered deposits increased by $120.0 million from December 31, 2024, to September 30, 2025.
- The increase in brokered deposits offset the reduction in retail time deposits in Q1 2025.
Blue Foundry Bancorp (BLFY) - Porter's Five Forces: Bargaining power of customers
The bargaining power of customers for Blue Foundry Bancorp is a significant factor shaping its near-term financial strategy, especially given the competitive density of its primary operating area in New Jersey. You have to recognize that in a mature market, customers hold considerable sway over pricing, which directly impacts the bank's profitability metrics.
Extremely low switching costs for both retail and commercial customers in the dense New Jersey market.
For the average retail customer, moving direct deposits and automated payments is now streamlined, even if it takes a bit of effort. Blue Foundry Bancorp itself acknowledges this friction point by providing a 'Switch Kit' on its website, complete with an 'Account Balance Worksheet' and a 'Direct Deposit Authorization Form,' which suggests they are actively trying to ease the process for new customers switching to them, but this ease of transition applies equally to customers leaving. The bank operates 16 branches across Bergen, Morris, Essex, and Passaic Counties, New Jersey, placing it in direct competition with numerous local, regional, and national institutions.
Customers have strong leverage due to the availability of numerous national and regional bank alternatives.
Operating in the greater New York metropolitan area's sphere of influence means Blue Foundry Bancorp faces a vast array of competitors. This high availability of alternatives means customers can easily compare offerings. This competitive pressure is a constant headwind for margin expansion. The recent agreement for Fulton Financial Corporation to acquire Blue Foundry Bancorp for $243 million in stock, pricing the bank at 77% of its tangible book value, hints at the market's perception of the inherent pricing challenges in this specific geography.
Borrowers can easily shop for better loan rates, pressuring the bank's Net Interest Margin (NIM) of 2.34% (Q3 2025).
The ability of borrowers to shop around directly constrains how high Blue Foundry Bancorp can set its lending rates without losing volume. This pressure is reflected in the reported Net Interest Margin (NIM) for the third quarter of 2025, which stood at 2.34%. While this was an expansion of 6 basis points from the linked second quarter of 2025, it remains a relatively tight margin, indicating that the cost of funds is still a major factor in pricing decisions. You can see how the NIM compares to other key metrics:
| Metric | Value (Q3 2025) | Context/Comparison |
|---|---|---|
| Net Interest Margin (NIM) | 2.34% | Up 6 basis points from Q2 2025 |
| Yield on Average Interest-Earning Assets | 4.67% | Up 9 basis points from Q2 2025 |
| Cost of Average Interest-Bearing Liabilities | 2.72% | Down 4 basis points from Q2 2025 |
| Commercial Loan Pipeline Rate (Anticipated) | About 7% | Weighted average rate on executed letters of intent |
Loan portfolio shift to higher-yielding assets, like commercial real estate, increases customer rate sensitivity.
To combat margin compression, Blue Foundry Bancorp is actively managing its asset mix. Management noted a focus on optimizing portfolio composition, encouraged by growth in owner-occupied commercial real estate (CRE) and commercial and industrial (C&I) loans. This shift is evident in the balance sheet changes:
- CRE loans grew to $317.1 million as of September 30, 2025, up from $259.6 million at the end of 2024.
- The bank also purchased unsecured consumer loans to improve yields.
- The loan pipeline has over $41 million in executed letters of intent, primarily in commercial lending, with anticipated weighted average rates around 7%.
While these higher-yielding assets are a necessary response to competitive rate pressure, they also mean that commercial borrowers, who are typically more sophisticated, are highly rate-sensitive and will actively seek the best terms available in the market. This dynamic reinforces the high bargaining power of the borrowing segment of the customer base. If onboarding takes 14+ days, churn risk rises.
Blue Foundry Bancorp (BLFY) - Porter's Five Forces: Competitive rivalry
You're looking at the competitive intensity in northern New Jersey, and honestly, it's a tough spot for Blue Foundry Bancorp. The rivalry here is intense because you're up against many larger, more profitable regional banks. To give you a sense of scale, when Fulton Financial Corporation announced its acquisition, it was a $32 billion asset financial holding company. Blue Foundry Bancorp, by comparison, reported total assets of $2.16 billion as of September 30, 2025. That difference in scale definitely limits how aggressively Blue Foundry Bancorp can price its services against established players.
The financial performance in the third quarter of 2025 underscores this pressure. Blue Foundry Bancorp reported a net loss of $1.9 million, or $0.10 per diluted share. While this was an improvement from the $2.0 million loss in the prior quarter, the fact remains that the company is operating at a loss, which severely restricts pricing flexibility when rivals have deeper pockets. Here are a few key Q3 2025 figures that show where the pressure points are:
- Net Loss: $(1.9) million
- Net Interest Income: $12.2 million
- Net Interest Margin: 2.34%
- Non-interest Expense: $13.9 million
- Quarterly Pre-provision Net Loss: $1.3 million
Direct competition for commercial clients is high in this market. You need to offer full-service banking solutions and superior technology to win and keep business. Blue Foundry Bancorp has been growing its commercial real estate loan portfolio, reaching $317.1 million by the end of Q3 2025, up from $259.6 million at the end of 2024, but this growth happens while needing to match the broader product suite of larger competitors like Fulton, which offers robust commercial, consumer, wealth advisory, and mortgage services.
Still, the structural element of this rivalry is being resolved by the announced merger. The rivalry is structurally mitigated by the announced acquisition by Fulton Financial, valued at approximately $243 million in an all-stock transaction. This deal prices Blue Foundry Bancorp at 77% of its tangible book value, which was reported to be over $15 per share in Q3 2025. The terms involve exchanging 0.6500 shares of Fulton common stock for each Blue Foundry share, based on Fulton's $17.96 share price on November 21, 2025, valuing each share at $11.67.
Here's a quick look at the relative scale of the two entities involved in this structural shift:
| Metric | Blue Foundry Bancorp (Q3 2025) | Fulton Financial Corporation (Announced Scale) |
| Total Assets | $2.16 billion | $32 billion |
| Acquisition Valuation | N/A | $243 million |
| Expected Closing | N/A | Q2 2026 |
| Expected Accretion (1st Year Earnings) | N/A | Over 5% |
The transaction is expected to close in the second quarter of 2026, and Fulton projects it will be accretive to first full-year earnings by over 5% and immediately accretive to tangible book value per share. This merger essentially removes Blue Foundry Bancorp as an independent, loss-making competitor in the region, replacing it with a larger, more capitalized entity that plans to leverage its robust services in the northern New Jersey market.
Blue Foundry Bancorp (BLFY) - Porter's Five Forces: Threat of substitutes
You're looking at Blue Foundry Bancorp (BLFY) as of late 2025, and the pressure from outside the traditional banking box is intense. The threat of substitutes here isn't just theoretical; it's showing up in market share shifts and pricing pressure on your funding costs. For a bank with $1.49 billion in deposits as of Q3 2025, keeping those funds sticky against alternatives is a daily battle.
Significant threat from non-bank FinTech platforms offering faster, cheaper consumer and small business loans.
FinTechs are chipping away at the lending side, which indirectly affects deposit gathering because customers often prefer a single provider for both. While banks retain a funding advantage in the form of low-cost deposits, fintechs are gaining traction with more seasoned customer data and maturing underwriting models. Globally, fintechs have penetrated only about 3% of banking and insurance revenues, but they are growing three times more quickly than incumbent banks. Private credit funds are also a factor, with an estimated $280 billion white-space opportunity in fintech-originated loans. Blue Foundry Bancorp's loan portfolio stood at $1.71 billion at the end of Q3 2025, with consumer/other loans growing to $121.8 million from just $7.2 million at year-end 2024, suggesting some internal growth in areas where fintechs are strong, but the external competition is fierce.
Money market funds and Treasury bills are strong substitutes for the bank's deposit products.
This is a direct funding threat, especially when rates are elevated. Bank deposits and Money Market Funds (MMFs) have combined assets exceeding $20 trillion. The competition was stark between Q2 2022 and Q2 2023, where household bank deposits fell by $1.153 trillion, while MMF shares increased by $777 billion. By 2024, U.S. MMF assets reached $7 trillion. For Blue Foundry Bancorp, whose time deposits made up 53% of its $1.49 billion total deposits, or $789 million, at the end of Q3 2025, the yield differential is critical, especially with significant maturities looming in late 2025 and 2026. If you aren't paying competitive rates, those funds will move. To be fair, the substitution effect lessens when cash liquidity is abundant, but that doesn't help when a customer is actively seeking yield.
Here's a quick look at how deposit competition plays out in the broader market, which sets the bar for what Blue Foundry Bancorp must compete against:
| Metric/Entity | Value/Rate | Context |
|---|---|---|
| Total Bank Deposits + MMF Assets (Combined) | Exceeding $20 trillion | Scale of the substitute market. |
| Household Bank Deposit Decline (Q2 2022 - Q2 2023) | $1.153 trillion | Direct flow out of bank accounts. |
| MMF Share Increase (Q2 2022 - Q2 2023) | $777 billion | Direct flow into a key substitute. |
| U.S. MMF Assets (as of 2024) | $7 trillion | Total size of the MMF market. |
| Blue Foundry Bancorp NIM (Q3 2025) | 2.34% | Overall profitability metric, impacted by funding costs. |
| Small Bank Savings Rate (Example) | 0.2 percent (20 basis points) | Rate paid by banks under $10B assets on $2,500 accounts. |
Online-only banks (neobanks) substitute for branch-based services, especially for younger customers.
Neobanks are capturing significant user growth and revenue, directly challenging the value proposition of a physical footprint like Blue Foundry Bank's branches. The U.S. neobanking market is projected to grow from $34.56 billion in 2024 to $263.67 billion by 2032, showing a projected CAGR of 27.31%. In 2025, North America's neobank user base reached 39 million users, marking a 22% year-over-year increase. Top U.S. neobanks reported combined revenue of $4.8 billion in 2025. This segment appeals to customers seeking convenience and low fees, which is a tough value proposition for a traditional community bank to match without significant digital investment.
Direct capital markets and private credit funds substitute for traditional commercial real estate lending.
While Blue Foundry Bancorp grew its commercial real estate portfolio to $317.1 million in Q3 2025, this lending area is increasingly accessible via non-bank channels. Private credit funds are actively participating in this space, evidenced by the estimated $280 billion white-space opportunity in fintech-originated loans. This means sophisticated borrowers can bypass the bank's underwriting and relationship management entirely. The threat here is that the most creditworthy, largest commercial borrowers may choose the speed and potentially better terms from private capital sources rather than relying on a community bank's balance sheet.
Key dynamics in this substitution:
- Fintechs grow three times more quickly than incumbent banks globally.
- Private credit funds are actively seeking fintech-originated assets.
- Business accounts drive a large share of neobank revenue, targeting SMEs.
- The rise of digital-first platforms pressures traditional relationship banking models.
- Blue Foundry Bancorp's core deposits grew by only $18.6 million in Q3 2025, showing slower growth relative to the overall deposit market shifts.
Finance: draft a sensitivity analysis on the impact of a 100 basis point shift in MMF rates versus Blue Foundry Bank's deposit beta by next Tuesday.
Blue Foundry Bancorp (BLFY) - Porter's Five Forces: Threat of new entrants
Regulatory hurdles for traditional new bank formation create a substantial barrier to entry. Startups seeking a de novo national bank charter must navigate strict capital demands and lengthy approval processes. Technically, minimum capital ratios include a 4.5 percent Common Equity Tier 1 (CET1) ratio, a 6 percent Tier 1 capital ratio, and an 8 percent total capital ratio. However, startups typically raise capital well above these minimums, often between $15 million and $30 million to satisfy regulators and cover initial operating needs. Application and licensing expenses alone can range from $500,000 to $1 million. Furthermore, a newly approved de novo institution, such as Erebor Bank in October 2025, faces enhanced scrutiny for its first three years, including maintaining a minimum 12 percent Tier 1 leverage ratio. This contrasts with Blue Foundry Bancorp's reported Tier 1 leverage ratio of 13.36 percent as of September 30, 2025, demonstrating the established capital base required to operate without such immediate, heightened oversight.
New entrants to the competitive landscape for Blue Foundry Bancorp are less likely to come from similarly chartered, traditional banks and more likely to manifest as technology-driven non-bank lenders. These fintech competitors often operate with significantly lower overhead costs by avoiding physical branch networks, allowing them to potentially undercut pricing or offer superior digital user experiences. The approval of a de novo bank targeting technology companies and ultra-high-net-worth individuals, which plans to hold digital assets, signals that the regulatory environment is permitting new, specialized, tech-focused entrants.
Blue Foundry Bancorp's relatively small scale positions it as a potential acquisition target rather than a significant independent threat to larger, established players. As of September 30, 2025, the company's total assets stood at approximately $2.16 billion. This size makes it an attractive bolt-on acquisition for larger regional banks seeking immediate market share in specific geographies, like Northern New Jersey. The threat here is not from Blue Foundry Bancorp launching new ventures that compete with new entrants, but rather from larger entities absorbing its operations.
The most immediate factor neutralizing the threat of new entrants for Blue Foundry Bancorp as an independent entity is the announced merger. Fulton Financial Corporation, an entity with approximately $32 billion in assets, entered into a definitive agreement to acquire Blue Foundry Bancorp in an all-stock transaction valued at approximately $243 million. This transaction is expected to close in the second quarter of 2026. Upon closing, Blue Foundry Bank will merge into Fulton Bank, N.A., effectively removing Blue Foundry Bancorp as an independent competitor in the market.
Here is a comparison of the relevant financial and regulatory metrics:
| Metric | Blue Foundry Bancorp (BLFY) as of 9/30/2025 | New De Novo Bank Requirement/Benchmark | Fulton Financial (FULT) Asset Size |
|---|---|---|---|
| Total Assets | $2.16 billion | N/A | $32 billion |
| Transaction Valuation (Acquisition) | N/A | N/A | $243 million |
| Minimum CET1 Capital Ratio | 17.63 percent | 4.5 percent (Minimum) | N/A |
| Tier 1 Leverage Ratio | 13.36 percent | Minimum 12 percent (Enhanced Scrutiny) | N/A |
| Estimated Initial Capital Needed | N/A | $15 million to $30 million | N/A |
| Expected Merger Close | N/A | N/A | Q2 2026 |
The barriers to entry for new, traditional banks include:
- Application and licensing costs estimated at $500,000 to $1 million.
- Mandatory initial capital raise often between $15 million and $30 million.
- Regulatory scrutiny requiring strong governance and risk management from day one.
- The need to secure FDIC deposit insurance and Federal Reserve oversight.
The threat from technology-driven non-bank lenders is characterized by:
- Lower overhead costs due to a digital-first model.
- The emergence of new charter applications focused on digital assets.
- Competition requiring new banks to carve out distinct niches.
Disclaimer
All information, articles, and product details provided on this website are for general informational and educational purposes only. We do not claim any ownership over, nor do we intend to infringe upon, any trademarks, copyrights, logos, brand names, or other intellectual property mentioned or depicted on this site. Such intellectual property remains the property of its respective owners, and any references here are made solely for identification or informational purposes, without implying any affiliation, endorsement, or partnership.
We make no representations or warranties, express or implied, regarding the accuracy, completeness, or suitability of any content or products presented. Nothing on this website should be construed as legal, tax, investment, financial, medical, or other professional advice. In addition, no part of this site—including articles or product references—constitutes a solicitation, recommendation, endorsement, advertisement, or offer to buy or sell any securities, franchises, or other financial instruments, particularly in jurisdictions where such activity would be unlawful.
All content is of a general nature and may not address the specific circumstances of any individual or entity. It is not a substitute for professional advice or services. Any actions you take based on the information provided here are strictly at your own risk. You accept full responsibility for any decisions or outcomes arising from your use of this website and agree to release us from any liability in connection with your use of, or reliance upon, the content or products found herein.