
|
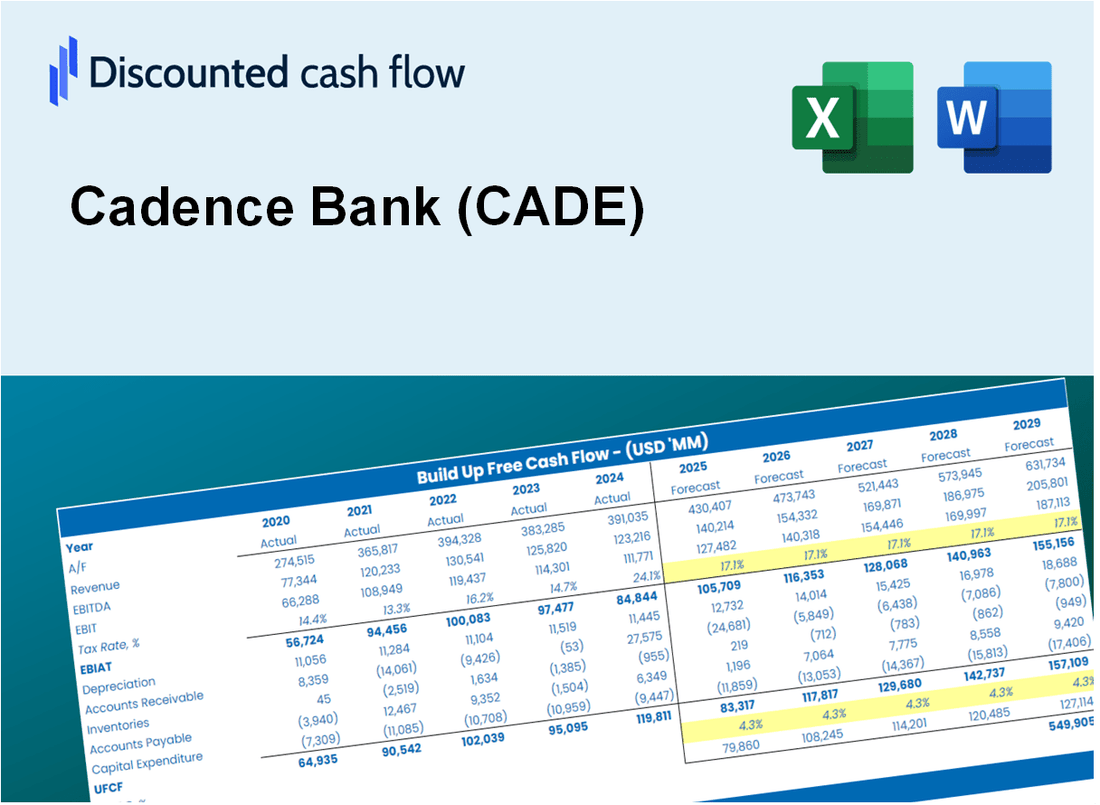
Cadence Bank (CADE) DCF Valuation |
Fully Editable: Tailor To Your Needs In Excel Or Sheets
Professional Design: Trusted, Industry-Standard Templates
Investor-Approved Valuation Models
MAC/PC Compatible, Fully Unlocked
No Expertise Is Needed; Easy To Follow
Cadence Bank (CADE) Bundle
Enhance your investment strategies with the Cadence Bank (CADE) DCF Calculator! Explore authentic financial data from Cadence Bank, adjust growth predictions and expenses, and instantly observe how these modifications affect the intrinsic value of Cadence Bank (CADE).
What You Will Get
- Real CADE Financial Data: Pre-filled with Cadence Bank’s historical and projected data for precise analysis.
- Fully Editable Template: Modify key inputs like revenue growth, WACC, and EBITDA % with ease.
- Automatic Calculations: See Cadence Bank’s intrinsic value update instantly based on your changes.
- Professional Valuation Tool: Designed for investors, analysts, and consultants seeking accurate DCF results.
- User-Friendly Design: Simple structure and clear instructions for all experience levels.
Key Features
- Comprehensive CADE Data: Pre-loaded with Cadence Bank’s historical financial performance and future projections.
- Customizable Inputs: Modify key parameters such as loan growth, interest margins, WACC, tax rates, and capital expenditures.
- Adaptive Valuation Model: Instantaneous recalculations of Net Present Value (NPV) and intrinsic value based on your adjustments.
- Scenario Analysis: Develop various forecasting scenarios to assess different valuation possibilities.
- User-Centric Interface: Intuitive, organized, and tailored for both industry professionals and newcomers.
How It Works
- Step 1: Download the Excel file.
- Step 2: Review Cadence Bank’s pre-filled financial data and forecasts.
- Step 3: Modify critical inputs like revenue growth, WACC, and tax rates (highlighted cells).
- Step 4: Watch the DCF model update instantly as you tweak assumptions.
- Step 5: Analyze the outputs and use the results for investment decisions regarding Cadence Bank (CADE).
Why Choose This Calculator for Cadence Bank (CADE)?
- User-Friendly Interface: Tailored for both novice users and seasoned professionals.
- Customizable Inputs: Adjust parameters easily to suit your financial analysis.
- Real-Time Feedback: Observe immediate changes in Cadence Bank’s valuation as you modify inputs.
- Preloaded Data: Comes with Cadence Bank’s actual financial metrics for swift evaluations.
- Relied Upon by Experts: Utilized by investors and financial analysts for informed decision-making.
Who Should Use This Product?
- Professional Investors: Develop comprehensive and accurate valuation models for portfolio assessments related to Cadence Bank (CADE).
- Corporate Finance Teams: Evaluate valuation scenarios to inform strategic decisions within the organization.
- Consultants and Advisors: Deliver precise valuation insights to clients investing in Cadence Bank (CADE).
- Students and Educators: Utilize real-time data for practical exercises and teaching in financial modeling.
- Banking Enthusiasts: Gain insights into how financial institutions like Cadence Bank (CADE) are assessed in the market.
What the Template Contains
- Operating and Balance Sheet Data: Pre-filled Cadence Bank historical data and forecasts, including revenue, EBITDA, EBIT, and capital expenditures.
- WACC Calculation: A dedicated sheet for Weighted Average Cost of Capital (WACC), including parameters like Beta, risk-free rate, and share price.
- DCF Valuation (Unlevered and Levered): Editable Discounted Cash Flow models showing intrinsic value with detailed calculations.
- Financial Statements: Pre-loaded financial statements (annual and quarterly) to support analysis.
- Key Ratios: Includes profitability, leverage, and efficiency ratios for Cadence Bank (CADE).
- Dashboard and Charts: Visual summary of valuation outputs and assumptions to analyze results easily.
Disclaimer
All information, articles, and product details provided on this website are for general informational and educational purposes only. We do not claim any ownership over, nor do we intend to infringe upon, any trademarks, copyrights, logos, brand names, or other intellectual property mentioned or depicted on this site. Such intellectual property remains the property of its respective owners, and any references here are made solely for identification or informational purposes, without implying any affiliation, endorsement, or partnership.
We make no representations or warranties, express or implied, regarding the accuracy, completeness, or suitability of any content or products presented. Nothing on this website should be construed as legal, tax, investment, financial, medical, or other professional advice. In addition, no part of this site—including articles or product references—constitutes a solicitation, recommendation, endorsement, advertisement, or offer to buy or sell any securities, franchises, or other financial instruments, particularly in jurisdictions where such activity would be unlawful.
All content is of a general nature and may not address the specific circumstances of any individual or entity. It is not a substitute for professional advice or services. Any actions you take based on the information provided here are strictly at your own risk. You accept full responsibility for any decisions or outcomes arising from your use of this website and agree to release us from any liability in connection with your use of, or reliance upon, the content or products found herein.