
|
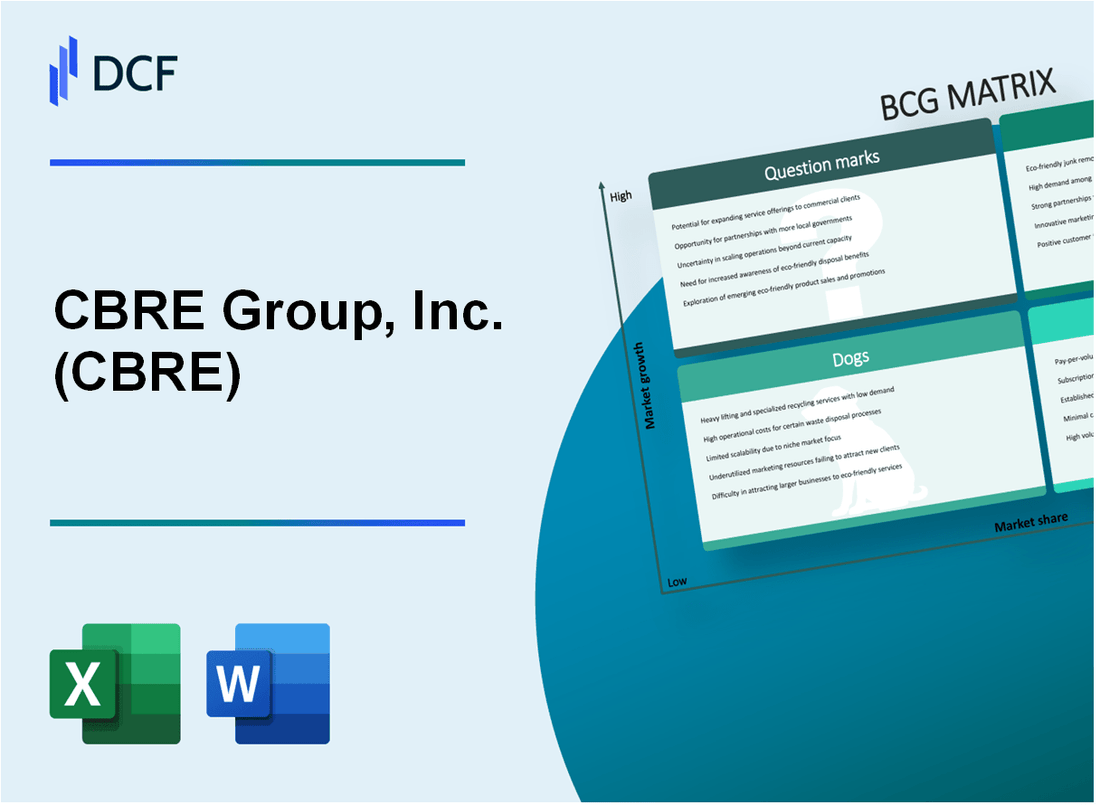
CBRE Group, Inc. (CBRE): BCG Matrix [Dec-2025 Updated] |
Fully Editable: Tailor To Your Needs In Excel Or Sheets
Professional Design: Trusted, Industry-Standard Templates
Investor-Approved Valuation Models
MAC/PC Compatible, Fully Unlocked
No Expertise Is Needed; Easy To Follow
CBRE Group, Inc. (CBRE) Bundle
You're looking for a clear map of where CBRE Group, Inc. is winning and where it's facing headwinds in late 2025, so let's break down the segments using the Boston Consulting Group framework to see the strategy in action. We'll see high-flyers like Advisory Services' Capital Markets, with global property sales up 30%, sitting alongside stable giants like the Building Operations & Experience segment, which is still seeing 14.5% growth, but we also have to look at the drag from legacy office management and the big capital question marks surrounding the massive $31.7 billion development pipeline. This analysis cuts straight to where CBRE Group, Inc. needs to invest, hold, or divest right now, so dive in to see the full picture.
Background of CBRE Group, Inc. (CBRE)
You're looking at CBRE Group, Inc. (CBRE), which, as of late 2025, stands as the world's largest commercial real estate services and investment firm, based on its 2024 revenues. Headquartered in Dallas, this powerhouse serves clients in more than 100 countries with a team exceeding 140,000 employees, including those from Turner & Townsend. It's a massive operation, and frankly, its scale is a key differentiator in this market.
CBRE Group, Inc. recently streamlined how it reports its business, effective January 1, 2025, moving to four primary segments. These are Advisory Services; Building Operations & Experience, which now incorporates the flexible workplace solutions from the recent Industrious acquisition; Project Management; and Real Estate Investments. This structure helps you see where the contractual, more resilient revenue streams are coming from versus the transactional side.
The performance through the first three quarters of 2025 definitely shows this strategy at work. For the third quarter alone, total revenue hit $10.3 billion, marking a 14% year-over-year increase. The Resilient Businesses segment was the heavy lifter, bringing in $8.4 billion in revenue, up 14%. Transactional Businesses revenue was also solid, growing 13% to $1.9 billion in that same quarter. That balance is what management likes to point to.
Financially, things looked strong heading into the final quarter. For Q3 2025, GAAP Earnings Per Share (EPS) was $1.21, and Core EPS reached $1.61, showing significant operating leverage. Management felt confident enough in the year-to-date results to raise the full-year 2025 Core EPS outlook to a range of $6.25 to $6.35. That midpoint suggests growth of more than 24% for the entire year, which is quite something given the market noise. Also, their Assets Under Management (AUM) stood at $155.8 billion at the end of Q3 2025, and liquidity was healthy at $5.2 billion.
The company maintains a capital-light model, which supports its balance sheet strength. For instance, the net leverage ratio was reported at 1.47x at the end of Q2 2025, well below their debt covenant. They are expecting to generate approximately $1.8 billion in free cash flow for the full year 2025. This financial discipline, combined with their market leadership, sets the stage for how we need to view their business units now.
CBRE Group, Inc. (CBRE) - BCG Matrix: Stars
You're looking at the engine room of CBRE Group, Inc. (CBRE) growth right now. Stars, in the Boston Consulting Group (BCG) framework, are those business units operating in high-growth markets where CBRE holds a commanding market share. These segments demand heavy investment to maintain that lead, but they are the future Cash Cows, so we keep pouring capital in. Honestly, if you aren't investing here, you're missing the near-term upside.
The current crop of Stars shows where the market momentum is strongest for CBRE. These aren't just steady earners; they are actively capturing market share in expanding sectors. Here's a look at the key drivers defining the Star quadrant for CBRE as of late 2025:
- Advisory Services' Capital Markets, with global property sales up 30% in Q3 2025.
- Project Management, which saw revenue increase 20.4% in Q3 2025, driven by data center and infrastructure demand.
- Global Leasing activity, hitting the highest Q2 revenue in company history, showing strong market share capture.
- High-growth areas like industrial and multifamily asset sales, which led the 32% US sales revenue rise in Q3 2025.
To give you a clearer picture of the performance metrics driving these segments into the Star category, look at this breakdown. The growth rates are what separate them from the Cash Cows, which operate in slower-growing markets. These numbers show significant top-line momentum, which is exactly what we want to see from a Star segment.
| Star Business Segment | Key Growth Metric (Q3 2025 or latest) | Performance Value | Market Context |
| Advisory Services' Capital Markets | Global Property Sales Growth | 30% | High-growth global transaction market |
| Project Management | Revenue Increase | 20.4% | Infrastructure and data center build-out demand |
| US Sales Revenue (Industrial/Multifamily) | US Sales Revenue Rise | 32% | Leading high-growth US asset classes |
| Global Leasing Activity | Q2 Revenue Benchmark | Highest in company history | Strong market share acquisition |
The investment thesis here is clear: maintain dominance. The Project Management segment, for instance, is riding the wave of digital infrastructure needs, showing a revenue jump of 20.4% in Q3 2025. That kind of growth is expensive to fuel-you need the best people and technology-but it solidifies their leadership position. Similarly, the 32% rise in US sales revenue driven by industrial and multifamily shows CBRE is perfectly positioned in the most dynamic parts of the US real estate cycle. If CBRE maintains this trajectory until those markets mature, these units will become the next generation of reliable cash generators. It's a defintely capital-intensive phase, but necessary.
Global Leasing activity hitting its highest Q2 revenue ever underscores market share capture in a core service line. This isn't just about volume; it's about winning mandates against competitors in a competitive leasing environment. The 30% jump in global property sales within Advisory Services' Capital Markets is the headline grabber, showing massive transaction velocity. You want to see these high-growth, high-share businesses continue to consume cash for now, as that cash is being reinvested directly into securing future market leadership.
CBRE Group, Inc. (CBRE) - BCG Matrix: Cash Cows
Cash Cows within CBRE Group, Inc. (CBRE) are those business units operating in mature markets where the company maintains a dominant market share, thus generating significant, stable cash flow that funds other parts of the portfolio. These are the businesses you want to maintain and 'milk' passively.
The newly established Building Operations & Experience (BOE) segment, which consolidates enterprise and local facilities management, property management, and flexible workplace solutions from the former Global Workplace Solutions (GWS) structure, is positioned here due to its recurring nature. For 2025, the expected revenue growth for the Building Operations & Experience segment is projected at 14.5%.
The contractual revenue base within the former GWS structure, now largely housed in BOE, is a prime example of a Cash Cow due to its inherent stability. The resilient businesses, which include these management services, showed revenue growth of 14% in the third quarter of 2025. This resilience is further demonstrated by the performance of its core components:
- Facilities Management net revenue grew 24% in Q4 2024, indicating a dominant position in that mature service line.
- Property management revenue saw a 30% increase in Q3 2025.
The stability of these recurring revenue streams provides the necessary cash buffer for CBRE Group, Inc. The core, stable Loan Servicing portfolio ended 2024 at approximately $433 billion. This large, managed portfolio generates predictable fee income, which is a hallmark of a Cash Cow business unit.
To illustrate the scale and stability of these cash-generating units, consider the following financial metrics:
| Metric | Value/Period | Context |
| Loan Servicing Portfolio | $433 billion | Portfolio size as of year-end 2024. |
| Facilities Management Net Revenue Growth | 24% | Year-over-year growth in Q4 2024. |
| BOE Segment Revenue Growth Expectation | 14.5% | Projected growth for 2025. |
| Resilient Businesses Revenue Growth | 14% | Net revenue growth in Q3 2025. |
These units require lower promotional investment because market share is established, allowing capital to be redirected. Investments here focus on infrastructure to improve efficiency, such as technology integration, which helps maintain high profit margins and maximize cash flow extraction.
CBRE Group, Inc. (CBRE) - BCG Matrix: Dogs
Dogs are units or products with a low market share and low growth rates. They frequently break even, neither earning nor consuming much cash. Dogs are generally considered cash traps because businesses have money tied up in them, even though they bring back almost nothing in return. These business units are prime candidates for divestiture.
For CBRE Group, Inc. (CBRE), the Dog quadrant is likely populated by specific, non-core, or highly commoditized service lines where market share is low relative to the overall firm's scale, or where growth has stalled or reversed despite overall company expansion. Expensive turn-around plans usually do not help, so the focus is on minimization or divestiture.
The following areas align with the characteristics of Dogs based on recent performance trends as of late 2025:
- - Legacy, non-prime office-centric property management services, as the flight to quality widens the market divide.
- - Certain underperforming businesses within the BOE segment that CBRE is strategically winding down.
- - Commodity office buildings in less desirable districts, which are most at risk of losing tenants in 2025.
- - The small, lower-margin parts of the business that don't scale well, which are defintely a drag on overall performance.
The most quantifiable evidence of low or negative growth appears in specific advisory services that are not part of the high-growth Resilient Businesses category. For instance, the Loan Servicing business line shows a contraction, which is a clear indicator of a potential Dog, especially when compared to the overall growth seen in other parts of the firm.
Here's a look at the financial metrics for these specific, lower-performing areas as of the third quarter of 2025, contrasted with a segment margin benchmark:
| Business Line/Metric | Latest Reported Value (2025) | Period/Comparison | Context/Note |
|---|---|---|---|
| Loan Servicing Revenue | -2% | Q3 2025 vs Q3 2024 (Same LC) | Explicit revenue decline, suggesting low market share/growth in this specific service. |
| Investment Management Revenue | $144 million | Q2 2025 | Revenue fell year-over-year, driven by absence of significant carried interest. |
| Investment Management Operating Profit | $31 million | Q2 2025 | Down from $39 million in Q2 2024, illustrating profit erosion without incentive fees. |
| BOE Segment Operating Profit on Net Revenue Margin | 8.9% | Q1 2025 | Benchmark margin for the segment containing property management and flexible workspace. |
| Total CBRE Group TTM Revenue | $39.327B | Twelve Months ending September 30, 2025 | Context for overall company scale against which these units are small/low-growth. |
The volatility in the Investment Management segment, specifically the dependence on incentive fees, means that in quarters without large promotes, the unit acts like a Dog, consuming management attention without delivering reliable cash flow. The Q2 2025 Operating Profit of $31 million versus $39 million in the prior year's second quarter highlights this cash-draining potential when the market doesn't deliver large, non-recurring gains.
Furthermore, the description of legacy, non-prime office services being outpaced by the flight to quality suggests that a portion of the overall office service revenue is underperforming significantly, even though the broader leasing segment saw US office revenue up 38% in Q1 2025. This internal disparity is where the Dog resides-the low-quality, low-share assets within a high-growth market segment.
The Loan Servicing revenue slipping 2% in Q3 2025, despite a servicing portfolio up 4% to more than $450 billion, points to margin compression or low-value activity within that portfolio, fitting the low-return profile of a Dog. You need to isolate the revenue tied to these specific, non-growing service lines to accurately assess their cash consumption versus contribution.
CBRE Group, Inc. (CBRE) - BCG Matrix: Question Marks
QUESTION MARKS (high growth products (brands), low market share):
These business units operate in markets showing strong growth prospects but currently hold a relatively low market share for CBRE Group, Inc. They consume cash to fuel expansion, which is typical for new or rapidly scaling ventures.
The following areas represent components that fit the Question Mark profile:
- - Real Estate Investments (REI) Development, which swung to a small $3 million operating profit in Q2 2025 from a loss.
- - The massive development pipeline of $31.7 billion that requires significant capital to convert into profit.
- - REI Investment Management's volatile incentive fees (carried interest), which caused Q3 2025 revenue to fall to $148 million.
- - Flexible office solutions like Industrious, acquired in 2025, which is a high-growth market but still requires capital to solidify market share.
The investment in flexible office solutions through the full acquisition of Industrious in January 2025 signals a commitment to this high-growth area. Industrious's revenue had grown at a compound annual rate of over 50% since 2021, and its footprint reached more than 200 units across over 65 cities before the full acquisition for $400 million. This integration contributed to a 30% year-over-year increase in Property Management revenues in Q3 2025.
The Real Estate Investments segment, which houses both development and investment management, shows the volatility characteristic of Question Marks. For instance, while the overall segment revenue in Q3 2025 was $211 million, the Investment Management component revenue specifically was $148 million due to incentive fee fluctuations. The development pipeline represents a significant capital commitment needing conversion.
Here's a look at the key financial metrics related to the Real Estate Investments segment as of the latest reported periods:
| Metric | Q2 2025 Value | Q3 2025 Value | Context/Component |
| Segment Revenue | $215 million | $211 million | Real Estate Investments Segment |
| Development Operating Profit | $3 million | $35 million | Global Development Component |
| Investment Management Revenue | N/A | $148 million | Investment Management Component |
| Development Pipeline Value | $31.7 billion | N/A | In-Process Projects and Pipeline |
The Real Estate Investments segment swung to an operating profit of $3 million in Q2 2025. This unit is heavily tied to the $31.7 billion development pipeline. For comparison, in Q3 2025, the segment revenue was $211 million, a decrease of 30.1% year-over-year.
The strategy here involves heavy investment to quickly capture market share, especially in areas like flexible office solutions, or divestiture if potential is not realized. The acquisition of the remaining stake in Industrious for $400 million is an example of the investment required in a high-growth area.
Disclaimer
All information, articles, and product details provided on this website are for general informational and educational purposes only. We do not claim any ownership over, nor do we intend to infringe upon, any trademarks, copyrights, logos, brand names, or other intellectual property mentioned or depicted on this site. Such intellectual property remains the property of its respective owners, and any references here are made solely for identification or informational purposes, without implying any affiliation, endorsement, or partnership.
We make no representations or warranties, express or implied, regarding the accuracy, completeness, or suitability of any content or products presented. Nothing on this website should be construed as legal, tax, investment, financial, medical, or other professional advice. In addition, no part of this site—including articles or product references—constitutes a solicitation, recommendation, endorsement, advertisement, or offer to buy or sell any securities, franchises, or other financial instruments, particularly in jurisdictions where such activity would be unlawful.
All content is of a general nature and may not address the specific circumstances of any individual or entity. It is not a substitute for professional advice or services. Any actions you take based on the information provided here are strictly at your own risk. You accept full responsibility for any decisions or outcomes arising from your use of this website and agree to release us from any liability in connection with your use of, or reliance upon, the content or products found herein.