
|
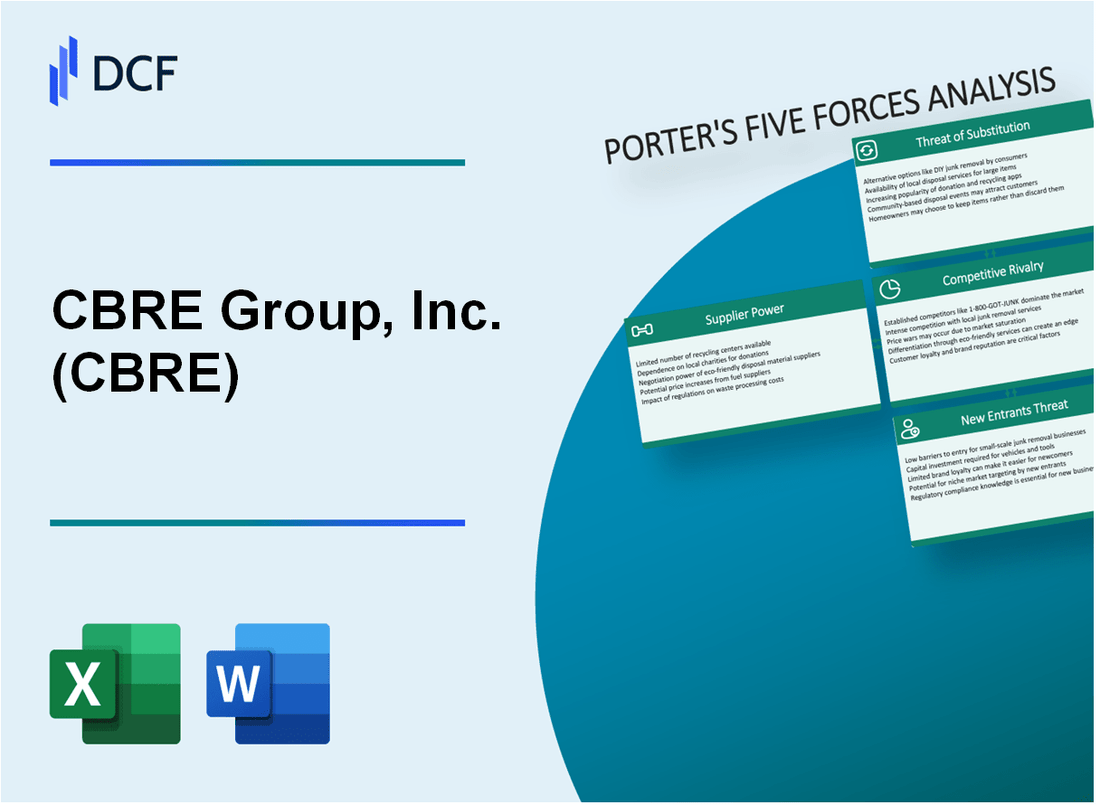
CBRE Group, Inc. (CBRE): 5 FORCES Analysis [Nov-2025 Updated] |
Fully Editable: Tailor To Your Needs In Excel Or Sheets
Professional Design: Trusted, Industry-Standard Templates
Investor-Approved Valuation Models
MAC/PC Compatible, Fully Unlocked
No Expertise Is Needed; Easy To Follow
CBRE Group, Inc. (CBRE) Bundle
You're looking at a massive player in commercial real estate, trying to see past the headlines to where the real leverage is for CBRE Group, Inc. as we hit late 2025. Honestly, after two decades analyzing these giants, I see a firm built on sheer scale-managing over 8 billion square feet and serving 90% of the Fortune 100-but it's not a fortress. The competitive rivalry among the 'Big 4' is still brutal, and while high barriers keep new entrants out, sophisticated customers and rising PropTech are definitely squeezing margins. Let's break down exactly where CBRE has the upper hand and where you need to watch for pressure across all five of Porter's forces below.
CBRE Group, Inc. (CBRE) - Porter's Five Forces: Bargaining power of suppliers
You're analyzing the supplier landscape for CBRE Group, Inc. (CBRE) as of late 2025, and the power held by those providing essential inputs-from janitorial services to specialized software-is a key variable. Honestly, for a firm of this scale, the power of the average supplier is generally kept in check.
The bargaining power of suppliers for CBRE leans toward low to moderate power, primarily because the company manages an incredibly fragmented supply base for its core facilities management services. Think about the sheer volume of vendors CBRE engages with; this scale inherently dilutes the leverage of any single, non-specialized supplier. For instance, CBRE manages a network comprised of over 25,000+ Service Providers across the United States and Canada for its Provider Network alone. Furthermore, looking at the broader scope, CBRE manages spend across nearly 130,000 suppliers, representing almost $40 billion of spend that they can see and manage globally.
This massive scale translates directly into procurement leverage. CBRE's annual maintenance spend, specifically within the Provider Network context, is reported to be around $4 billion. When you control that level of annual outlay, you gain massive procurement leverage in negotiations for standard services like HVAC or electrical work. This buying power allows CBRE to dictate terms, enforce quality standards, and drive cost optimization across its vast portfolio.
However, the dynamic shifts when we look at specialized providers. High-value suppliers, particularly those in the specialized PropTech (Property Technology) and data analytics space-think providers of advanced AI-driven building management software or critical data feeds-have more power. These firms often possess proprietary technology or unique data sets that are essential for CBRE to deliver on its digital transformation promises and meet client demands for efficiency and sustainability in 2025. The strategic investment and partnership CBRE maintains with the PropTech ecosystem suggest these relationships are less transactional and more collaborative, granting these specific suppliers greater influence.
We also see cost pressure rising from the labor supply side. For facilities management, securing skilled trades-plumbers, electricians, specialized HVAC technicians-can increase cost pressure, especially given broader economic factors. For example, in the UK facilities management market in 2025, changes in National Insurance Contributions (NICs) were noted as a factor that could increase prices and reduce job creation. This tight labor market for essential, skilled services means that while CBRE can negotiate hard on volume, the underlying cost of skilled labor remains a significant factor that suppliers can pass through.
Here's a quick look at the scale of the supplier ecosystem:
- Total Spend Managed (Visible): Nearly $40 billion.
- Provider Network Size: Over 25,000+ Service Providers.
- Annual Maintenance Spend: Around $4 billion.
- Total Suppliers Managed: Approximately 130,000.
- Cost Savings Potential: Typical cost savings due to buying power cited as 10-25%.
The power dynamic is best summarized by segmenting the supplier base:
| Supplier Segment | Power Level | Reasoning/Data Point |
|---|---|---|
| General Facilities Services (High Volume) | Low to Moderate | Fragmented base of 25,000+ providers; massive $4 billion maintenance spend leverage. |
| Specialized PropTech/Data Providers | Moderate to High | Possess proprietary, high-value technology essential for digital strategy; strategic partnerships are key. |
| Skilled Labor/Trades | Moderate | Cost pressure from tight labor markets and potential regulatory cost increases. |
Finance: draft 13-week cash view by Friday.
CBRE Group, Inc. (CBRE) - Porter's Five Forces: Bargaining power of customers
You're looking at the power large clients hold over CBRE Group, Inc. (CBRE), and honestly, for the biggest players, that power is definitely present, leaning toward moderate to high. These aren't small tenants; we're talking about the global real estate titans who dictate terms.
The sheer scale of CBRE's enterprise client base is a double-edged sword. On one hand, it shows trust; on the other, it means a significant portion of revenue is concentrated with buyers who know exactly what they want and are highly attuned to pricing. As of the latest filings, CBRE Group, Inc. serves nearly 90% of Fortune 100 companies. These clients are sophisticated; they demand seamless, integrated solutions across their global portfolios, which is where the Global Workplace Solutions (GWS) platform comes into play.
The GWS platform is massive, which should, in theory, increase stickiness, but customers still hold leverage. While the outline suggests GWS manages over 8 billion square feet, the most recent reported figure for GWS facilities management was approximately 4.4 billion square feet as of December 31, 2021. That scale suggests high integration costs for a client to rip out the entire facilities management operation. However, switching costs remain only moderate because the transactional side-leasing and sales-is inherently deal-by-deal. For a single lease renewal or a sale in a secondary market, a client can easily shop around for a better commission rate or a different broker relationship. That transactional nature keeps the pressure on pricing.
To counter this, CBRE Group, Inc. pushes its diversified service model hard, which helps lock in enterprise clients. When a client uses CBRE for advisory, project management, and GWS, the switching cost for the entire relationship rises substantially. Look at the growth in the more contractually-based segments in Q3 2025: Building Operations & Experience revenue was up 12.6%, and Project Management revenue jumped 20.4%. This resilient revenue stream, which is less susceptible to quarterly deal flow volatility, is what keeps the largest customers tethered to the platform.
Here's a quick look at the revenue scale for the segments most relevant to these large buyers as of Q3 2025:
| Segment | Q3 2025 Revenue (Millions USD) | Year-over-Year Growth (Q3 2025 vs Q3 2024) |
| Resilient Businesses (Includes GWS) | $8,400 | 14% |
| Project Management (Part of Resilient) | $2,027 | 20.4% |
| Total Revenue | $10,300 | 14% |
The acquisition of full ownership of Industrious in early January 2025 further diversifies the offering, moving CBRE Group, Inc. deeper into the flexible workspace solutions that large clients now expect as part of an integrated workplace strategy. This integration of services, from managing $10.3 billion in quarterly revenue to providing flexible options, is the primary lever CBRE Group, Inc. uses to manage customer power.
The bargaining power manifests in several key areas for these major customers:
- Demand for fee compression on high-volume transactions.
- Requirement for global service consistency across all regions.
- Negotiation leverage on long-term GWS contract pricing.
- Insistence on advanced data and technology integration.
Finance: draft 13-week cash view by Friday.
CBRE Group, Inc. (CBRE) - Porter's Five Forces: Competitive rivalry
You're looking at a market where the top players are locked in a tight race for global mandates. The rivalry among the 'Big 4' global firms-CBRE Group, Inc., JLL, Cushman & Wakefield, and Colliers-is defintely extremely high. CBRE Group, Inc. holds the title as the largest of the major firms by annual revenue, which gives it a distinct edge when chasing those massive, cross-border assignments.
Competition here isn't just about who can offer the lowest commission; it's a battle fought on global scale, the depth of technology investment, and the sheer breadth of services offered. The market itself is mature, so capturing market share, especially in the transactional services like Capital Markets, means taking it directly from a competitor.
Still, CBRE Group, Inc.'s performance in its stickier services shows its competitive advantages are working. For instance, the Resilient Businesses segment, which includes services like facilities management, saw its revenue grow 14% in Q3 2025 to $8.4 billion. That growth outpaces the 13% growth in the more cyclical Transactional Businesses revenue of $1.9 billion in the same quarter.
Here's a quick look at how the different service lines performed in Q3 2025, showing where the competitive wins are happening:
| Business Segment / Metric | Q3 2025 Value (USD) | Year-over-Year Growth Rate |
| Total Revenue | $10.26 billion | 13.5% |
| Resilient Businesses Revenue | $8.4 billion | 14% |
| Transactional Businesses Revenue | $1.9 billion | 13% |
| Advisory Services Revenue | $2.24 billion | 17% |
| Project Management Segment Revenue | $2.03 billion | 20% |
| Property Management Revenue (within Resilient) | Data Not Specified | 30% |
| Global Property Sales Revenue (within Capital Markets) | Data Not Specified | 30% |
The success in certain areas highlights the focus on scale and service depth. For example, the 30% surge in Property Management revenue and the 30% rise in Global Property Sales revenue in Q3 2025 are direct results of winning mandates where scale matters most.
You can see the competitive strength reflected in the bottom line, too:
- Q3 2025 GAAP net income reached $363 million.
- Core Earnings Per Share (EPS) for Q3 2025 was $1.61, beating estimates of $1.49 by about 10.2%.
- CBRE Group, Inc.'s FY 2025 Core EPS outlook was raised to a range of $6.250 to $6.350.
- The company's Market Cap stood at $46.70 billion as of late 2025.
- The Debt-to-Equity ratio was reported at 0.49.
CBRE Group, Inc. (CBRE) - Porter's Five Forces: Threat of substitutes
The threat of substitutes for CBRE Group, Inc. (CBRE) is best characterized as moderate and rising, primarily fueled by advancements in technology and the increasing capability of clients to perform certain real estate functions themselves. Honestly, you see this pressure across the board, from facilities management to basic transaction support.
Large corporations are definitely taking more control over their physical footprints. Corporate real estate remains the second largest expense for organizations worldwide, right behind salaries, so the incentive to internalize functions is huge. With 92% of organizations now using a hybrid work model, yet average office utilization hovering around just 35%-a 45% decrease from pre-pandemic levels-the pressure to demonstrate ROI on space is intense. This disconnect pushes companies toward internal data-driven portfolio optimization and dynamic space management, which directly substitutes for some of CBRE's advisory and management services.
The PropTech (Property Technology) ecosystem is a major driver of this substitution. Platforms like CoStar Group offer data and listing services that can bypass traditional brokerage for certain segments. To give you a sense of scale, CoStar Group projects its full-year 2025 revenue to be between $3.23 billion and $3.24 billion. Compare that to CBRE's reported revenue of $9.8 billion in Q2 2025. While CBRE is significantly larger, the growth rate of these specialized tech firms is a clear signal. For instance, in Q1 2025, CoStar and LoopNet saw annualized net new bookings increase by 68% and 200% year-over-year, respectively. The overall PropTech market is even projected to reach a $1 trillion market size in 7 to 8 years.
Digital tools and AI-optimized solutions are enabling clients to manage data and building operations directly, which erodes the need for outsourced services in those areas. CBRE itself is actively participating in this trend, notably through its acquisition of flexible workplace solutions provider Industrious, which was valued at $800M. This shows that even CBRE sees the value in integrating tech-driven solutions, which can be seen as both a defense and an acknowledgment of the substitute threat.
Here's a quick look at the revenue comparison between CBRE and a major data/marketplace substitute as of late 2025 projections:
| Entity | Metric | Value (2025) |
|---|---|---|
| CBRE Group, Inc. (CBRE) | Q2 2025 Revenue | $9.8 billion |
| CoStar Group | Projected Full-Year 2025 Revenue | $3.23 billion to $3.24 billion |
| CBRE Group, Inc. (CBRE) | Q1 2025 Revenue | $8.9 billion |
| CoStar Group (Commercial Info/Marketplace) | Q1 2025 Profit Margin | 43% |
However, the threat of substitution remains low for the most complex mandates. You can't easily substitute the global scale and integrated service delivery required for intricate, multi-service, cross-border transactions. While international capital is returning-for example, cross-regional capital flows to Europe increased by 30% year-over-year to US$18.4 billion in H1 2024-executing these deals still requires the deep, on-the-ground expertise and global network that CBRE possesses. The agility of international capital is noted, with cross-regional flows increasing by 20% since the Q1 2024 trough, outpacing domestic capital flows at 13%. Still, the sheer complexity of coordinating large, multi-jurisdictional capital deployment acts as a significant barrier to entry for pure-play technology substitutes.
The key areas where substitution is most potent include:
- Facilities management outsourcing.
- Basic property data and listing services.
- Internal corporate real estate technology adoption.
- Simple, single-market leasing mandates.
Finance: draft 13-week cash view by Friday.
CBRE Group, Inc. (CBRE) - Porter's Five Forces: Threat of new entrants
You're looking at the competitive landscape for CBRE Group, Inc., and when it comes to new players setting up shop, the barriers are steep. Honestly, the threat of new entrants registers as low to moderate, primarily because the capital requirements and operational scale needed to compete at the top tier are massive.
To even attempt to match CBRE Group, Inc.'s scale, a new firm would need immediate access to significant capital, a truly global footprint, and established, deep local market expertise across numerous jurisdictions. Consider the sheer size of the existing operation; CBRE Group, Inc. is the world's largest commercial real estate services and investment company. This scale translates directly into barriers for any startup.
Here's a quick look at the scale that new entrants must overcome:
| Metric | CBRE Group, Inc. Data Point (Late 2025) |
|---|---|
| Assets Under Management (AUM) | $155.8 billion (as of Q3 2025) |
| Global Workforce Size | Over 140,000 employees (including Turner & Townsend) |
| Client Penetration | Serving nearly 90 of the Fortune 100 |
| Capital Markets Access Example | Announced pricing of $750 million Senior Notes due 2033 (Nov 2025) |
The company's established brand recognition and the long-standing, trusted relationships it maintains with major institutional investors act as powerful deterrents. These relationships are built over decades, not quarters. Furthermore, operating globally means navigating a complex web of regulatory requirements and licensing for both real estate brokerage and investment management activities, which is a significant hurdle for any newcomer lacking established compliance infrastructure.
The technological advantage CBRE Group, Inc. possesses also creates a scale moat that is defintely hard to replicate. While the outline suggests 8 billion square feet, our latest data shows the depth of their data utilization in specific studies:
- Technology platform insights are based on data from select clients representing 375 million sq. ft./35 million sq. m. in the 2024-2025 Global Workplace & Occupancy Insights.
- Deep integration of proprietary technology across service lines helps maintain market leadership.
- The need for massive, proprietary data sets to compete effectively in analytics is a huge upfront cost.
Also, the company's strategic moves, like the acquisition of full ownership of Industrious National Management Company LLC in Q1 2025, show they are actively buying capabilities rather than waiting for organic growth, further consolidating their position.
Disclaimer
All information, articles, and product details provided on this website are for general informational and educational purposes only. We do not claim any ownership over, nor do we intend to infringe upon, any trademarks, copyrights, logos, brand names, or other intellectual property mentioned or depicted on this site. Such intellectual property remains the property of its respective owners, and any references here are made solely for identification or informational purposes, without implying any affiliation, endorsement, or partnership.
We make no representations or warranties, express or implied, regarding the accuracy, completeness, or suitability of any content or products presented. Nothing on this website should be construed as legal, tax, investment, financial, medical, or other professional advice. In addition, no part of this site—including articles or product references—constitutes a solicitation, recommendation, endorsement, advertisement, or offer to buy or sell any securities, franchises, or other financial instruments, particularly in jurisdictions where such activity would be unlawful.
All content is of a general nature and may not address the specific circumstances of any individual or entity. It is not a substitute for professional advice or services. Any actions you take based on the information provided here are strictly at your own risk. You accept full responsibility for any decisions or outcomes arising from your use of this website and agree to release us from any liability in connection with your use of, or reliance upon, the content or products found herein.