
|
Capitol Federal Financial, Inc. (CFFN): 5 FORCES Analysis [Nov-2025 Updated] |
Fully Editable: Tailor To Your Needs In Excel Or Sheets
Professional Design: Trusted, Industry-Standard Templates
Investor-Approved Valuation Models
MAC/PC Compatible, Fully Unlocked
No Expertise Is Needed; Easy To Follow
Capitol Federal Financial, Inc. (CFFN) Bundle
As a seasoned analyst, I see Capitol Federal Financial, Inc. (CFFN) making a necessary pivot toward commercial lending, but you need to know the external battlefield is rough. Even with FY 2025 net income hitting $68.0 million on $9.78 billion in assets, the core business is squeezed; for instance, their net interest margin was just 1.96% last year, reflecting pressure from depositors and the $1.95 billion in Federal Home Loan Bank advances they rely on for funding. To truly gauge the risk in this new strategy, we must dissect the five forces-from the high power of digital substitutes threatening their deposit base to the intense local rivalry across their 46 branches-so read on to see the hard numbers behind the strategy.
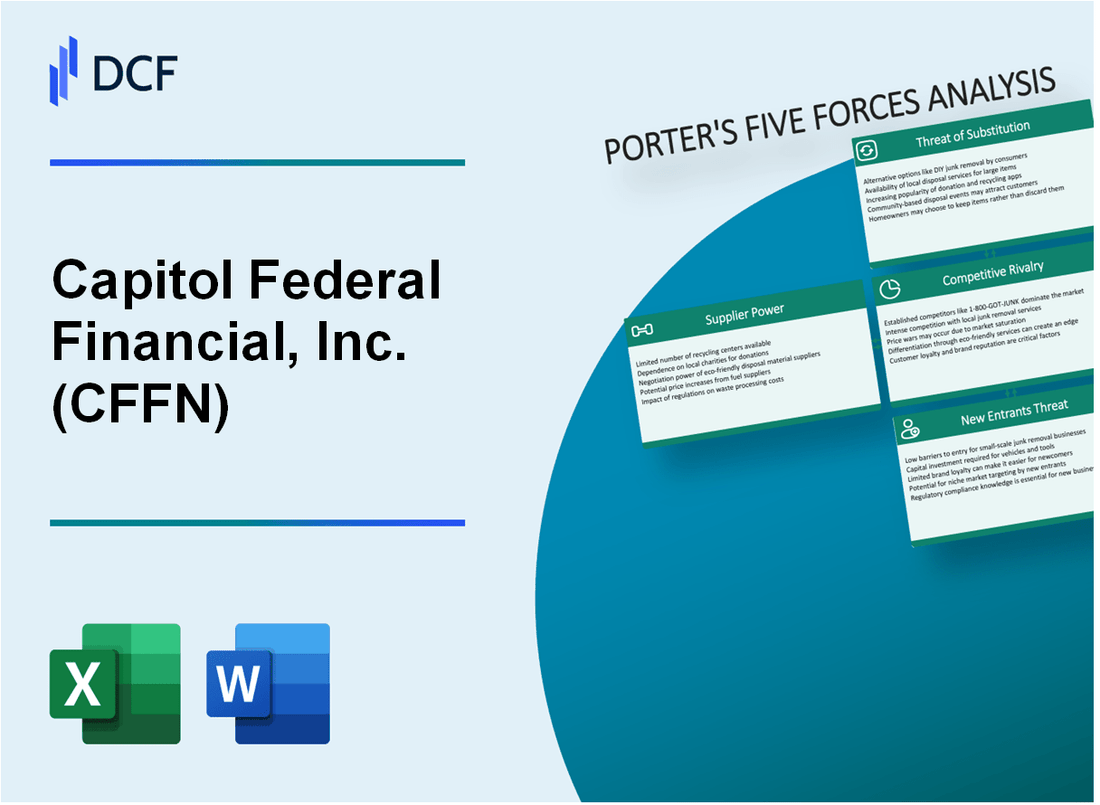
Capitol Federal Financial, Inc. (CFFN) - Porter's Five Forces: Bargaining power of suppliers
The bargaining power of suppliers for Capitol Federal Financial, Inc. (CFFN) is shaped by the critical nature of funding sources and technology infrastructure. For a regional thrift like Capitol Federal Savings Bank, the primary suppliers are providers of capital (depositors and wholesale lenders) and core service/technology vendors.
Core technology providers hold high power due to costly switching and long-term contracts. While specific contract details are proprietary, the reliance on a stable, compliant core operating system means that the cost and disruption associated with migrating to a new platform are substantial, giving existing vendors leverage in negotiations and pricing.
Federal Home Loan Bank advances totaled $1.95 billion as of September 30, 2025, a key funding source. This figure represents a significant portion of the Bank's overall funding structure, indicating a reliance on the FHLB system, which, while regulated, still dictates terms for accessing these advances.
Wholesale funding markets dictate terms for non-deposit funding, limiting CFFN's margin flexibility. The ability of Capitol Federal Financial, Inc. to manage its Net Interest Margin (NIM) is directly tied to the cost it pays for non-deposit funding. The NIM for the fiscal year ended September 30, 2025, was reported at 1.96%, an improvement from 1.77% in fiscal year 2024. This margin expansion suggests that, for the moment, CFFN is managing the cost of its funding sources effectively, but the underlying market terms remain a constraint.
Retail depositors demand competitive rates, increasing the cost of funds for the bank. The focus on deposit growth, with commercial deposits increasing by 59.8% from September 30, 2024, shows an active effort to secure cheaper, more stable funding. Still, the cost of these deposits directly pressures the NIM. For instance, the NIM for the quarter ended September 30, 2025, was 2.09%, up from 1.98% the prior quarter, driven by a higher-yielding loan portfolio that outpaced deposit cost increases.
Here's a quick look at the scale and key funding metrics as of the end of fiscal year 2025:
| Metric | Amount/Value | Date/Period |
|---|---|---|
| Total Assets | $9.78 billion | September 30, 2025 |
| Federal Home Loan Bank Advances | $1.95 billion | September 30, 2025 |
| Net Income (FY) | $68.0 million | Fiscal Year 2025 |
| Net Interest Margin (Annual) | 1.96% | Fiscal Year 2025 |
| Net Interest Margin (Quarterly) | 2.09% | Quarter Ended September 30, 2025 |
The supplier power dynamic is also visible in the focus on deposit mix shift. Capitol Federal Financial, Inc. is actively trying to change its funding composition:
- Commercial deposits grew by $190.2 million, or 40.2%, during the fiscal year.
- The bank is focused on growing the commercial deposit base to lower the overall cost of funds.
- High-yield savings balances reached $171.7 million as of December 31, 2024, showing tactical pricing was used to attract deposits.
- The company intends to pay a regular quarterly cash dividend of $0.085 per share in fiscal 2026.
Capitol Federal Financial, Inc. (CFFN) - Porter's Five Forces: Bargaining power of customers
You're looking at Capitol Federal Financial, Inc. (CFFN) through the lens of customer power, and honestly, it's a mixed bag depending on which customer segment you're watching. The power dynamic shifts significantly between your commercial borrowers, your mortgage holders, and your retail depositors.
Commercial loan clients, a new focus area for Capitol Federal Financial, Inc., definitely wield high power. This is evident because the bank is actively tailoring its offerings to meet their needs, such as expanding treasury management services, trust, and wealth management, supported by new digital products. This strategic pivot is designed to capture a broader share of these clients' financial needs. The growth in this segment is substantial; since the Capital City Bank acquisition, the commercial loan portfolio has ballooned from $319.1 million to $2.12 billion. This growth shows Capitol Federal Financial, Inc. is competing hard for these relationships, which implies clients have leverage to demand customized services.
For residential mortgage customers, the power dynamic is often centered on rate shopping for refinancing or new originations. While I don't have a specific dollar amount for CFFN's customer switching costs, the strategic shift in the loan book itself speaks volumes. Capitol Federal Financial, Inc. has been actively moving loan balances from the one- to four-family loan portfolio to the higher yielding commercial loan portfolio. This suggests that the competition in the residential mortgage space, driven by customer mobility, is a key factor influencing asset allocation strategy.
| Metric | Value | Context/Date |
| Fiscal Year 2025 Net Interest Margin (NIM) | 1.96% | Reflects pressure from funding costs outpacing loan yield increases in the full year. |
| Commercial Loan Portfolio (Post-Acquisition) | $2.12 billion | Growth from $319.1 million, showing strategic focus. |
| One- to Four-Family Loan Portfolio | Decreasing Share | Loan balances shifted to commercial for higher yield. |
| Q3 Fiscal Year 2025 NIM | 2.09% | Highest reported NIM in recent quarters, driven by commercial growth. |
Retail deposit customers have significant power because they can easily move funds to higher-yielding money market or FinTech accounts. This mobility puts direct pressure on Capitol Federal Financial, Inc.'s funding costs. We see evidence of this pressure in the full fiscal year 2025 results, where the 1.96% net interest margin reflects the fact that the increase in the cost of deposits, particularly retail certificates of deposit, was a factor that the higher loan yields had to outpace. Industry-wide data for 2025 shows that overall CDs are down -3.5% year-to-date, and checking accounts are down -1.3%, indicating customers are actively managing their balances in search of better returns.
Here are a few key indicators showing where customer power is most felt:
- Commercial clients demand tailored treasury services.
- Retail deposit runoff is a persistent cost pressure.
- CD balances are down -3.5% in 2025.
- The strategic pivot favors commercial loans over residential.
The bank's response, like growing its commercial book and managing deposit costs, is a direct reaction to these customer forces. Finance: draft 13-week cash view by Friday.
Capitol Federal Financial, Inc. (CFFN) - Porter's Five Forces: Competitive rivalry
You're analyzing Capitol Federal Financial, Inc. (CFFN) in a market where local presence still matters, but the competition is anything but sleepy. The rivalry force is definitely high because Capitol Federal Savings Bank operates 46 branch locations across Kansas and Missouri. These branches face direct competition from larger regional and national banks that have deeper pockets for marketing and technology investment.
The strategic pivot toward commercial lending, which is CFFN's target growth area, puts the bank right in the crosshairs of established commercial lenders. This is not a quiet segment; it's where the big players focus their relationship managers. Capitol Federal Financial is actively trying to keep pace, for instance, by integrating competitor pricing analytics into its loan models during fiscal 2025 to ensure its offerings are sharp. The growth in this segment is clear: the commercial loan portfolio saw significant expansion, moving from $319.1 million to $2.12 billion as of the Q4 2025 reporting period.
Operational efficiency is a key battleground in this rivalry. For the quarter ended June 30, 2025, Capitol Federal Financial reported an efficiency ratio of 58.26%. While this figure is better than some peers-for example, it improved from 60.54% in the prior quarter-it doesn't mean the competitive pressure lets up. Rivalry remains high because every basis point saved on non-interest expense is crucial when competing on price and service quality.
Furthermore, the entire regional banking sector is under acute investor scrutiny following incidents involving other mid-tier banks in October 2025, raising fears about credit quality and underwriting standards. This external pressure translates directly into price-based competition for funding, especially deposits. To manage this, Capitol Federal Financial is focused on driving growth in commercial deposits, which management anticipates will help lower the overall cost of funds.
Here are some key metrics showing the competitive environment and CFFN's performance:
| Metric | Value/Context | Reporting Period/Date |
|---|---|---|
| Branch Count | 46 | Fiscal 2025 |
| Efficiency Ratio (Latest Reported) | 58.26% | Quarter ended June 30, 2025 |
| Commercial Loan Portfolio Size | From $319.1 million to $2.12 billion | Context of Q4 2025 Results |
| Net Interest Margin (NIM) | 2.09% (Q4 2025) vs. 1.98% (Q3 2025) | Sequential Quarters, FY2025 |
| Investor Sentiment Driver | Acute scrutiny on regional banks due to loan loss reports | October 2025 |
The competitive response from Capitol Federal Financial involves specific actions to maintain and grow its market share:
- Aligning technology and personnel for commercial banking expansion.
- Launching new digital platforms for small business account onboarding.
- Focusing on treasury management and private banking product offerings.
- Using software to price commercial loans based on full customer profitability.
The bank is actively trying to outmaneuver rivals by improving its service delivery and product suite.
Finance: draft 13-week cash view by Friday.
Capitol Federal Financial, Inc. (CFFN) - Porter's Five Forces: Threat of substitutes
You're looking at Capitol Federal Financial, Inc.'s recent success-net income hitting $68.0 million in Fiscal Year 2025, a huge jump from $38.0 million the year prior-and wondering how long that momentum can last against the tide of non-traditional finance. The threat of substitutes is very real for a regional bank like Capitol Federal Financial, Inc., because the core services you offer-lending and taking deposits-are being unbundled and offered by entities with fundamentally different cost structures.
Shadow banking and private credit funds substitute traditional bank lending for commercial clients. This isn't just a small corner of the market anymore; it's a significant parallel system. These non-depository institutions, often referred to as private credit, are aggressively pursuing yield, which means they are willing to take on credit risks that might make a traditional, heavily regulated lender pause. This competition directly pressures the commercial loan growth Capitol Federal Financial, Inc. has been successfully pursuing, which saw its commercial portfolio grow from $319.1 million to $2.12 billion post-acquisition. The sheer scale of this movement is what's concerning.
FinTech firms offer deposit and payment services with superior digital platforms and lower overhead. They don't have the branch network costs that Capitol Federal Financial, Inc. carries, allowing them to potentially offer more competitive rates on deposits or faster, cheaper payment processing. This puts pressure on your non-interest income lines and your cost of funds, even though your Net Interest Margin (NIM) improved to 1.96% in FY 2025. When you look at the overall financial landscape, the growth rate of non-depository financial institutional lending has been averaging 26% annually since 2012 as of Q1 2025, showing the pace of substitution.
Direct-to-consumer online mortgage lenders bypass the traditional branch-based model completely. For a bank whose loan portfolio still has about 74.8% dedicated to 1-4 family residential real estate, this is a direct threat to your bread-and-butter business. In the $10 trillion U.S. residential mortgage market, these shadow banks have been originating more than half of all new loans annually since 2017. If Capitol Federal Financial, Inc. can't compete on speed or digital experience, those loan origination volumes will continue to flow elsewhere.
The recent surge in net income to $68.0 million in FY 2025 is defintely threatened by these low-cost substitutes. It shows management is executing well right now, but the structural shift in finance means the competitive landscape is getting tougher, not easier. Here's a quick look at how Capitol Federal Financial, Inc.'s scale compares to the size of the substitute market activity:
| Metric | Capitol Federal Financial, Inc. (FY 2025) | Substitute Market Context (Latest Available Data) |
|---|---|---|
| Net Income | $68.0 million | N/A (Focus is on CFFN's performance) |
| Total Assets | $9.78 billion | N/A |
| Commercial Loan Portfolio Size | $2.12 billion | Shadow banking lending growth: Avg. 26% annually since 2012 (as of Q1 2025) |
| Residential Mortgage Origination Share | Part of $8.02 billion total loans (Q3 FY2025) | Shadow banks originate over half of new loans in the $10 trillion U.S. residential mortgage market |
| Efficiency Ratio | 58.33% | FinTechs benefit from lower overhead due to lack of physical branches. |
The nature of these substitutes means they often operate with less regulatory burden, which translates directly into a lower cost of operation, putting downward pressure on the margins Capitol Federal Financial, Inc. can earn. You need to watch these trends closely because they erode the traditional moat around banking services.
The key pressure points from these substitutes include:
- Regulations push businesses away from traditional banks.
- Investors seek higher yields outside of bank deposits.
- Technology enables non-banks to offer superior platforms.
- Online lenders completely bypass the branch model.
- Private credit underwriting standards can be looser.
If onboarding takes 14+ days for a digital mortgage application from a non-bank, customer churn risk rises for traditional lenders. Still, Capitol Federal Financial, Inc.'s ability to grow its commercial portfolio shows it can compete in certain segments, but the overall trend favors the leaner, more specialized substitutes.
Finance: draft a sensitivity analysis on NIM compression if deposit competition from FinTechs increases by 50 basis points over 18 months.
Capitol Federal Financial, Inc. (CFFN) - Porter's Five Forces: Threat of new entrants
You're analyzing the barriers to entry for new competitors looking to challenge Capitol Federal Financial, Inc. The landscape for new banks is still heavily tilted in favor of incumbents like Capitol Federal Financial, Inc., but the digital space presents a different kind of challenge.
Regulatory hurdles and capital requirements for new traditional banks are extremely high, limiting traditional entry. Starting a new commercial bank requires significant upfront capital and navigating a complex, multi-agency approval process. For instance, for large, established holding companies, the minimum Common Equity Tier 1 (CET1) capital ratio requirement stands at 4.5 percent. This high floor immediately filters out most small-scale or undercapitalized entrants seeking to establish a full-service physical footprint.
Digital-only FinTech banks face lower capital barriers and are a constant, low-cost threat. While they may not seek a full bank charter immediately, their ability to offer streamlined digital services without the overhead of physical branches means they can enter specific product lines-like high-yield savings or specific lending niches-with a lower cost structure. This low-cost, agile entry keeps pressure on Capitol Federal Financial, Inc.'s margins, especially on deposit-gathering efforts.
Capitol Federal Financial, Inc.'s total assets of $9.78 billion place it in a size category less attractive for large-scale M&A entry. While not small, this size means it's often too large for a quick, cheap 'bolt-on' acquisition by a small regional player, but too small to be a primary target for the largest national banks looking for massive scale. Here's a quick look at how capital requirements stack up for the big players versus the general environment:
| Metric | Large Bank Requirement (Example) | CFFN Asset Size (FY2025 End) |
|---|---|---|
| Minimum CET1 Capital Ratio | 4.5% | N/A (Not a G-SIB) |
| Enhanced Supplementary Leverage Ratio (eSLR) for Subsidiaries | 4% (Finalized Rule) | $9.78 Billion |
| Community Bank Asset Threshold (OCC Definition) | Up to $30 Billion | Below Threshold |
The OCC's recent move to reduce regulatory burden for community banks could slightly lower the entry barrier for smaller, niche players. Effective January 1, 2026, the OCC is eliminating fixed examination requirements for community banks, defined as institutions with assets up to $30 billion. Furthermore, the OCC proposed reducing the community bank leverage ratio requirement from 9% to 8%.
These regulatory adjustments, while aimed at existing institutions, signal a slight easing in the compliance cost structure for any new entity that qualifies as a community bank. Still, the initial chartering process remains a significant hurdle. New entrants must contend with:
- Significant initial capital investment.
- Lengthy approval timelines for charters.
- The need to establish trust and a deposit base.
- Competition from established digital providers.
If onboarding for a new charter takes 14+ months, the opportunity cost rises defintely.
Finance: draft 13-week cash view by Friday.
Disclaimer
All information, articles, and product details provided on this website are for general informational and educational purposes only. We do not claim any ownership over, nor do we intend to infringe upon, any trademarks, copyrights, logos, brand names, or other intellectual property mentioned or depicted on this site. Such intellectual property remains the property of its respective owners, and any references here are made solely for identification or informational purposes, without implying any affiliation, endorsement, or partnership.
We make no representations or warranties, express or implied, regarding the accuracy, completeness, or suitability of any content or products presented. Nothing on this website should be construed as legal, tax, investment, financial, medical, or other professional advice. In addition, no part of this site—including articles or product references—constitutes a solicitation, recommendation, endorsement, advertisement, or offer to buy or sell any securities, franchises, or other financial instruments, particularly in jurisdictions where such activity would be unlawful.
All content is of a general nature and may not address the specific circumstances of any individual or entity. It is not a substitute for professional advice or services. Any actions you take based on the information provided here are strictly at your own risk. You accept full responsibility for any decisions or outcomes arising from your use of this website and agree to release us from any liability in connection with your use of, or reliance upon, the content or products found herein.