|
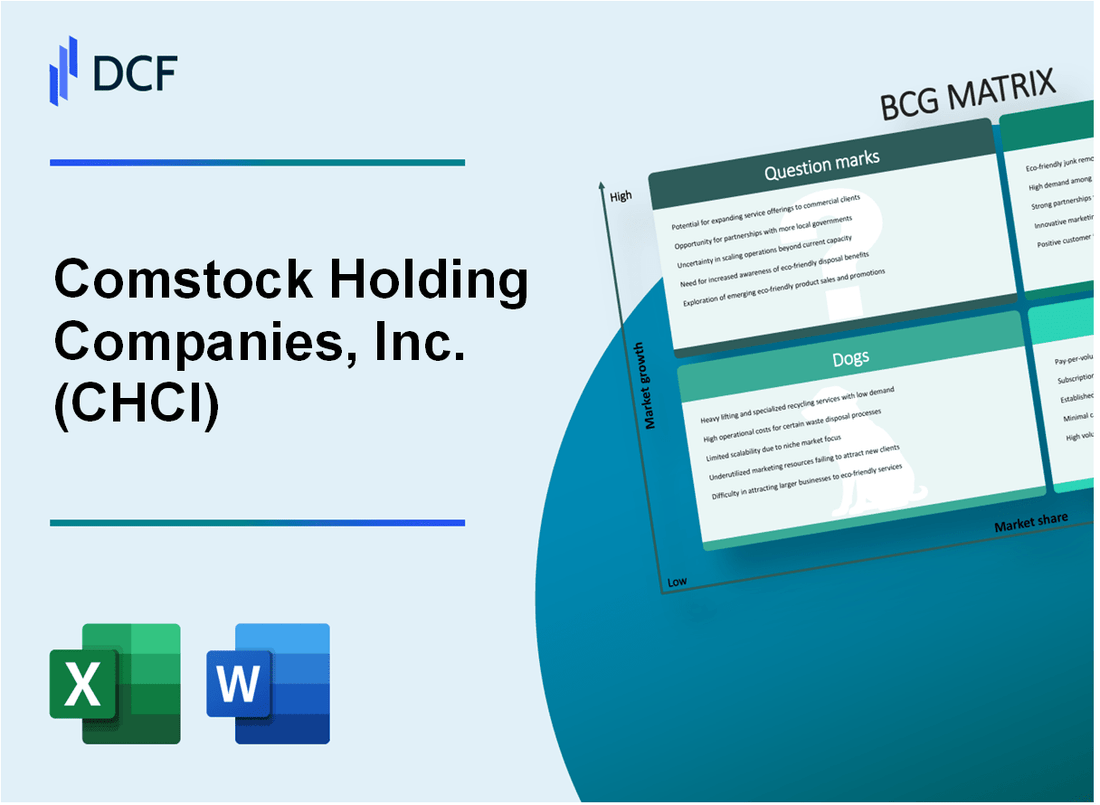
Comstock Holding Companies, Inc. (CHCI): BCG Matrix [Apr-2026 Updated] |
Fully Editable: Tailor To Your Needs In Excel Or Sheets
Professional Design: Trusted, Industry-Standard Templates
Investor-Approved Valuation Models
MAC/PC Compatible, Fully Unlocked
No Expertise Is Needed; Easy To Follow
Comstock Holding Companies, Inc. (CHCI) Bundle
You're looking at Comstock Holding Companies, Inc. (CHCI) at the end of 2025, and the picture is one of deliberate transformation, moving away from pure ownership toward fees. We've mapped their business units using the BCG Matrix, revealing a dynamic where the rapidly scaling ParkX subsidiary is clearly a Star, growing 63.8% year-over-year, while the core Asset Management segment acts as the reliable Cash Cow, bringing in 49.2% of Q3 revenue. Still, this shift creates pressure, with high ParkX expansion costs dragging down near-term earnings, and massive new developments sitting as Question Marks awaiting conversion. Let's break down exactly where Comstock is investing, harvesting, and what might be a Dog in this new structure.
Background of Comstock Holding Companies, Inc. (CHCI)
You're looking at Comstock Holding Companies, Inc. (CHCI), which is a key player in the Washington, D.C. metropolitan area real estate scene, focusing heavily on mixed-use and transit-oriented properties, especially in Northern Virginia's Dulles Corridor. The company started way back in 1985 and officially became incorporated in Delaware in 2004. Honestly, their business model is what sets them apart; they run an asset-light, debt-free operation, which is a big deal in this sector.
CHCI makes its money primarily through recurring fee-based revenues generated from long-term agreements. They operate through four main real estate subsidiaries, including CHCI Asset Management, LC ("CAM"), CHCI Residential Management, LC, CHCI Commercial Management, LC, and Park X Management, LC. You should know that as of their latest reports, Comstock Holding Companies, Inc. maintains zero debt, giving them significant financial flexibility.
Let's look at the numbers through the third quarter of fiscal year 2025. For the nine months ended September 30, 2025, total revenue hit $38.9 million, which is a 13% jump year-over-year, marking their 27th consecutive quarter of year-to-date revenue growth. That recurring, fee-based revenue stream is really humming, with property management subsidiaries showing a 30% increase for the quarter and up 37% year-to-date.
The ParkX subsidiary, which handles parking and new services, is growing fast. For the three months ended September 30, 2025, ParkX Management made up 29.1% of total revenue, while Asset Management brought in 49.2%, and Property Management contributed 21.7%. ParkX third-party revenue specifically was up 126% year-to-date, driven by securing 17 new third-party contracts through Q3.
Operationally, the portfolio is expanding. As of Q3 2025, the managed portfolio stood at 91 assets. Their existing commercial portfolio was 93% leased, and the residential portfolio was 96% leased. You'll want to watch their development pipeline, too; they delivered the JW Marriott Reston Station and the JW Marriott Residences in 2025. Plus, the 1870 Reston Row Plaza, a 254,000 sqft. Trophy-class office tower, is set for delivery in Q425 and is already fully leased.
To support new service offerings, like a porter/janitorial service, ParkX had to hire 139 new employees in Q3 2025. This investment in headcount, while impacting short-term profitability-Adjusted EBITDA for Q3 was $1.1 million-is designed to secure further fee-based revenue streams starting in Q425 and beyond. Finance: draft the Q4 2025 cash flow projection by next Tuesday.
Comstock Holding Companies, Inc. (CHCI) - BCG Matrix: Stars
You're looking at the engine driving current growth for Comstock Holding Companies, Inc. (CHCI), which, under the BCG framework, clearly positions the ParkX Management subsidiary as a Star. This unit operates in a high-growth service market, showing strong market share gains, even as it demands significant investment to sustain that trajectory.
The sheer velocity of ParkX's third-party revenue growth is what lands it in this quadrant. For the nine months year-to-date (YTD) ending September 30, 2025, third-party revenue from ParkX surged by an impressive 126%. This rapid market share acquisition in a growing service space is the hallmark of a Star; it's winning now, but it needs fuel to keep winning.
Here's a quick look at the key operational and financial metrics defining the ParkX Star segment for the third quarter of 2025:
- ParkX Management subsidiary Q3 2025 revenue growth was reported at 59% year-over-year.
- Third-party ParkX revenue showed a 96% increase versus the prior year for the quarter.
- The subsidiary added 139 new hires in Q3 2025 to support expansion.
- The segment contributed approximately 29.1% of total Q3 2025 revenue, based on reported figures.
The investment required to maintain this Star status is evident in the Q3 headcount increase. Comstock Holding Companies, Inc. added 139 new employees in Q3 2025 specifically to staff the expansion into new service lines, such as porter and janitorial services. This was to support 12 new porter and janitorial contracts set to commence in Q4, building on 10 previously secured contracts.
To give you a clearer picture of the segment's financial weight in the quarter, here's how the revenue breaks down:
| Metric | Value (Q3 2025) |
| Total Company Revenue | $13.32 million |
| ParkX Parking Management Revenue | $3.87 million |
| ParkX Third-Party Revenue YoY Growth (Q3) | 96% |
| ParkX Third-Party Revenue YTD Growth | 126% |
| New Hires for Service Expansion (Q3) | 139 |
This investment, while heavy-contributing to a sharp drop in net income to $0.541 million from $2.38 million year-over-year in Q3 2025-is strategic. It's the cash burn necessary to keep the market share high. If Comstock Holding Companies, Inc. can sustain this success as the overall market growth rate for these services eventually slows, ParkX is defintely positioned to transition into a Cash Cow.
The growth is also supported by the broader fee-based revenue streams that ParkX bolsters. Recurring, fee-based revenue from property management subsidiaries, which includes ParkX, increased 30% year over year in Q3 2025. Also, supplemental fee revenue advanced 35% compared to the prior year.
Comstock Holding Companies, Inc. (CHCI) - BCG Matrix: Cash Cows
You're looking at the core engine of Comstock Holding Companies, Inc. (CHCI), the business units that generate more cash than they consume, fitting the Cash Cow profile perfectly. These are the market leaders in mature segments, demanding minimal promotional spend while funding the rest of the enterprise.
The Asset Management segment stands out as the largest revenue source, representing 49.2% of Comstock Holding Companies, Inc.'s total Q3 2025 revenue. This segment brought in $6.56 \text{ million}$ in revenue for the third quarter of 2025.
Here's a quick look at the Q3 2025 financial snapshot that supports this strong cash generation:
| Metric | Q3 2025 Value | Year-to-Date (YTD) Value |
|---|---|---|
| Total Revenue | $13.3 \text{ million}$ | $38.9 \text{ million}$ |
| Net Income | $0.5 \text{ million}$ | $3.6 \text{ million}$ |
| Adjusted EBITDA | $1.1 \text{ million}$ | $5.3 \text{ million}$ |
The stability comes from the recurring, fee-based revenue streams derived from the managed portfolio of assets. This is the bedrock you want in a Cash Cow, providing predictability even when development cycles slow down. You see this strength in the year-over-year growth of these core services.
The growth in these fee-based streams is impressive:
- Recurring, fee-based property management services revenue increased 37% year-to-date in 2025.
- ParkX subsidiary third-party revenue saw a 126% increase year-to-date.
- ParkX added 17$ new third-party contracts year-to-date in 2025.
- Comstock Holding Companies, Inc. has achieved YTD revenue growth for the 27th$ consecutive quarter.
The underlying real estate portfolio shows high utilization, which directly translates to consistent cash flow. These high occupancy rates mean less vacancy drag and more reliable management fees flowing in. Honestly, these numbers suggest the underlying assets are highly desirable in their market.
Consider the current leasing status of the stabilized portfolio:
- Residential managed portfolio is 96% leased as of Q3 2025.
- Stabilized Commercial managed portfolio is 93% leased as of Q3 2025.
- Commercial leasing year-to-date reached $\text{more than } \mathbf{500,000 \text{ sqft}$ executed.
The Anchor Portfolio, which includes major mixed-use, transit-oriented developments like Reston Station and Loudoun Station, provides this consistent, low-risk cash flow stream. The recent delivery of significant assets, such as the JW Marriott Reston Station and the JW Marriott Residences Reston Station, immediately adds to these fee-based revenue streams. The asset management agreement covering these properties extends through 2035$.
Comstock Holding Companies, Inc. (CHCI) - BCG Matrix: Dogs
Dogs, in the Boston Consulting Group framework, represent business units or assets with low market share in low-growth markets. These units tie up capital without generating significant returns, making them candidates for divestiture or minimization. For Comstock Holding Companies, Inc. (CHCI), the characteristics aligning with this quadrant reflect near-term financial drags and assets that do not fit the core strategic direction.
The immediate short-term drag on profitability is evident in the third quarter of 2025 results. Net Income for Q3 2025 was $0.5 million, a substantial drop from the $2.4 million reported in Q3 2024. This sharp decline in bottom-line performance signals that certain operations or asset classes are consuming resources disproportionately to their current contribution.
A primary driver for increased operating costs, which pressures net income, is the investment into the ParkX expansion. This expansion involves significant payroll and onboarding expenses to staff new service offerings. Specifically, Comstock Holding Companies, Inc. added 139 new employees in Q3 2025 to support 12 new porter and janitorial service contracts scheduled to begin in Q4, building on 10 previously secured contracts. The net increase in personnel-related expenses was substantial, with one report noting a $4.4 million net increase in personnel expenses overall, of which $2.9 million was directly tied to payroll and onboarding for 221 additional ParkX employees across the year-to-date period.
The strategic pivot toward a debt-free, asset-light business model, established around 2018-2019, inherently flags older, non-core real estate assets or properties that are not transit-oriented as potential Dogs. These assets may require capital expenditure or management focus that detracts from the high-growth, fee-based service subsidiaries like ParkX. The strategy prioritizes maximizing fee-based revenue from the managed portfolio over direct ownership of lower-yielding assets.
When segmenting the Q3 2025 total revenue of $13.32 million, the Property Management segment stands out as the smallest recurring revenue contributor. While recurring, its growth profile is less explosive than the ParkX subsidiary. The relative size of the segments in Q3 2025 illustrates this distribution:
| Segment | Q3 2025 Revenue (Millions USD) | Percentage of Total Revenue |
| Asset Management | $6.56 | 49.25% |
| Parking Management (ParkX) | $3.87 | 29.05% |
| Property Management | $2.89 | 21.70% |
| Total Revenue | $13.32 | 100.00% |
The Property Management segment's $2.89 million in revenue represents 21.7% of the total, which contrasts with the ParkX subsidiary's third-party revenue, which saw a 96% increase for the quarter. This disparity in growth rate suggests that assets or operations falling under the Property Management umbrella, if not strategically aligned with transit-oriented development, fit the low-growth profile of a Dog.
The implications for these units are clear based on the Dog strategy:
- Avoidance of expensive turn-around plans for these lower-share, low-growth areas.
- Prime candidates for divestiture to free up capital.
- Minimizing cash consumption to support high-growth areas.
The current financial reality shows a sharp decline in profitability, which is the direct result of investing heavily in the growth engine (ParkX) while legacy or non-core operations remain a drag. Finance: draft 13-week cash view by Friday.
Comstock Holding Companies, Inc. (CHCI) - BCG Matrix: Question Marks
You're looking at Comstock Holding Companies, Inc. (CHCI) assets that are in high-growth markets but haven't yet captured significant market share-the classic Question Marks. These are the developments that demand cash now to secure future dominance.
The Row at Reston Station Phase II assets, including the JW Marriott luxury hotel and the luxury condos, just delivered in the third quarter of 2025. This delivery is the core of the current Question Mark status: massive growth potential realized in a high-demand market, but the revenue from the completed sales is still being recognized, meaning current financial returns are low relative to the investment.
Specifically regarding the residential component, condominium pre-sales generated approximately $78 million to date, representing massive future potential but low current revenue contribution as closings ramp up. By the end of Q3 2025, the JW Marriott Residences condo sales had reached nearly $90 million cumulatively, with $20 million of that amount closing in September alone. The hotel component, the JW Marriott Reston Station, opened with 40,000 square feet of luxury event space, which immediately began securing contracts for 2025 and 2026, showing the high demand in this growing segment.
The broader picture for Comstock Holding Companies, Inc. (CHCI) is the development pipeline, which currently includes nearly 10 million square feet of commercial and residential assets at full build-out. These projects require significant capital investment and management focus to convert this potential into high market share, which is why they consume cash while their market share is still being established.
Here's a quick look at the Q3 2025 financial context surrounding these high-investment assets:
| Metric | Value (Q3 2025) | YTD 2025 Value |
| Total Revenue | $13.3 million | $38.9 million |
| Net Income | $0.5 million | $3.6 million |
| Adjusted EBITDA | $1.1 million | $5.3 million |
| ParkX Headcount Added in Q3 | 139 employees | N/A |
To move these Question Marks into the Star quadrant, Comstock Holding Companies, Inc. (CHCI) must execute on converting this pipeline. The strategy hinges on aggressive investment to capture market share quickly.
- The total managed portfolio at full build-out is projected to total 68 assets.
- The pipeline includes 5 commercial assets representing approximately 1.5 million square feet.
- The pipeline includes 6 residential assets with 2,599 units representing approximately 2.8 million square feet.
- The ParkX subsidiary saw a 96% increase in third-party revenue in Q3 versus the prior year.
- Stabilized commercial portfolio occupancy stood at 93% as of Q3 2025.
These assets are in a high-growth market, but their current low market share means they are cash-consuming until leasing and sales velocity accelerates significantly. Finance: draft the capital allocation plan for the next 18 months focusing on pipeline conversion milestones by next Wednesday.
Disclaimer
All information, articles, and product details provided on this website are for general informational and educational purposes only. We do not claim any ownership over, nor do we intend to infringe upon, any trademarks, copyrights, logos, brand names, or other intellectual property mentioned or depicted on this site. Such intellectual property remains the property of its respective owners, and any references here are made solely for identification or informational purposes, without implying any affiliation, endorsement, or partnership.
We make no representations or warranties, express or implied, regarding the accuracy, completeness, or suitability of any content or products presented. Nothing on this website should be construed as legal, tax, investment, financial, medical, or other professional advice. In addition, no part of this site—including articles or product references—constitutes a solicitation, recommendation, endorsement, advertisement, or offer to buy or sell any securities, franchises, or other financial instruments, particularly in jurisdictions where such activity would be unlawful.
All content is of a general nature and may not address the specific circumstances of any individual or entity. It is not a substitute for professional advice or services. Any actions you take based on the information provided here are strictly at your own risk. You accept full responsibility for any decisions or outcomes arising from your use of this website and agree to release us from any liability in connection with your use of, or reliance upon, the content or products found herein.