
|
Comstock Holding Companies, Inc. (CHCI): Marketing Mix Analysis [Dec-2025 Updated] |
Fully Editable: Tailor To Your Needs In Excel Or Sheets
Professional Design: Trusted, Industry-Standard Templates
Investor-Approved Valuation Models
MAC/PC Compatible, Fully Unlocked
No Expertise Is Needed; Easy To Follow
Comstock Holding Companies, Inc. (CHCI) Bundle
You're looking for the real story behind Comstock Holding Companies, Inc.'s market positioning as we head into late 2025, and honestly, the pivot to recurring revenue is the headline. Forget the old development model; the current 4Ps show a company leaning hard into services, where Asset Management made up 49.2% of Q3 revenue and fee-based income jumped 30% year-over-year to hit $13.3 million in total Q3 revenue. We've mapped out exactly how their Product focus, Place in the D.C. metro area, Promotion of high occupancy (93% leased), and Price structure-all built on that asset-light, fee-based engine-are shaping up right now. Dive in below for the precise breakdown you need to understand their current valuation drivers.
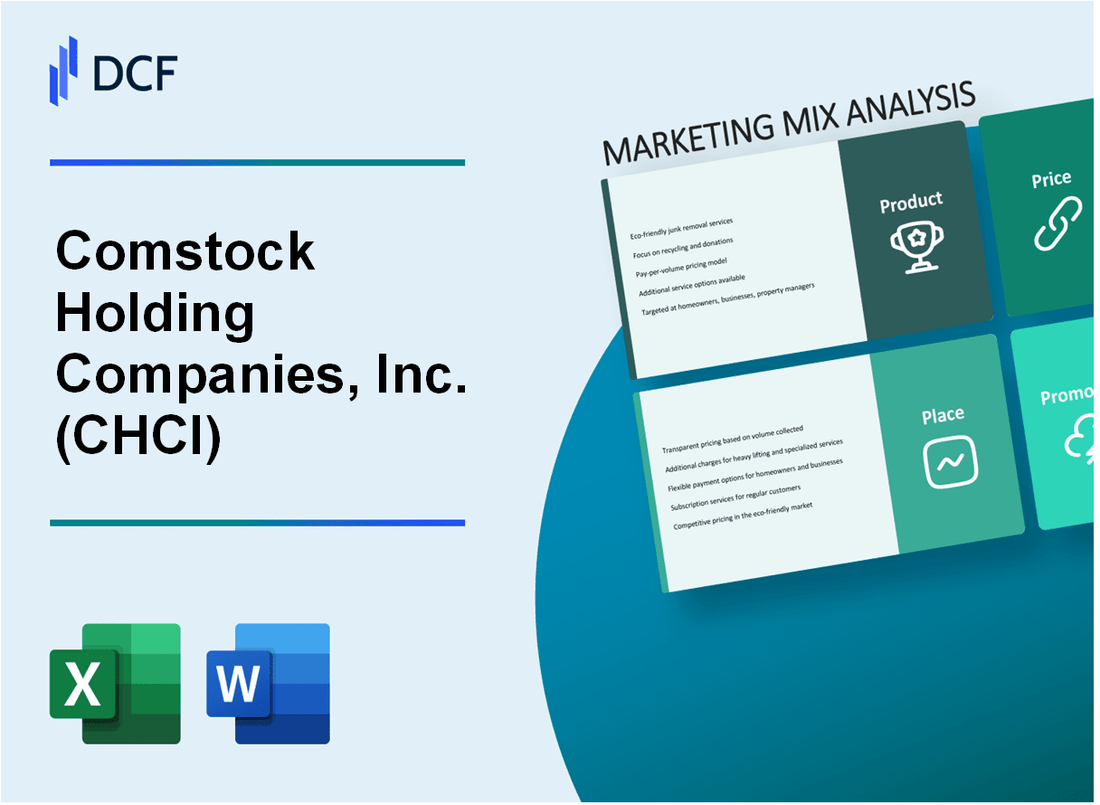
Comstock Holding Companies, Inc. (CHCI) - Marketing Mix: Product
You're looking at the core offerings of Comstock Holding Companies, Inc. (CHCI) as of late 2025. The product here isn't a single item; it's a suite of real estate management, development, and specialized services, all feeding into their fee-based revenue model. This focus on services, rather than just ownership, defines what they sell to clients and partners.
The revenue mix for the three months ended September 30, 2025, clearly shows where the immediate product value is being generated. Asset Management remains the largest component, but ParkX Management is showing significant momentum, which is a key strategic development for the product line.
| Revenue Segment | Q3 2025 Revenue Contribution Percentage | Q3 2025 Total Revenue (Millions USD) |
| Asset Management | 49.2% | Approximately $6.54 million (Calculated: $13.3M 0.492) |
| Property Management services | 21.7% | Approximately $2.89 million (Calculated: $13.3M 0.217) |
| ParkX Management | 29.1% | Approximately $3.87 million (Calculated: $13.3M 0.291) |
The development side of the product offering centers on creating high-value, long-term assets that then feed the management segments. Comstock Holding Companies, Inc. is focused on the development of premium mixed-use, transit-oriented real estate assets in the Washington, D.C. region. Their managed portfolio is targeted for a full build-out of approximately 10 million square feet.
Specific recent product deliveries are enhancing the recurring revenue base. For instance, the delivery of Phase II of Reston Station, specifically The Row at Reston Station, began in Q3 2025. This included the delivery of the JW Marriott Reston Station and the JW Marriott Residences Reston Station, the latter being a 94-unit luxury condominium tower that generated nearly $90 million in sales to-date, with $20 million closing in September 2025 alone.
The ParkX Management segment is actively evolving its service product. This segment saw a 63.8% revenue increase compared to the same period in 2024, driven by new contracts. A significant product enhancement is the new ParkX service expansion to include porter and janitorial offerings. This required Comstock Holding Companies, Inc. to invest in hiring 139 new employees in Q3 2025 to staff these new services.
Here's a quick look at the ParkX service expansion details:
- New service offerings include porter and janitorial services.
- 12 new porter/janitorial contracts are set to commence in Q4 2025.
- These 12 new contracts are in addition to 10 previously secured porter and janitorial contracts.
- ParkX third-party revenue increased 96% year-over-year for the quarter.
The overall product strategy is clearly leaning into high-margin, fee-based services supported by high-quality, strategically located real estate assets. If onboarding takes 14+ days, churn risk rises, so the rapid hiring of 139 staff shows a commitment to service delivery speed.
Finance: draft 13-week cash view by Friday.
Comstock Holding Companies, Inc. (CHCI) - Marketing Mix: Place
Comstock Holding Companies, Inc. (CHCI) concentrates its distribution strategy, or Place, almost exclusively within the Washington, D.C. metropolitan area, which is a key part of the Mid-Atlantic region real estate market. This geographic focus is central to their entire operational model.
The core of the Place strategy involves positioning assets at locations that maximize accessibility and capture regional growth trends. This means strategic developments are located at key Metro rail stations along the transit corridors. The company's managed portfolio, as of Q3 2025, includes approximately 10 million square feet of stabilized, under construction, and planned assets, all strategically situated near these transit hubs.
The Anchor Portfolio assets represent the flagship locations driving this strategy. These include major mixed-use projects such as Reston Station and Loudoun Station. The delivery of assets like the JW Marriott Reston Station and JW Marriott Residences Reston Station further solidifies their presence in these high-traffic, transit-oriented nodes.
The scale of Comstock Holding Companies, Inc. (CHCI)'s distribution network, managed through its asset management services, saw significant growth. As of Q3 2025, the managed portfolio expanded to 91 assets. This portfolio is diverse, comprising commercial, residential, hospitality, and parking facilities.
The company's ongoing focus is on high-quality, mixed-use properties near transit hubs, which is seen as the future of urban transformation in the region. The development pipeline supports this, projecting a total build-out of nearly 10 million square feet of commercial and residential assets.
Here's a look at the portfolio scale and leasing status as of the third quarter of 2025:
| Metric | Value as of Q3 2025 | Context/Segment |
| Total Managed Assets | 91 assets | Managed Portfolio (Stabilized, Under Construction, Planned) |
| Total Projected Build-out Square Footage | Nearly 10 million square feet | Development Pipeline (Commercial and Residential) |
| Stabilized Commercial Portfolio Lease Rate | 93% leased | Stabilized Commercial Managed Portfolio |
| Commercial Space Leased Year-to-Date (YTD) | More than 500,000 sqft | Commercial Leasing Activity |
| Residential Space Leased Year-to-Date (YTD) | Over 500 units | Residential Managed Portfolio |
The strategic placement near Metro stations is designed to capitalize on evolving work patterns, even with current remote work trends. The goal is to pair transit accessibility with increased densities.
- Geographic Concentration: Washington, D.C. metropolitan area.
- Key Development Hubs: Reston Station and Loudoun Station.
- Strategic Location Type: Properties near key Metro rail stations.
- Portfolio Size (Q3 2025): 91 assets under management.
- Development Focus: High-quality, mixed-use properties.
- Projected Development Size: Nearly 10 million square feet build-out.
The company actively secured new commercial leases post-quarter end, including for two newest Trophy-class office towers at Reston Station, reinforcing the viability of their transit-adjacent office space distribution. The delivery of hospitality assets like the JW Marriott Reston Station also enhances the mixed-use nature of their distribution points.
Comstock Holding Companies, Inc. (CHCI) - Marketing Mix: Promotion
Promotion for Comstock Holding Companies, Inc. (CHCI) centers on communicating the stability, growth, and quality of its asset base, largely through investor-focused channels and public announcements highlighting major transactional successes.
Investor Relations and Financial Highlights
Comstock Holding Companies, Inc. actively promotes its financial performance through press releases and investor presentations, emphasizing consistent growth metrics. For the third quarter ended September 30, 2025, revenue increased 3% to $13.3 million, contributing to a Year-to-Date (YTD) revenue of $38.9 million, marking the 27th consecutive quarter of YTD revenue growth. The promotion of this stability is key, as the YTD revenue growth stands at 13%.
Financial promotion also focuses on profitability and the fee-based model:
- YTD recurring, fee-based revenue increased 37% versus the prior year.
- YTD third-party revenue from the ParkX subsidiary showed a 126% increase.
- Adjusted EBITDA for Q3 2025 was $1.1 million, with a YTD figure of $5.3 million.
- Net income for Q3 2025 was $0.5 million, totaling $3.6 million YTD.
The company also publicizes its asset-light, debt-free model as a point of financial strength.
Publicizing Major Commercial Leases
A significant promotional effort involves publicizing major leasing activity, particularly at the Reston Station development, which reinforces demand for its Trophy-class office space. The announcement of the Booz Allen Hamilton, Inc. leases was a major focus, securing space across two new Trophy towers at 1870 Reston Row Plaza and 1800 Reston Row Plaza.
The scale of leasing success is quantified in these announcements:
| Leasing Metric | Value |
| Booz Allen Hamilton Lease Space | Over 310,000 square feet |
| Q3 2025 Commercial Leases Executed | 9 leases, representing approximately 75,000 sqft |
| YTD Commercial Leasing (as of Q3 2025) | More than 500,000 sqft |
The 1870 Reston Row Plaza Trophy-class office tower, a 254,000 sqft asset, was promoted as being fully leased upon its Q4 2025 delivery.
Showcasing Delivery of Trophy-Class Assets
The delivery of high-profile, completed assets serves as tangible proof of Comstock Holding Companies, Inc.'s development capabilities. The grand opening of JW Marriott Reston Station in September 2025 was heavily publicized as Virginia's first. This asset showcases premium offerings:
- Hotel Rooms: 247-key luxury hotel.
- Meeting Space: Over 40,000 square feet of luxury meeting and event space.
- Residences Sales: JW Marriott Residences generated nearly $90 million in condominium sales to-date, with $20 million closed in September 2025 alone.
The promotion also notes the impending delivery of the BLVD Haley luxury residential tower, with initial deliveries starting in late Q4 2025.
Digital Presence
Comstock Holding Companies, Inc. maintains a clear digital promotional footprint. The primary corporate website, Comstock.com, is used to announce developments and milestones. The dedicated investor relations website hosts official filings and presentations, such as the Midyear 2025 Investor Presentation Update, accessible at https://ir.comstock.com/events-and-presentations/.
Stabilized Portfolio Occupancy
A key statistical figure consistently used in promotion to signal asset quality and operational success is the leased percentage of the stabilized portfolio. The stabilized Commercial managed portfolio is reported at 93% leased. This is contrasted with the Residential managed portfolio, which maintains a 96% leased percentage as of Q3 2025.
Comstock Holding Companies, Inc. (CHCI) - Marketing Mix: Price
You're looking at how Comstock Holding Companies, Inc. (CHCI) structures the price customers pay, which for them is heavily tied to their unique, fee-based revenue model. This isn't about setting shelf prices; it's about the terms and structure of long-term service agreements that dictate cash flow.
The core of the pricing strategy for Comstock Holding Companies, Inc. (CHCI) is its reliance on a fee-based revenue model from long-term management contracts. This structure, underpinned by agreements like the 2022 Asset Management Agreement (AMA), provides a predictable pricing floor, insulating the company somewhat from direct market volatility on the asset side. This is a key differentiator in how they price their services to clients and investors.
The effectiveness of this model is clear in the recent figures. For the third quarter of 2025, the recurring, fee-based revenue increased 30% compared to the same period last year. This growth in the recurring component is a direct reflection of the pricing power and stickiness of their management services. To put that in context against the top line, the Total revenue for Q3 2025 reached $13.3 million.
When you look at where that revenue comes from, you see the pricing power spread across their service lines:
- Asset Management accounted for 49.2% of total revenue in Q3 2025.
- ParkX Management made up 29.1% of total revenue for the three months ended September 30, 2025.
- Property Management contributed 21.7% of the Q3 2025 revenue.
The development side also factors into the overall financial picture that supports their pricing flexibility. For instance, the Condominium pre-sales for The Row at Reston Station generated approximately $78 million to-date as of the Q2 2025 report, with deliveries starting in Q3 2025. That upfront capital generation certainly helps fund operations without needing debt.
Here's a quick look at how the Q3 2025 revenue broke down by segment, which shows where their fee-based pricing is most concentrated:
| Revenue Segment | Percentage of Total Q3 2025 Revenue |
| Asset Management | 49.2% |
| ParkX Management | 29.1% |
| Property Management | 21.7% |
The most significant pricing advantage, however, is structural. Comstock Holding Companies, Inc. (CHCI) operates with an asset-light, debt-free balance sheet, which is defintely a pricing advantage. Because they carry zero debt, they incur no interest expense, which is a massive cost saving that competitors with leverage must price into their services or absorb as lower margins. In fact, as of the nine-month period ending September 30, 2025, the company reported a net cash position of $28 million. This financial discipline allows Comstock Holding Companies, Inc. (CHCI) to price its management services competitively while maintaining strong profitability metrics, such as Q3 2025 Net Income of $0.5 million and Adjusted EBITDA of $1.1 million.
Disclaimer
All information, articles, and product details provided on this website are for general informational and educational purposes only. We do not claim any ownership over, nor do we intend to infringe upon, any trademarks, copyrights, logos, brand names, or other intellectual property mentioned or depicted on this site. Such intellectual property remains the property of its respective owners, and any references here are made solely for identification or informational purposes, without implying any affiliation, endorsement, or partnership.
We make no representations or warranties, express or implied, regarding the accuracy, completeness, or suitability of any content or products presented. Nothing on this website should be construed as legal, tax, investment, financial, medical, or other professional advice. In addition, no part of this site—including articles or product references—constitutes a solicitation, recommendation, endorsement, advertisement, or offer to buy or sell any securities, franchises, or other financial instruments, particularly in jurisdictions where such activity would be unlawful.
All content is of a general nature and may not address the specific circumstances of any individual or entity. It is not a substitute for professional advice or services. Any actions you take based on the information provided here are strictly at your own risk. You accept full responsibility for any decisions or outcomes arising from your use of this website and agree to release us from any liability in connection with your use of, or reliance upon, the content or products found herein.