
|
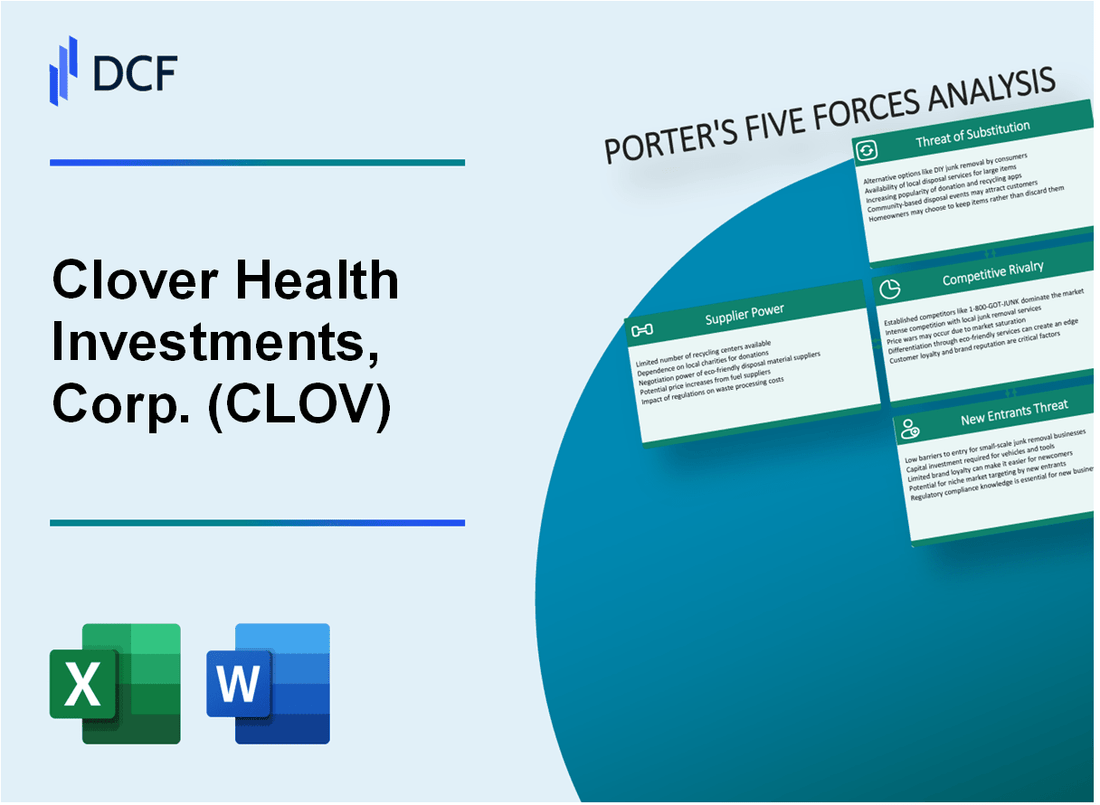
Clover Health Investments, Corp. (CLOV): 5 FORCES Analysis [Nov-2025 Updated] |
Fully Editable: Tailor To Your Needs In Excel Or Sheets
Professional Design: Trusted, Industry-Standard Templates
Investor-Approved Valuation Models
MAC/PC Compatible, Fully Unlocked
No Expertise Is Needed; Easy To Follow
Clover Health Investments, Corp. (CLOV) Bundle
You're looking for a clear-eyed view of Clover Health Investments, Corp.'s competitive position, and honestly, the Medicare Advantage market is tough, but their tech is defintely a lever. As we map out Michael Porter's Five Forces heading into late 2025, you'll see that while competitive rivalry with giants like Humana and UnitedHealth is extremely high-reflected in their Q3 2025 Insurance BER of 93.5%-the proprietary Clover Assistant technology acts as a crucial moat against new entrants and generic substitutes. Still, customer power remains high, even with 95% retention for the 2024 cohort, because switching is easy during the Annual Election Period. Dive in below to see how these forces shape the path for a company projecting insurance revenue between $1.850 billion and $1.880 billion for the full year 2025.
Clover Health Investments, Corp. (CLOV) - Porter's Five Forces: Bargaining power of suppliers
You're looking at the supplier side of Clover Health Investments, Corp. (CLOV)'s business, and honestly, the power dynamic here is complex. We peg the overall bargaining power of suppliers as moderate, but that rating hinges heavily on the adoption and effectiveness of the Clover Assistant (CA) technology. When providers use CA, it shifts the balance of power by demonstrating tangible cost efficiencies, which is exactly what Clover Health needs to control its input costs.
The CA technology is the key lever Clover Health uses to manage supplier influence, primarily by driving better clinical outcomes that lower the total cost of care. For instance, recent clinical whitepaper data shows that a relationship with a provider using CA was correlated with a 15% lower average number of all-cause hospitalizations among COPD patients. Furthermore, these same relationships showed an 18% lower average number of 30-day readmissions for that population. These kinds of hard numbers give Clover Health leverage in partnership discussions.
The primary suppliers in this context are the healthcare providers-the doctors and hospitals-that deliver care to Clover Health's members. When you look at the market structure, provider power can be quite high, especially in markets where health systems are heavily consolidated. In these concentrated areas, providers can demand better reimbursement rates, which directly pressures Clover Health's margins, as seen by the Q3 2025 Insurance Benefit Expense Ratio (BER) hitting 93.5%.
Here's a quick look at the economics that drive these negotiations, showing the cost difference between the members Clover Health manages well versus those that are still early in their journey:
| Metric | Value (Q1-Q3 2025) |
|---|---|
| Returning Member Profitability | $217 per-member-per-month |
| New Member Loss | $110 per-member-per-month |
| Q3 2025 Insurance BER | 93.5% |
| Revised Full Year 2025 Insurance BER Guidance | 90% - 91% |
| Q3 2025 MA Membership | 109,226 |
Clover Health is actively pursuing cost-efficiency by using these performance metrics to renegotiate partnerships and encourage provider adoption of CA. The goal is to move more of the provider base toward the economics seen in the returning cohorts, which delivered a $217 per-member-per-month profit, versus the $110 per-member-per-month loss seen with new members in the first three quarters of 2025. This focus on technology-driven efficiency is how they push back against supplier demands.
The pursuit of better cost control is evident in their guidance adjustments. For the full year 2025, Clover Health improved its Adjusted Selling, General & Administrative (SG&A) as a percentage of Total Revenues guidance to between 17% - 18% year-to-date. This focus on operational leverage is critical when provider leverage is high.
The key actions Clover Health is taking to manage supplier power include:
- Driving adoption of Clover Assistant across the network.
- Highlighting clinical outcomes like the 15% hospitalization reduction.
- Focusing on high-retention, profitable returning member cohorts.
- Seeking to improve the full-year Insurance BER to the 90% - 91% range.
If onboarding new providers takes too long to integrate CA, churn risk rises. Finance: draft 13-week cash view by Friday.
Clover Health Investments, Corp. (CLOV) - Porter's Five Forces: Bargaining power of customers
The bargaining power of customers-Medicare beneficiaries-is inherently high in the Medicare Advantage (MA) market, and this dynamic directly impacts Clover Health Investments, Corp. (CLOV). Power is high because switching costs are effectively low, especially during the Annual Election Period (AEP). This annual window is when the customer can reassess and change their coverage without penalty.
Medicare beneficiaries have the flexibility to easily switch to competing MA plans offered by other carriers or revert to Original Medicare. This constant threat of attrition forces Clover Health to compete aggressively on benefits, network quality, and price. The ability for members to vote with their feet annually keeps the pressure on management to deliver value.
Clover Health Investments, Corp. uses its improved quality ratings as a primary lever to combat this customer power. Specifically, the Centers for Medicare & Medicaid Services (CMS) increased the Star rating of Clover Health's PPO Medicare Advantage plans to 4 Stars for the 2025 measurement year, which directly affects the payment year 2026. This 4 Star rating is a key retention tool because it is expected to translate into a general 5% quality bonus increase in benchmark rates for 2026, allowing Clover Health to reinvest in more competitive member benefits.
The effectiveness of their current offerings and retention strategy is evident in membership composition following the last AEP. For instance, approximately 95% of Clover Health's January 1, 2025 membership was enrolled in that flagship 4 Star PPO plan, showing strong appeal for their top-rated product following the 2024 AEP. While the exact retention percentage for the 2024 AEP cohort is not explicitly published as a standalone figure, this high concentration in the top-rated plan suggests strong stickiness among those who chose to remain.
Despite the competitive pressures, Clover Health Investments, Corp. has demonstrated an ability to attract new members, indicating their plans have strong appeal in the marketplace. As of the second quarter of 2025, the company grew its Medicare Advantage membership to over 106,323 lives. This represented a 32% year-over-year increase in membership for Q2 2025, and the company maintained its full-year 2025 average membership guidance between 104,000 and 108,000.
Here are the key metrics related to customer base and quality ratings:
| Metric | Value | Reporting Period/Context |
|---|---|---|
| Medicare Advantage Membership | 106,323 | Q2 2025 |
| Year-over-Year Membership Growth | 32% | Q2 2025 |
| PPO Plan Star Rating (Affects PY 2026) | 4.0 Stars | CMS Rating for 2025 |
| Expected Benchmark Rate Increase (PY 2026) | 5% | Due to 4-Star Rating |
| Membership in Flagship 4-Star PPO Plan | Approx. 95% | As of January 1, 2025 |
The customer base is highly engaged, as demonstrated by the following operational data points:
- Insurance revenue reached $470 million in Q2 2025.
- Adjusted SG&A as a percentage of total revenue improved to 17% in Q2 2025.
- For COPD patients, Clover Assistant use correlated with 15% lower hospitalizations.
- For COPD patients, Clover Assistant use correlated with 18% lower 30-day readmissions.
Clover Health Investments, Corp. (CLOV) - Porter's Five Forces: Competitive rivalry
You're looking at the Medicare Advantage landscape, and honestly, the competitive rivalry facing Clover Health Investments, Corp. is brutal. This market is dominated by national behemoths, making every basis point of margin hard-won. The intensity stems from the sheer scale difference; Clover Health, with its full-year 2025 average Medicare Advantage membership guidance in the 106,000-108,000 member range, is a niche operator compared to the industry giants.
To put that into perspective, consider the scale of the top two players based on early 2025 enrollment data. UnitedHealthcare, for example, commanded approximately 9.92 million members as of February 2025, and Humana held about 5.84 million members around the same time. Clover Health is fighting for scraps against organizations that can leverage massive economies of scale in provider negotiations and administrative overhead. This dynamic puts immediate, intense cost pressure on Clover Health, which was clearly reflected in its third quarter of 2025 Insurance Benefit Expense Ratio (BER) hitting 93.5%.
Competition in this space is a multi-front war fought over the most critical value levers for Medicare beneficiaries. It's not just about the premium you charge; it's a complex trade-off involving the total package. Here's a quick look at how Clover Health stacks up against the largest competitors on key metrics:
| Metric | Clover Health (Q3 2025 Snapshot) | UnitedHealth (Early 2025 Context) | Humana (Early 2025 Context) |
|---|---|---|---|
| MA Membership (Approx.) | 109,226 (Q3 Avg.) | ~9.92 Million (Feb 2025) | ~5.84 Million (Feb 2025) |
| Insurance BER (Q3 2025) | 93.5% | Not Directly Comparable | Not Directly Comparable |
| Flagship Plan Star Rating (2025) | 4 Stars (PPO Plan) | Average Rating Decreased by 0.39 | Largest Drop, Decreased by 0.74 |
| Network Strategy Focus | PPO (Over 95% of MA members) | Best for Size of Network | Known for Part B Giveback & PPO Access |
The battleground is defined by several non-negotiable factors that drive enrollment decisions:
- Price: Monthly premiums and out-of-pocket maximums.
- Benefits: Ancillary offerings like dental, vision, and OTC allowances.
- Star Ratings: CMS quality scores directly impact federal payments.
- Network Size: Breadth of in-network providers available to members.
To counter the scale of incumbents, Clover Health has leaned heavily into a differentiated network strategy. Unlike many competitors who push restrictive Health Maintenance Organization (HMO) plans, Clover Health's focus is overwhelmingly on its Preferred Provider Organization (PPO) plans. As of late 2025, over 95% of Clover Health's Medicare Advantage membership is served through these PPO offerings. This PPO focus provides flexibility, often allowing members to see any doctor accepting Medicare, which is a significant draw against the narrow networks common among competitors' HMO products. Furthermore, Clover Health's flagship PPO plan achieving a 4 Star rating for 2025 stands in contrast to the star rating declines seen by both UnitedHealth (down 0.39) and Humana (down 0.74), giving Clover a quality-based competitive edge in that specific dimension.
Clover Health Investments, Corp. (CLOV) - Porter's Five Forces: Threat of substitutes
The threat of substitutes for Clover Health Investments, Corp. is undeniably high. You are competing not just against other managed care organizations, but against the foundational structure of Medicare itself. This is a market where inertia is strong, and the default option remains a powerful competitor.
Threat is high, primarily from traditional Medicare and Medicare Supplement (Medigap). In 2025, 54% of eligible Medicare beneficiaries-that is 34.1 million people out of about 62.8 million-are already enrolled in Medicare Advantage plans, but the remaining portion represents a massive pool still anchored to Original Medicare. Traditional Medicare lacks an out-of-pocket limit for covered services, which is a key difference, but its baseline costs are also rising: the standard Part B premium is $185.00 in 2025, and the Part A deductible for inpatient hospital services is $1,676. Medigap plans, which complement Original Medicare, offer predictable cost structures; for instance, the most popular Plan G in 2025 generally limits a member's out-of-pocket cost to the Part B deductible of $257 for the year, though average premiums vary widely, ranging from $142.67 to $319.38 monthly depending on age. Furthermore, federal spending for MA plans is 20% higher per person than for similar beneficiaries in traditional Medicare, which signals a significant cost differential that regulators and beneficiaries are aware of.
Other Medicare Advantage plans are direct, near-perfect substitutes. The average Medicare beneficiary in 2025 has access to 42 options across all plans for individual enrollment, meaning Clover Health is one choice among many similar bundled products. These competing MA plans often bundle Part A, Part B, and usually Part D, plus extra benefits like dental and vision, making the value proposition very similar across the board. The concentration of the market is also a factor; UnitedHealth Group and Humana together account for nearly half (46%) of all Medicare Advantage enrollees nationwide in 2025.
Regulatory changes to MA reimbursement could make substitutes more attractive. While Clover Health benefits from a favorable CMS Part C rate update expected in 2026, the environment is volatile. For example, the median Maximum Out-of-Pocket (MOOP) limit for MA plans increased to $5,400 in 2025. Also, some MA plans have been reducing supplemental benefits-for instance, the share offering transportation benefits dropped from 36% in 2024 to 30% in 2025-which could push cost-conscious or high-need members back toward Medigap or Original Medicare.
Clover Assistant's clinical results are a key differentiator against generic plans. This technology is designed to improve care coordination, which should, in theory, lower costs relative to less-engaged plans. For example, a clinical whitepaper showed that a relationship with a provider using Clover Assistant was correlated with 15% lower hospitalizations and 18% lower readmissions for COPD patients. This focus on quality is reflected in ratings; Clover Health's PPO plans received the highest score in the country on core HEDIS measures for Payment Year 2026 Star ratings.
The company faces elevated medical cost trends, pressuring its ability to offer low-cost plans. You saw this pressure clearly in Q3 2025, where the Insurance Benefit Expense Ratio (BER) deteriorated to 93.5% from 82.8% year-over-year. This margin squeeze is partly due to the mix of new members, who generated a $110 per-member-per-month loss in the first three quarters of 2025, compared to the $217 per-member-per-month profit from returning members. Still, the underlying incurred medical cost trend, excluding pharmacy, was reported at 4% in Q3 2025, which is a number that must be managed tightly to keep premiums competitive against substitutes.
| Metric | Clover Health (Q3 2025/FY 2025 Guidance) | Market Context (2025) |
|---|---|---|
| MA Membership Growth (YoY) | 35% (Q3 2025) | 54% of eligible beneficiaries enrolled in MA |
| Insurance BER (Q3) | 93.5% (Q3 2025) | MA payments are 20% more per person than Traditional Medicare |
| New Member Contribution (PMPM) | -$110 loss (Q1-Q3 2025) | Average MA beneficiary has 42 plan options |
| Returning Member Profit (PMPM) | $217 profit (Q1-Q3 2025) | Median MA MOOP limit: $5,400 |
| Clover Assistant Impact (COPD) | 15% lower hospitalizations | Medigap Plan G Part B deductible: $257 |
Finance: draft 13-week cash view by Friday.
Clover Health Investments, Corp. (CLOV) - Porter's Five Forces: Threat of new entrants
The threat of new entrants into the Medicare Advantage (MA) space where Clover Health Investments, Corp. operates is generally low to moderate. This assessment hinges on the significant regulatory hurdles and the substantial capital required to effectively manage medical risk and establish robust provider networks.
New entrants definitely need substantial capital to cover medical risk and build out the necessary infrastructure. Look at Clover Health Investments, Corp. itself; at the end of the first quarter of 2025, consolidated cash, cash equivalents, and investments stood at $391 million. Still, even with that base, the company is showing a negative free cash flow yield of -3.46% as of late 2025, illustrating the capital intensity of growth in this sector. A new entrant would face similar, if not greater, initial capital strain to compete effectively against established players.
The market is highly regulated by the Centers for Medicare & Medicaid Services (CMS). This oversight dictates everything from plan design to reimbursement, creating a steep learning curve and compliance cost for any newcomer. Clover Health Investments, Corp.'s ability to command higher reimbursement rates is directly tied to its quality metrics, such as its 4.0 Star rating achieved for payment year 2026.
Clover Assistant acts as a proprietary technology moat that is quite expensive to replicate. This AI-powered platform gives doctors real-time decision support, which translates directly into better cost control and better Star Ratings. Here's a quick look at the measurable impact of this technology:
- 18% lower all-cause hospitalizations for CHF patients.
- 25% lower 30-day readmissions for CHF patients.
- Doctors start diabetes patients on oral medications three years earlier on average.
- Helps drive higher reimbursements from CMS.
The scale Clover Health Investments, Corp. is achieving demonstrates the level of operation required to be a meaningful player. The company projects full-year 2025 insurance revenue to be between $1.850 billion and $1.880 billion. This revenue base, supported by an expected average Medicare Advantage membership between 104,000 and 108,000 for 2025, shows the volume needed to absorb the fixed costs associated with regulatory compliance and technology development.
To put the scale and quality requirements into perspective, consider this comparison:
| Metric | Clover Health Investments, Corp. (Late 2025 Estimate/Actual) | New Entrant Barrier Benchmark |
|---|---|---|
| Projected Full-Year 2025 Insurance Revenue | $1.850 billion - $1.880 billion | Requires multi-billion dollar revenue base for sustainability. |
| Q2 2025 MA Membership | 106,323 members | Significant membership volume needed for risk pooling/network leverage. |
| CMS Star Rating (PY2026) | 4.0 Star rating | High rating is critical for maximizing per-member per-month revenue. |
| Q1 2025 Cash Position | $391 million | Substantial capital reserves necessary to cover initial medical risk. |
Finance: draft sensitivity analysis on capital needs for a new MA entrant by next Tuesday.
Disclaimer
All information, articles, and product details provided on this website are for general informational and educational purposes only. We do not claim any ownership over, nor do we intend to infringe upon, any trademarks, copyrights, logos, brand names, or other intellectual property mentioned or depicted on this site. Such intellectual property remains the property of its respective owners, and any references here are made solely for identification or informational purposes, without implying any affiliation, endorsement, or partnership.
We make no representations or warranties, express or implied, regarding the accuracy, completeness, or suitability of any content or products presented. Nothing on this website should be construed as legal, tax, investment, financial, medical, or other professional advice. In addition, no part of this site—including articles or product references—constitutes a solicitation, recommendation, endorsement, advertisement, or offer to buy or sell any securities, franchises, or other financial instruments, particularly in jurisdictions where such activity would be unlawful.
All content is of a general nature and may not address the specific circumstances of any individual or entity. It is not a substitute for professional advice or services. Any actions you take based on the information provided here are strictly at your own risk. You accept full responsibility for any decisions or outcomes arising from your use of this website and agree to release us from any liability in connection with your use of, or reliance upon, the content or products found herein.