
|
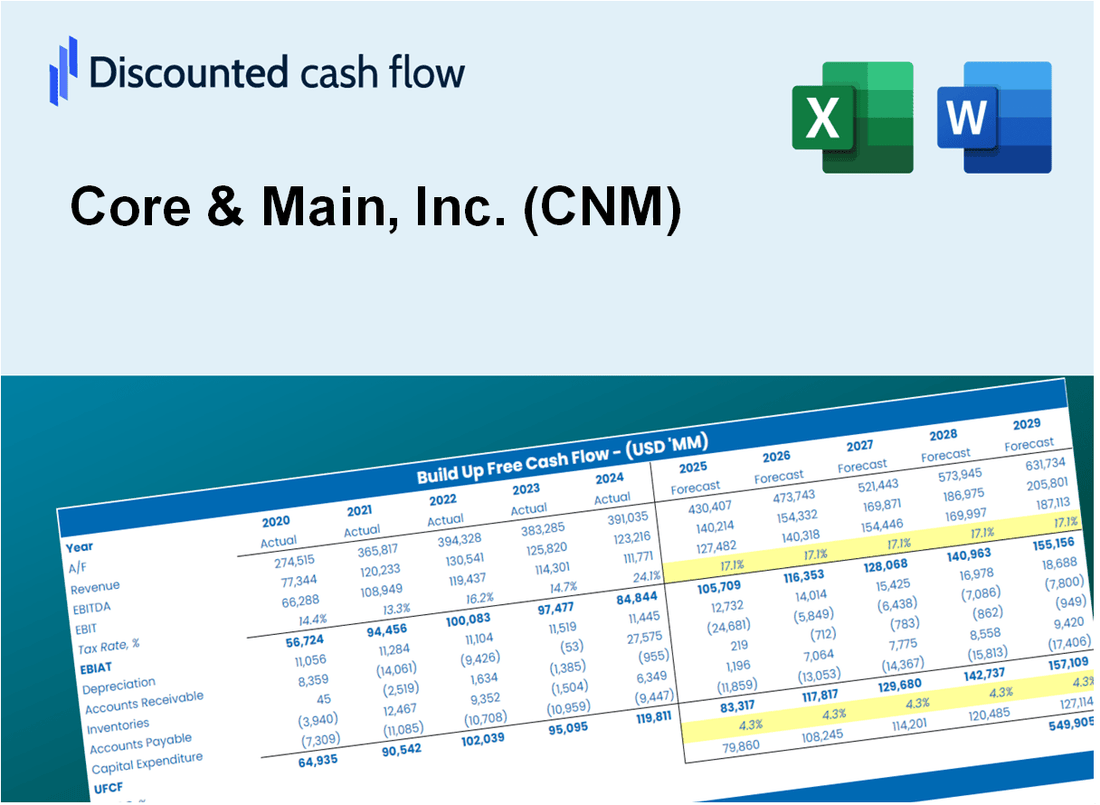
Core & Main, Inc. (CNM) DCF Valuation |
Fully Editable: Tailor To Your Needs In Excel Or Sheets
Professional Design: Trusted, Industry-Standard Templates
Investor-Approved Valuation Models
MAC/PC Compatible, Fully Unlocked
No Expertise Is Needed; Easy To Follow
Core & Main, Inc. (CNM) Bundle
Designed for accuracy, our (CNM) DCF Calculator empowers you to assess Core & Main, Inc. valuation using real-world financial data, offering complete flexibility to modify all essential parameters for enhanced projections.
Discounted Cash Flow (DCF) - (USD MM)
| Year | AY1 2020 |
AY2 2021 |
AY3 2022 |
AY4 2023 |
AY5 2024 |
FY1 2025 |
FY2 2026 |
FY3 2027 |
FY4 2028 |
FY5 2029 |
|---|---|---|---|---|---|---|---|---|---|---|
| Revenue | 3,642.0 | 5,004.0 | 6,651.0 | 6,702.0 | 7,441.0 | 8,968.3 | 10,809.2 | 13,027.9 | 15,702.0 | 18,925.0 |
| Revenue Growth, % | 0 | 37.4 | 32.91 | 0.7668 | 11.03 | 20.53 | 20.53 | 20.53 | 20.53 | 20.53 |
| EBITDA | 338.0 | 524.0 | 924.0 | 894.0 | 913.0 | 1,062.8 | 1,281.0 | 1,543.9 | 1,860.8 | 2,242.8 |
| EBITDA, % | 9.28 | 10.47 | 13.89 | 13.34 | 12.27 | 11.85 | 11.85 | 11.85 | 11.85 | 11.85 |
| Depreciation | 153.0 | 150.0 | 148.0 | 154.0 | 194.0 | 257.0 | 309.8 | 373.3 | 450.0 | 542.3 |
| Depreciation, % | 4.2 | 3 | 2.23 | 2.3 | 2.61 | 2.87 | 2.87 | 2.87 | 2.87 | 2.87 |
| EBIT | 185.0 | 374.0 | 776.0 | 740.0 | 719.0 | 805.8 | 971.2 | 1,170.6 | 1,410.8 | 1,700.4 |
| EBIT, % | 5.08 | 7.47 | 11.67 | 11.04 | 9.66 | 8.99 | 8.99 | 8.99 | 8.99 | 8.99 |
| Total Cash | 380.9 | 1.0 | 177.0 | 1.0 | 8.0 | 237.9 | 286.7 | 345.6 | 416.5 | 502.0 |
| Total Cash, percent | .0 | .0 | .0 | .0 | .0 | .0 | .0 | .0 | .0 | .0 |
| Account Receivables | 557.0 | 884.0 | 955.0 | 973.0 | 1,066.0 | 1,366.1 | 1,646.5 | 1,984.5 | 2,391.8 | 2,882.7 |
| Account Receivables, % | 15.29 | 17.67 | 14.36 | 14.52 | 14.33 | 15.23 | 15.23 | 15.23 | 15.23 | 15.23 |
| Inventories | 383.8 | 856.0 | 1,047.0 | 766.0 | 908.0 | 1,202.1 | 1,448.8 | 1,746.2 | 2,104.6 | 2,536.6 |
| Inventories, % | 10.54 | 17.11 | 15.74 | 11.43 | 12.2 | 13.4 | 13.4 | 13.4 | 13.4 | 13.4 |
| Accounts Payable | 326.0 | 608.0 | 479.0 | 504.0 | 562.0 | 778.0 | 937.7 | 1,130.2 | 1,362.2 | 1,641.8 |
| Accounts Payable, % | 8.95 | 12.15 | 7.2 | 7.52 | 7.55 | 8.68 | 8.68 | 8.68 | 8.68 | 8.68 |
| Capital Expenditure | -11.9 | -20.0 | -25.0 | -39.0 | -35.0 | -38.6 | -46.6 | -56.1 | -67.7 | -81.6 |
| Capital Expenditure, % | -0.32674 | -0.39968 | -0.37588 | -0.58192 | -0.47037 | -0.43092 | -0.43092 | -0.43092 | -0.43092 | -0.43092 |
| Tax Rate, % | 28.77 | 28.77 | 28.77 | 28.77 | 28.77 | 28.77 | 28.77 | 28.77 | 28.77 | 28.77 |
| EBITAT | 148.8 | 224.9 | 400.6 | 416.6 | 512.1 | 515.3 | 621.0 | 748.5 | 902.2 | 1,087.3 |
| Depreciation | ||||||||||
| Changes in Account Receivables | ||||||||||
| Changes in Inventories | ||||||||||
| Changes in Accounts Payable | ||||||||||
| Capital Expenditure | ||||||||||
| UFCF | -324.9 | -162.3 | 132.6 | 819.6 | 494.1 | 355.5 | 516.8 | 622.9 | 750.7 | 904.8 |
| WACC, % | 7.57 | 7.33 | 7.23 | 7.29 | 7.46 | 7.38 | 7.38 | 7.38 | 7.38 | 7.38 |
| PV UFCF | ||||||||||
| SUM PV UFCF | 2,480.9 | |||||||||
| Long Term Growth Rate, % | 2.00 | |||||||||
| Free cash flow (T + 1) | 923 | |||||||||
| Terminal Value | 17,160 | |||||||||
| Present Terminal Value | 12,021 | |||||||||
| Enterprise Value | 14,502 | |||||||||
| Net Debt | 2,498 | |||||||||
| Equity Value | 12,004 | |||||||||
| Diluted Shares Outstanding, MM | 201 | |||||||||
| Equity Value Per Share | 59.67 |
What You Will Get
- Comprehensive CNM Financials: Access to historical and projected data for precise valuation.
- Customizable Inputs: Adjust WACC, tax rates, revenue growth, and capital expenditures as needed.
- Real-Time Calculations: Intrinsic value and NPV are computed automatically.
- Scenario Analysis: Evaluate various scenarios to assess Core & Main's future performance.
- User-Friendly Design: Designed for professionals but easy for newcomers to navigate.
Key Features
- Comprehensive Core & Main Financials: Gain access to precise pre-loaded historical data and future forecasts.
- Adjustable Forecast Parameters: Modify highlighted cells for metrics such as WACC, growth rates, and profit margins.
- Real-Time Calculations: Automatic updates for DCF, Net Present Value (NPV), and cash flow assessments.
- Interactive Dashboard: User-friendly charts and summaries to clearly present your valuation findings.
- Designed for All Skill Levels: An intuitive layout tailored for investors, CFOs, and consultants alike.
How It Works
- Download: Get the pre-built Excel file featuring Core & Main, Inc.'s (CNM) financial data.
- Customize: Modify projections, such as revenue growth, EBITDA %, and WACC.
- Update Automatically: The intrinsic value and NPV calculations refresh in real-time.
- Test Scenarios: Develop various forecasts and instantly compare results.
- Make Decisions: Leverage the valuation findings to inform your investment strategy.
Why Choose This Calculator for Core & Main, Inc. (CNM)?
- Accurate Data: Real Core & Main financials provide trustworthy valuation outcomes.
- Customizable: Modify key elements such as growth rates, WACC, and tax rates to align with your forecasts.
- Time-Saving: Pre-configured calculations save you the hassle of starting from zero.
- Professional-Grade Tool: Tailored for investors, analysts, and consultants in the industry.
- User-Friendly: Easy-to-navigate layout and clear instructions ensure accessibility for all users.
Who Should Use Core & Main, Inc. (CNM)?
- Supply Chain Managers: Understand inventory management and optimize operations using real-time data.
- Industry Researchers: Integrate market trends and professional models into studies related to waterworks and plumbing.
- Contractors: Evaluate material costs and assess project feasibility with accurate data for Core & Main, Inc. (CNM).
- Financial Analysts: Enhance your analysis with a customizable financial model tailored for the construction and infrastructure sectors.
- Small Business Owners: Discover how large suppliers like Core & Main, Inc. (CNM) impact the market and your business strategies.
What the Template Contains
- Preloaded CNM Data: Historical and projected financial data, including revenue, EBIT, and capital expenditures.
- DCF and WACC Models: Professional-grade sheets for calculating intrinsic value and Weighted Average Cost of Capital.
- Editable Inputs: Yellow-highlighted cells for adjusting revenue growth, tax rates, and discount rates.
- Financial Statements: Comprehensive annual and quarterly financials for deeper analysis.
- Key Ratios: Profitability, leverage, and efficiency ratios to evaluate performance.
- Dashboard and Charts: Visual summaries of valuation outcomes and assumptions.
Disclaimer
All information, articles, and product details provided on this website are for general informational and educational purposes only. We do not claim any ownership over, nor do we intend to infringe upon, any trademarks, copyrights, logos, brand names, or other intellectual property mentioned or depicted on this site. Such intellectual property remains the property of its respective owners, and any references here are made solely for identification or informational purposes, without implying any affiliation, endorsement, or partnership.
We make no representations or warranties, express or implied, regarding the accuracy, completeness, or suitability of any content or products presented. Nothing on this website should be construed as legal, tax, investment, financial, medical, or other professional advice. In addition, no part of this site—including articles or product references—constitutes a solicitation, recommendation, endorsement, advertisement, or offer to buy or sell any securities, franchises, or other financial instruments, particularly in jurisdictions where such activity would be unlawful.
All content is of a general nature and may not address the specific circumstances of any individual or entity. It is not a substitute for professional advice or services. Any actions you take based on the information provided here are strictly at your own risk. You accept full responsibility for any decisions or outcomes arising from your use of this website and agree to release us from any liability in connection with your use of, or reliance upon, the content or products found herein.