
|
Centessa Pharmaceuticals plc (CNTA): 5 FORCES Analysis [Apr-2026 Updated] |
Fully Editable: Tailor To Your Needs In Excel Or Sheets
Professional Design: Trusted, Industry-Standard Templates
Investor-Approved Valuation Models
MAC/PC Compatible, Fully Unlocked
No Expertise Is Needed; Easy To Follow
Centessa Pharmaceuticals plc (CNTA) Bundle
You're looking at Centessa Pharmaceuticals plc right now, and honestly, it's a classic high-stakes biotech gamble. As someone who's seen a few cycles from the analyst seat, I can tell you that with only $15.00 million in trailing revenue as of September 30, 2025, and burning through $54.891 million in Q3 2025 alone, the pressure is immense. This company's fate hinges almost entirely on its Orexin agonist pipeline, which means the forces pushing back-from powerful suppliers to intense rivalry-are amplified. We need to map out exactly where the leverage lies across the five forces to see if that $3.95 billion market cap (as of Nov 2025) is justified. Let's dive into the framework to see the near-term risks you need to watch.
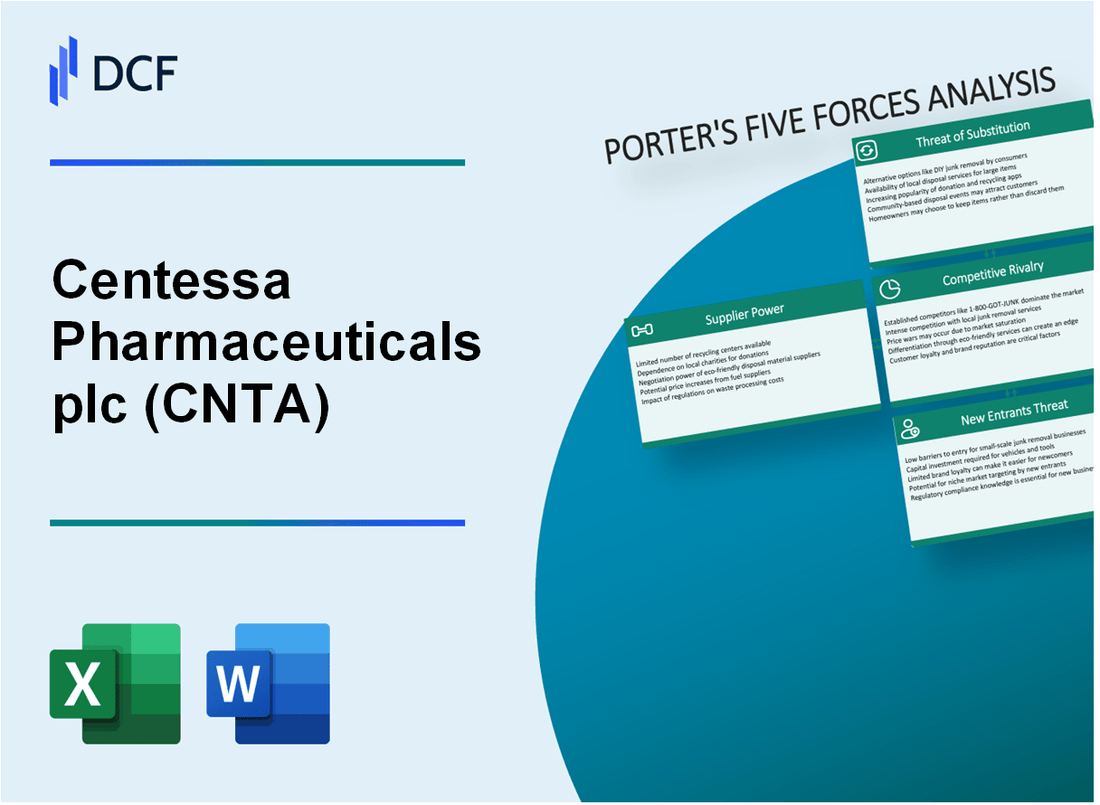
Centessa Pharmaceuticals plc (CNTA) - Porter's Five Forces: Bargaining power of suppliers
You're looking at the supplier landscape for Centessa Pharmaceuticals plc (CNTA) as they push their OX2R agonist pipeline through late-stage development. Because Centessa Pharmaceuticals plc operates with an asset-centric model, its reliance on external partners for specialized services is a key factor in supplier power.
Highly specialized CMOs control Active Pharmaceutical Ingredient (API) supply.
The supply chain for Active Pharmaceutical Ingredients (APIs) and drug product manufacturing is concentrated among a limited number of Contract Manufacturing Organizations (CMOs) or Contract Development and Manufacturing Organizations (CDMOs) capable of handling the complex chemistry and Good Manufacturing Practice (GMP) requirements for clinical and eventual commercial supply. Centessa Pharmaceuticals plc explicitly states its development strategy relies on strategic CRO and CDMO partners while maintaining a lean core team. This structure inherently shifts significant operational control to these specialized external entities. If a key CDMO faces capacity constraints or quality issues, Centessa Pharmaceuticals plc's timelines are immediately at risk.
Reliance on Contract Research Organizations (CROs) for clinical trials, driving $41.6 million Q3 2025 R&D expense.
The heavy outsourcing of clinical trial execution to Contract Research Organizations (CROs) gives those organizations considerable leverage, especially when managing multiple concurrent studies like Centessa Pharmaceuticals plc's ORX750 CRYSTAL-1 trial across NT1, NT2, and IH indications. The financial commitment to this outsourcing is clear in the reported figures. Research & Development (R&D) Expenses for Centessa Pharmaceuticals plc reached $41.6 million for the third quarter ended September 30, 2025. This spend reflects the cost of engaging these specialized CROs to advance the pipeline toward registrational studies planned for Q1 2026.
Here's a quick look at the financial context driving this R&D spend:
| Financial Metric | Period Ended September 30, 2025 | Period Ended September 30, 2024 |
| R&D Expenses | $41.6 million | $33.9 million |
| Cash, Cash Equivalents and Investments | $349.0 million (as of Sept 30, 2025) | N/A |
Switching costs are high due to complex regulatory and manufacturing processes.
Switching a CRO or CDMO mid-program is not like changing a software vendor; it involves significant administrative and scientific hurdles. For Centessa Pharmaceuticals plc, moving a drug candidate like ORX750, which is deep into Phase 2a testing, to a new manufacturing partner would require extensive technology transfer, revalidation of analytical methods, and potential regulatory filings to document the change. These processes introduce delays and substantial non-recurring costs, effectively locking Centessa Pharmaceuticals plc into its current relationships until a major issue forces a change.
- Regulatory documentation transfer complexity.
- Need for process re-validation.
- Risk of clinical trial timeline disruption.
- High cost of requalifying a new supplier.
Suppliers hold leverage until commercial-scale manufacturing is established.
Currently, Centessa Pharmaceuticals plc is pre-commercial, meaning it has no product revenue to offset its operating burn. With $349.0 million in cash and investments as of September 30, 2025, the company expects to fund operations into mid-2027. During this critical, capital-intensive clinical development phase, suppliers-especially those controlling the supply of clinical trial materials-have strong leverage. They are essential for reaching the inflection point of registrational studies and, eventually, market approval. Once commercial sales begin, Centessa Pharmaceuticals plc's ability to shift volume or negotiate pricing will improve, but until then, supplier terms are dictated by their specialized capabilities and Centessa's immediate need for execution.
Centessa Pharmaceuticals plc (CNTA) - Porter's Five Forces: Bargaining power of customers
You're looking at Centessa Pharmaceuticals plc (CNTA) as it stands in late 2025, and the customer side of the Five Forces framework is dominated by the entities that actually pay the bills, not the end-users.
For a clinical-stage company like Centessa Pharmaceuticals plc, which reported trailing twelve-month revenue of only $15.00 million through September 30, 2025, the power dynamic shifts dramatically upon commercial launch. Right now, with minimal revenue, the immediate buyer power is low, but the future power of payers is immense.
Power Concentrated with Future Payers
Once Centessa Pharmaceuticals plc's candidates, like ORX750, gain approval, the bargaining power will consolidate with future payers: insurers, Pharmacy Benefit Managers (PBMs), and government programs like Medicare. These entities are laser-focused on controlling the overall specialty trend, with 8 in 10 payers citing this as their top management goal in 2025.
Payer leverage is amplified by their increasing sophistication in managing high-cost therapies. They are actively seeking ways to reduce the cost of drugs at the point of sale, showing interest in accepting lower rebate guarantees in exchange for lower upfront prices. Furthermore, the visibility of negotiated prices, such as those announced for Medicare drugs, can pressure other payers to demand similar concessions.
Here's a snapshot of the financial context that shapes payer leverage:
| Metric | Value as of September 30, 2025 | Context |
|---|---|---|
| Trailing Twelve-Month Revenue | $15.00 million | Minimal current revenue base; future pricing is critical. |
| Cash, Cash Equivalents, Investments | $349.0 million | Provides runway into mid-2027, but commercialization costs loom. |
| Q3 2025 Net Loss | $54.9 million | Highlights ongoing cash burn before product revenue. |
Patient Options and Unmet Needs
For patients, the current landscape for certain conditions like Narcolepsy Type 2 (NT2) is characterized by existing, but perhaps imperfect, treatment options. Standard-of-care medications for excessive daytime sleepiness (EDS) include stimulants like modafinil and armodafinil, and newer agents like pitolisant. Sodium oxybate is also a standard, strong recommendation for EDS and cataplexy.
However, Centessa Pharmaceuticals plc is positioning ORX750 as potentially the first Orexin Receptor 2 (OX2R) agonist to treat NT2. This suggests that while options exist, they may not fully address the underlying pathophysiology or patient needs, giving Centessa a potential differentiation point. The clinical data for ORX750 in NT2 showed statistically significant improvements on the Maintenance of Wakefulness Test (MWT).
The competitive environment also matters here; investors are watching how Centessa's data differentiates ORX750 from competitors like Takeda's oveporexton and Alkermes' alixorexton, which is advancing toward a Phase III program in Q1 2026.
- Existing EDS treatments: Modafinil, Armodafinil, Pitolisant.
- Cataplexy/Nighttime Sleep Standard: Sodium oxybate.
- ORX750 NT2 potential: First OX2R agonist.
- ORX750 MWT improvement: Statistically significant.
- Competitor Phase III start: Alkermes in Q1 2026.
Cost Sensitivity vs. Best-in-Class Profile
Even if ORX750 achieves a 'best-in-class' profile-for instance, showing a mean Epworth Sleepiness Scale (ESS) total score of 5.1 with ORX750 versus 18.7 for placebo in one NT1 cohort-payers will still exert high cost sensitivity. Payers aim to control the total cost of care, and they are increasingly looking at utilization management and formulary placement to manage spend on specialty drugs.
The high cost associated with specialty drugs means that Centessa Pharmaceuticals plc will face intense scrutiny on its pricing strategy relative to the clinical benefit. You'll see payers pushing for evidence that the incremental benefit over existing, potentially cheaper, alternatives justifies a premium price tag. It's a classic trade-off: superior efficacy versus budget impact.
The key factors influencing payer negotiation for Centessa Pharmaceuticals plc post-launch include:
- Need to manage accelerating specialty drug spend.
- Pressure to prefer lower-priced drugs, even without rebates.
- Adoption of medical drug formularies (72% of plans use them in 2025).
- Scrutiny over high-cost therapies, especially in government programs.
Finance: draft sensitivity analysis on ORX750 pricing vs. current standard-of-care cost-of-illness by next Wednesday.
Centessa Pharmaceuticals plc (CNTA) - Porter's Five Forces: Competitive rivalry
The competitive rivalry Centessa Pharmaceuticals plc faces in the Central Nervous System (CNS) and rare disease space is significant, characterized by large-scale capital deployment from established players. You see this clearly when looking at the recent Mergers and Acquisitions (M&A) activity in the sector as of late 2025.
Intense rivalry with established pharmaceutical companies in the CNS and rare disease space.
- Johnson & Johnson completed a $14.6 billion acquisition of Intra-Cellular Therapies, a CNS-focused firm, in 2025.
- Sanofi acquired Blueprint Medicines, specializing in rare diseases, for $9.5 billion upfront in July 2025.
- Merck KGaA acquired SpringWorks Therapeutics, focused on severe rare diseases, for $3.4 billion in July 2025.
- Novartis agreed to a pending $12 billion acquisition of Avidity Biosciences, which develops RNA therapeutics for rare genetic neuromuscular diseases.
This level of investment by majors shows that the therapeutic areas Centessa Pharmaceuticals targets are highly valued, meaning any success by Centessa Pharmaceuticals will draw immediate, well-resourced attention. For context, Centessa Pharmaceuticals plc's market capitalization as of November 24, 2025, was $4.29 billion, putting it in a different valuation tier than these recent multi-billion dollar acquisitions. Other companies in the broader 'pharmaceutical products' industry that represent competitive pressure include Revolution Medicines (RVMD), Roivant Sciences (ROIV), and BridgeBio Pharma (BBIO).
Direct competition from other companies developing Orexin receptor agonists.
While Centessa Pharmaceuticals plc is pushing its Orexin Receptor 2 (OX2R) agonist pipeline, direct competition exists from other firms targeting this mechanism for conditions like Narcolepsy Type 1 (NT1), Type 2 (NT2), and Idiopathic Hypersomnia (IH). The success of ORX750 is measured against existing standards of care, even though the search results indicate that none of the currently available therapies for narcolepsy target the orexin system directly. The company's cash position as of March 31, 2025, was $424.9 million, which supports ongoing clinical advancement, but competition often involves deeper pockets for late-stage trials and commercialization.
Rivalry is focused on clinical data superiority, like ORX750's Phase 2a results.
The battleground here is clinical efficacy and safety, especially since ORX750 is positioned as a potential best-in-class OX2R agonist. The data from the Phase 2a CRYSTAL-1 study, with a September 23, 2025, cut-off, provides concrete numbers for comparison against competitors' assets. Centessa Pharmaceuticals plc plans to initiate its registrational program in Q1 2026, making the upcoming data crucial for establishing superiority.
Here's a quick look at the key efficacy endpoints reported for ORX750 in the Phase 2a study:
| Metric | ORX750 Dose | Cohort Size (n) | Result vs Placebo | P-value |
| Mean Sleep Latency Change (MWT) | 4.0 mg | 10 | >10 minute increase at Week 2 | 0.0193 |
| Mean ESS Total Score (Week 2) | 4.0 mg | 10 | 8.1 (vs 15.9 for placebo) | 0.0023 |
| Mean ESS Total Score (Week 2) | 1.5 mg | 7 | 5.1 (vs 18.7 for placebo) | 0.0001 |
The 1.5 mg dose resulted in a mean ESS score of 5.1 compared to 18.7 for placebo at Week 2. These statistically significant, dose-dependent improvements must clearly outweigh any competing OX2R agonist data to capture market share.
The market cap of around $3.95 billion attracts significant competitor scrutiny.
While the prompt referenced a market cap of around $3.95 billion, recent data points show Centessa Pharmaceuticals plc's market capitalization fluctuating, with a figure of $4.29 billion noted as of November 24, 2025. Regardless of the exact figure, a valuation in the low single-digit billions for a company with late-stage CNS assets signals high potential value. This valuation, supported by a 106.75% increase in market cap over one year (as of Nov 24, 2025), definitely puts Centessa Pharmaceuticals on the radar of larger firms looking to acquire pipeline assets rather than build them internally. The company's ability to fund operations into mid-2027 with its $424.9 million cash balance as of March 31, 2025, gives it some runway, but the high M&A multiples seen in CNS/rare disease suggest that a successful registrational readout could trigger aggressive competitive bidding or acquisition interest.
Centessa Pharmaceuticals plc (CNTA) - Porter's Five Forces: Threat of substitutes
You're looking at the competitive landscape for Centessa Pharmaceuticals plc (CNTA) as of late 2025, and the threat of substitutes is definitely a major factor, especially given their focus on the Orexin Receptor 2 (OX2R) agonist class for sleep-wake disorders.
The current standard of care for excessive daytime sleepiness (EDS) is well-established, meaning Centessa Pharmaceuticals plc needs to demonstrate a significant clinical advantage over existing, approved options. The global narcolepsy therapeutics market is valued at approximately $4.12 billion in 2025, with the U.S. segment alone accounting for $1,018.78 million.
The existing treatments already capture substantial market share. For instance, in 2024, the segment for Central Nervous System (CNS) stimulants held an estimated 39.2% of the market share, driven by drugs like modafinil and armodafinil. Sodium oxybate, another key therapy, commanded 49.34% of the market revenue in 2024.
Here's a quick look at the cost disparity between established therapies, which highlights the cost-based substitution threat:
| Treatment Class/Drug Example | Estimated Monthly Cost (USD) | Primary Indication Focus | 2024 Market Share (%) |
|---|---|---|---|
| CNS Stimulants (e.g., Modafinil) | $30 - $500 | Excessive Daytime Sleepiness (EDS) | Estimated 39.2% (Segment Share) |
| Sodium Oxybate (e.g., Xyrem) | $5,000 - $10,000 | EDS and Cataplexy | 49.34% (Product Class Share) |
| Antidepressants (Off-Label SSRIs/SNRIs) | Varies, generally lower than specialty drugs | Cataplexy, REM-sleep related symptoms | Not explicitly quantified, but widely used |
Off-label use of approved drugs presents a defintely lower-cost alternative for managing specific symptoms. For cataplexy, which is a key target for Centessa Pharmaceuticals plc's pipeline, antidepressants like fluoxetine or venlafaxine are often prescribed when standard treatments are not tolerated. While these may not offer the same comprehensive wakefulness improvement as an OX2R agonist, their lower cost and established safety profiles in other indications make them a persistent, lower-cost alternative for symptom management.
Novel mechanisms of action from other biotech companies could bypass the Orexin pathway, or, more immediately, compete directly within it. We are seeing other OX2R agonists advancing, which means Centessa Pharmaceuticals plc is not alone in this emerging class. For example, Alkermes is testing ALKS 2680, an oral OX2R agonist, and Takeda's oveporexton has already met primary and secondary endpoints in Phase 3 studies. These competitors, if successful, directly substitute the value proposition of Centessa Pharmaceuticals plc's ORX750, ORX142, and ORX489 candidates.
The financial reality for Centessa Pharmaceuticals plc underscores the urgency to succeed against these substitutes. The company reported a net loss of $54.9 million for the third quarter ended September 30, 2025, with Research & Development expenses at $41.6 million for the same period. Cash, cash equivalents, and investments totaled $349.0 million as of that date, providing a runway expected to last into mid-2027. Pipeline failure would force patients back to existing, suboptimal therapies, but it would also mean Centessa Pharmaceuticals plc would have burned through its capital without delivering a differentiated product to displace those very substitutes.
- ORX750 Phase 2a data showed statistically significant results on the Maintenance of Wakefulness Test (MWT) and Epworth Sleepiness Scale (ESS).
- The company is planning to initiate a registrational program for ORX750 in Q1 2026.
- ORX142 and ORX489 are also planned to initiate clinical studies in Q1 2026.
- Narcolepsy Type 1 accounted for 61.63% of total therapy spending in 2024.
Finance: draft 13-week cash view by Friday.
Centessa Pharmaceuticals plc (CNTA) - Porter's Five Forces: Threat of new entrants
You're looking at the barriers to entry in the specialized pharmaceutical space where Centessa Pharmaceuticals plc operates; honestly, the hurdles are immense, which is a major source of comfort for the existing players. A new competitor doesn't just need a good idea; they need a war chest that rivals a small nation's budget.
Significant Capital Requirement and Operating Burn
The sheer cost of drug development acts as a massive deterrent. Consider Centessa Pharmaceuticals plc's recent performance: their net loss for the third quarter of 2025 hit $54.89 million. That's money spent just to keep the lights on and the research moving, not counting any major capital expenditure. To put that operational drain into perspective, their Research & Development (R&D) expense for that same quarter was $41.6 million. A new entrant faces this same immediate, non-revenue-generating spending requirement from day one.
We can map out how much capital is needed just to sustain operations at Centessa Pharmaceuticals plc's current pace:
| Metric | Value (Q3 2025 or Latest) | Context |
|---|---|---|
| Q3 2025 Net Loss | $54.89 million | Operational cash burn before accounting for investment |
| Q3 2025 R&D Expense | $41.6 million | Direct cost of advancing the pipeline |
| Cash as of Sept 30, 2025 | $349.0 million | Pre-raise cash reserves |
| Recent Equity Raise (Nov 2025) | $250.0 million | Funding secured to extend runway |
This table clearly shows you the scale of funding required just to reach the next set of milestones. If you want to enter this market, you need to be prepared to absorb losses measured in tens of millions per quarter.
High Regulatory Hurdles
Beyond the money, the regulatory gauntlet set by bodies like the FDA and EMA is incredibly stringent. You can't just launch a product; you have to prove safety and efficacy through multi-phase clinical trials, which is a process measured in years and hundreds of millions of dollars. Centessa Pharmaceuticals plc's most advanced asset, ORX750, is only just moving toward registrational studies, planned for the first quarter of 2026, following Phase 2a success. Meanwhile, ORX142 is still in Phase 1 clinical trials. A new entrant would need to replicate this multi-year, multi-million-dollar clinical validation process for any novel compound.
The regulatory path involves specific, costly steps:
- Phase 1: Safety and dosing in healthy volunteers.
- Phase 2a: Initial efficacy signals in patients (e.g., ORX750 for narcolepsy type 1).
- Registrational Studies (Phase 3): Large-scale trials required for submission.
Intellectual Property as a Barrier
Centessa Pharmaceuticals plc has built a moat around its core technology, specifically the intellectual property (IP) covering the OX2R agonist program. Strong patents provide exclusivity, meaning a new entrant cannot simply copy the mechanism of action or the specific molecule. However, this barrier is not impenetrable. Competitors can attempt to design around the existing patents, target different indications with the same mechanism, or challenge the validity of the IP in court, which itself is a costly endeavor.
Evidence of Massive Funding Needs
The market itself has recently confirmed the massive capital needs for a company like Centessa Pharmaceuticals plc to compete effectively. In November 2025, the company completed a follow-on equity offering to bolster its development efforts, raising approximately $250.0 million in gross proceeds. This substantial capital raise, priced at $21.50 per American Depositary Share, was necessary to fund the advancement of their pipeline through key milestones, extending their cash runway into mid-2027. A new entrant would need to secure a similar, if not larger, funding round just to establish a competitive footing against an established pipeline like Centessa's.
Disclaimer
All information, articles, and product details provided on this website are for general informational and educational purposes only. We do not claim any ownership over, nor do we intend to infringe upon, any trademarks, copyrights, logos, brand names, or other intellectual property mentioned or depicted on this site. Such intellectual property remains the property of its respective owners, and any references here are made solely for identification or informational purposes, without implying any affiliation, endorsement, or partnership.
We make no representations or warranties, express or implied, regarding the accuracy, completeness, or suitability of any content or products presented. Nothing on this website should be construed as legal, tax, investment, financial, medical, or other professional advice. In addition, no part of this site—including articles or product references—constitutes a solicitation, recommendation, endorsement, advertisement, or offer to buy or sell any securities, franchises, or other financial instruments, particularly in jurisdictions where such activity would be unlawful.
All content is of a general nature and may not address the specific circumstances of any individual or entity. It is not a substitute for professional advice or services. Any actions you take based on the information provided here are strictly at your own risk. You accept full responsibility for any decisions or outcomes arising from your use of this website and agree to release us from any liability in connection with your use of, or reliance upon, the content or products found herein.