
|
Cousins Properties Incorporated (CUZ) DCF Valuation |
Fully Editable: Tailor To Your Needs In Excel Or Sheets
Professional Design: Trusted, Industry-Standard Templates
Investor-Approved Valuation Models
MAC/PC Compatible, Fully Unlocked
No Expertise Is Needed; Easy To Follow
Cousins Properties Incorporated (CUZ) Bundle
Explore the financial prospects of Cousins Properties Incorporated (CUZ) with our user-friendly DCF Calculator! Simply enter your assumptions for growth, margins, and expenses to calculate the intrinsic value of Cousins Properties Incorporated (CUZ) and refine your investment strategy.
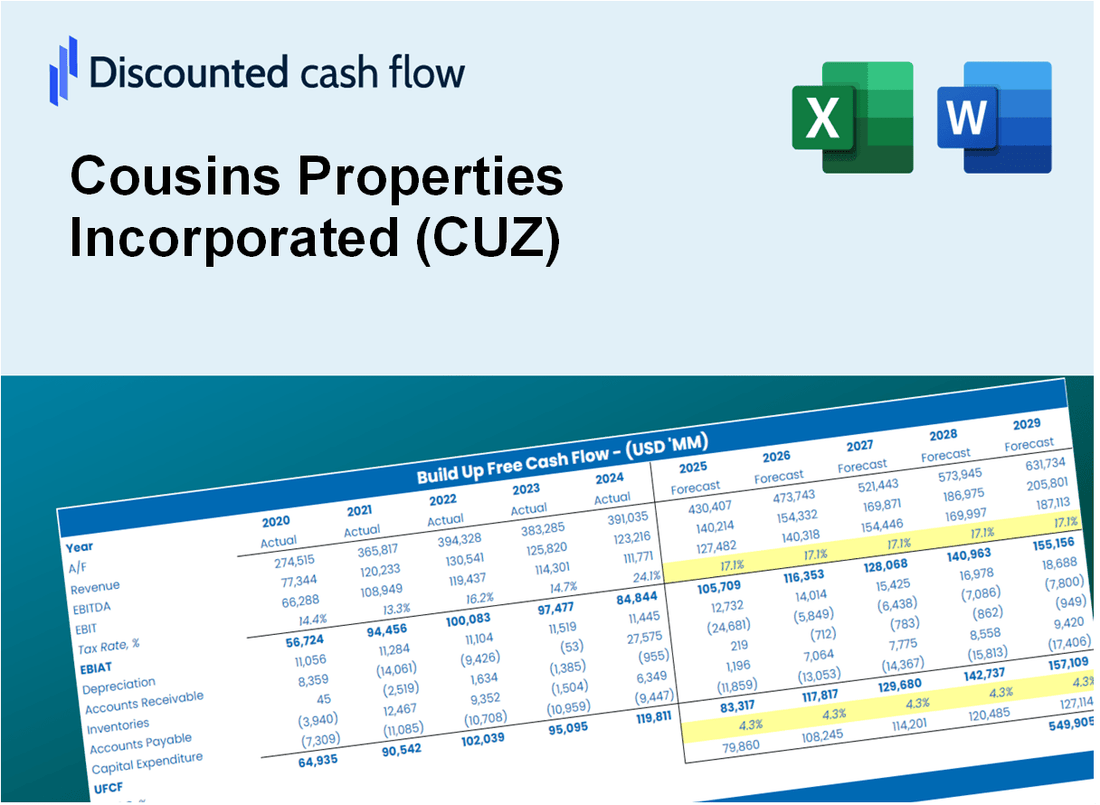
Discounted Cash Flow (DCF) - (USD MM)
| Year | AY1 2020 |
AY2 2021 |
AY3 2022 |
AY4 2023 |
AY5 2024 |
FY1 2025 |
FY2 2026 |
FY3 2027 |
FY4 2028 |
FY5 2029 |
|---|---|---|---|---|---|---|---|---|---|---|
| Revenue | 740.3 | 755.1 | 762.3 | 802.9 | 856.8 | 924.3 | 997.2 | 1,075.8 | 1,160.6 | 1,252.1 |
| Revenue Growth, % | 0 | 1.99 | 0.9558 | 5.32 | 6.71 | 7.88 | 7.88 | 7.88 | 7.88 | 7.88 |
| EBITDA | 466.7 | 468.5 | 479.1 | 504.2 | 536.8 | 579.3 | 625.0 | 674.3 | 727.5 | 784.8 |
| EBITDA, % | 63.04 | 62.04 | 62.86 | 62.8 | 62.65 | 62.68 | 62.68 | 62.68 | 62.68 | 62.68 |
| Depreciation | 570.2 | 581.5 | 586.4 | 314.9 | 365.0 | 578.2 | 623.8 | 673.0 | 726.0 | 783.3 |
| Depreciation, % | 77.02 | 77.01 | 76.93 | 39.22 | 42.61 | 62.56 | 62.56 | 62.56 | 62.56 | 62.56 |
| EBIT | -103.5 | -113.0 | -107.3 | 189.3 | 171.8 | 1.1 | 1.2 | 1.3 | 1.4 | 1.5 |
| EBIT, % | -13.98 | -14.96 | -14.08 | 23.58 | 20.05 | 0.12122 | 0.12122 | 0.12122 | 0.12122 | 0.12122 |
| Total Cash | 4.3 | 8.9 | 5.1 | 6.0 | 7.3 | 7.5 | 8.1 | 8.7 | 9.4 | 10.1 |
| Total Cash, percent | .0 | .0 | .0 | .0 | .0 | .0 | .0 | .0 | .0 | .0 |
| Account Receivables | 158.6 | 167.4 | 192.7 | 220.5 | 243.6 | 230.6 | 248.8 | 268.4 | 289.6 | 312.4 |
| Account Receivables, % | 21.42 | 22.17 | 25.28 | 27.46 | 28.43 | 24.95 | 24.95 | 24.95 | 24.95 | 24.95 |
| Inventories | .0 | .0 | .0 | .0 | .0 | .0 | .0 | .0 | .0 | .0 |
| Inventories, % | 0 | 0 | 0 | 0 | 0 | 0 | 0 | 0 | 0 | 0 |
| Accounts Payable | .0 | .0 | .0 | .0 | .0 | .0 | .0 | .0 | .0 | .0 |
| Accounts Payable, % | 0 | 0 | 0 | 0 | 0 | 0 | 0 | 0 | 0 | 0 |
| Capital Expenditure | -619.8 | -787.8 | -342.2 | .0 | -252.7 | -477.1 | -514.8 | -555.3 | -599.1 | -646.4 |
| Capital Expenditure, % | -83.71 | -104.34 | -44.9 | 0 | -29.5 | -51.62 | -51.62 | -51.62 | -51.62 | -51.62 |
| Tax Rate, % | 1.33 | 1.33 | 1.33 | 1.33 | 1.33 | 1.33 | 1.33 | 1.33 | 1.33 | 1.33 |
| EBITAT | -74.9 | -84.8 | -179.2 | 187.4 | 169.5 | 1.0 | 1.1 | 1.2 | 1.3 | 1.4 |
| Depreciation | ||||||||||
| Changes in Account Receivables | ||||||||||
| Changes in Inventories | ||||||||||
| Changes in Accounts Payable | ||||||||||
| Capital Expenditure | ||||||||||
| UFCF | -283.1 | -300.0 | 39.7 | 474.5 | 258.7 | 115.0 | 91.9 | 99.2 | 107.0 | 115.5 |
| WACC, % | 6.51 | 6.55 | 6.98 | 6.96 | 6.96 | 6.79 | 6.79 | 6.79 | 6.79 | 6.79 |
| PV UFCF | ||||||||||
| SUM PV UFCF | 435.2 | |||||||||
| Long Term Growth Rate, % | 4.00 | |||||||||
| Free cash flow (T + 1) | 120 | |||||||||
| Terminal Value | 4,302 | |||||||||
| Present Terminal Value | 3,097 | |||||||||
| Enterprise Value | 3,532 | |||||||||
| Net Debt | 3,138 | |||||||||
| Equity Value | 394 | |||||||||
| Diluted Shares Outstanding, MM | 154 | |||||||||
| Equity Value Per Share | 2.56 |
What You Will Receive
- Authentic CUZ Financial Data: Pre-populated with Cousins Properties’ historical and forecasted data for accurate analysis.
- Completely Customizable Template: Easily adjust essential inputs like revenue growth, WACC, and EBITDA percentage.
- Instant Calculations: Watch the intrinsic value of CUZ update in real-time as you make adjustments.
- Expert Valuation Tool: Tailored for investors, analysts, and consultants aiming for precise DCF outcomes.
- Intuitive Design: Clear layout and straightforward instructions suitable for all skill levels.
Key Features
- Comprehensive DCF Calculator: Features detailed unlevered and levered DCF valuation models tailored for Cousins Properties Incorporated (CUZ).
- WACC Calculator: Pre-configured Weighted Average Cost of Capital sheet with adjustable inputs specific to CUZ.
- Customizable Forecast Assumptions: Easily adjust growth rates, capital expenditures, and discount rates for accurate projections.
- Integrated Financial Ratios: Evaluate profitability, leverage, and efficiency ratios for Cousins Properties Incorporated (CUZ).
- User-Friendly Dashboard and Charts: Visual representations summarize essential valuation metrics for straightforward analysis.
How It Works
- Step 1: Download the Excel file.
- Step 2: Review pre-entered Cousins Properties Incorporated (CUZ) data (historical and projected).
- Step 3: Adjust key assumptions (yellow cells) based on your analysis.
- Step 4: View automatic recalculations for Cousins Properties Incorporated's intrinsic value.
- Step 5: Use the outputs for investment decisions or reporting.
Why Choose This Calculator for Cousins Properties Incorporated (CUZ)?
- Accuracy: Utilizes real financial data from Cousins Properties for reliable results.
- Flexibility: Allows users to easily adjust and experiment with various inputs.
- Time-Saving: Eliminates the need to create a DCF model from the ground up.
- Professional-Grade: Crafted with the expertise and precision expected at the CFO level.
- User-Friendly: Intuitive interface suitable for users with all levels of financial modeling experience.
Who Should Use Cousins Properties Incorporated (CUZ)?
- Real Estate Investors: Make informed decisions with a reliable resource for property valuation.
- Market Analysts: Streamline your analysis with comprehensive data on commercial properties.
- Real Estate Consultants: Effortlessly customize reports for client engagements and presentations.
- Property Enthusiasts: Enhance your knowledge of real estate trends and investment strategies.
- Educators and Students: Utilize it as a practical tool for learning about real estate finance.
What the Template Contains
- Comprehensive DCF Model: Editable template featuring detailed valuation calculations.
- Real-World Data: Cousins Properties Incorporated’s (CUZ) historical and projected financials preloaded for analysis.
- Customizable Parameters: Adjust WACC, growth rates, and tax assumptions to explore different scenarios.
- Financial Statements: Complete annual and quarterly breakdowns for enhanced insights.
- Key Ratios: Integrated analysis for profitability, efficiency, and leverage metrics.
- Dashboard with Visual Outputs: Charts and tables providing clear, actionable results.
Disclaimer
All information, articles, and product details provided on this website are for general informational and educational purposes only. We do not claim any ownership over, nor do we intend to infringe upon, any trademarks, copyrights, logos, brand names, or other intellectual property mentioned or depicted on this site. Such intellectual property remains the property of its respective owners, and any references here are made solely for identification or informational purposes, without implying any affiliation, endorsement, or partnership.
We make no representations or warranties, express or implied, regarding the accuracy, completeness, or suitability of any content or products presented. Nothing on this website should be construed as legal, tax, investment, financial, medical, or other professional advice. In addition, no part of this site—including articles or product references—constitutes a solicitation, recommendation, endorsement, advertisement, or offer to buy or sell any securities, franchises, or other financial instruments, particularly in jurisdictions where such activity would be unlawful.
All content is of a general nature and may not address the specific circumstances of any individual or entity. It is not a substitute for professional advice or services. Any actions you take based on the information provided here are strictly at your own risk. You accept full responsibility for any decisions or outcomes arising from your use of this website and agree to release us from any liability in connection with your use of, or reliance upon, the content or products found herein.