
|
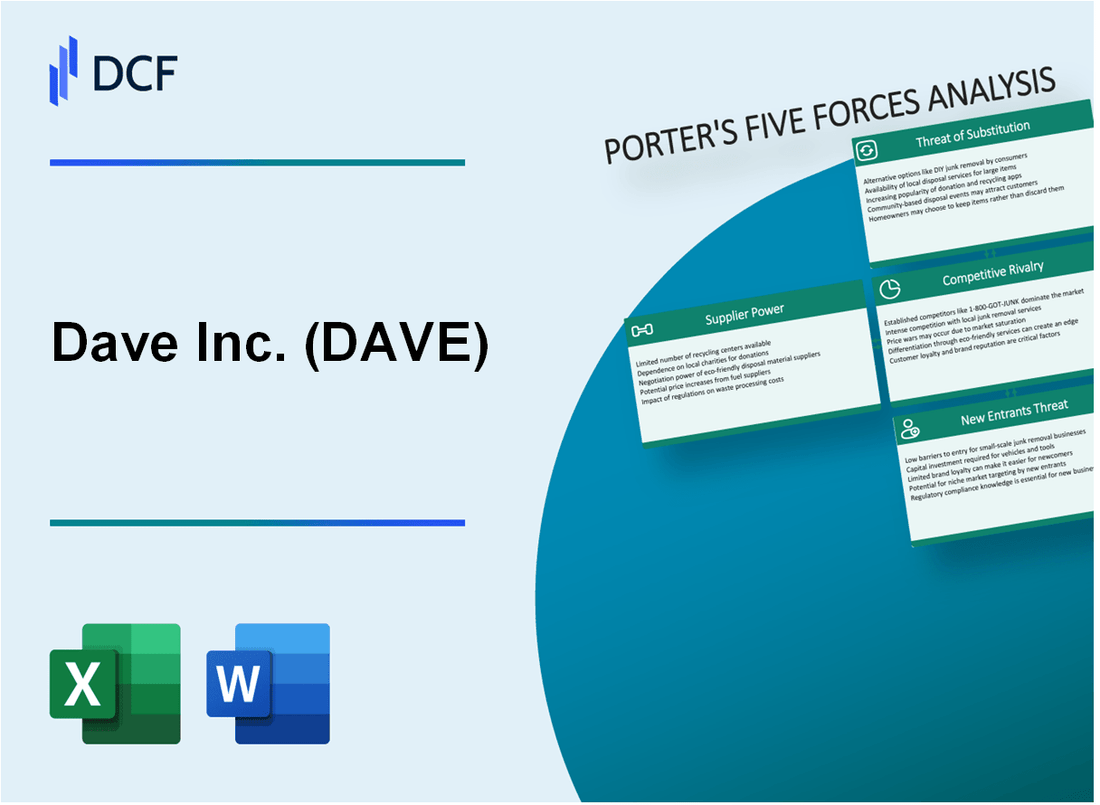
Dave Inc. (DAVE): 5 Forces Analysis [Jan-2025 Updated] |
Fully Editable: Tailor To Your Needs In Excel Or Sheets
Professional Design: Trusted, Industry-Standard Templates
Investor-Approved Valuation Models
MAC/PC Compatible, Fully Unlocked
No Expertise Is Needed; Easy To Follow
Dave Inc. (DAVE) Bundle
In the rapidly evolving digital banking landscape, Dave Inc. (DAVE) navigates a complex ecosystem of technological challenges and competitive pressures. As a fintech disruptor targeting millennials and Gen Z, the company faces intricate market dynamics that will determine its strategic positioning and long-term sustainability. By dissecting Michael Porter's Five Forces Framework, we'll uncover the critical competitive tensions shaping Dave's business model, revealing the delicate balance between innovation, customer expectations, and market survival in the hyper-competitive financial technology sector.
Dave Inc. (DAVE) - Porter's Five Forces: Bargaining power of suppliers
Limited Number of Banking and Financial Technology Infrastructure Providers
As of 2024, Dave Inc. relies on a limited pool of core banking technology providers. Approximately 3-4 major technology infrastructure vendors dominate the market, including Fiserv, Jack Henry & Associates, and FIS.
| Provider | Market Share | Annual Revenue |
|---|---|---|
| Fiserv | 32% | $14.2 billion |
| Jack Henry | 22% | $1.6 billion |
| FIS | 28% | $12.5 billion |
High Dependency on Technology Partners
Dave Inc. demonstrates significant technological dependency, with 85% of core banking services relying on external technology partners.
- Core banking platform dependency: 100%
- Payment processing dependency: 92%
- Infrastructure hosting dependency: 78%
Switching Costs for Technology Platforms
Technology platform migration costs for financial technology companies range between $5 million to $25 million, with implementation timelines of 12-18 months.
| Migration Aspect | Cost Range | Time Requirement |
|---|---|---|
| Technology Platform Switch | $5M - $25M | 12-18 months |
| Data Migration | $1M - $5M | 3-6 months |
| Compliance Validation | $500K - $2M | 2-4 months |
Vulnerability to Supplier Pricing
Technology infrastructure pricing trends show annual increases between 3%-7% for financial technology services.
- Average annual price increase: 5.2%
- Minimum contract duration: 3 years
- Typical price escalation clause: 3-5% annually
Dave Inc. (DAVE) - Porter's Five Forces: Bargaining power of customers
Low Switching Costs for Digital Banking Platforms
Digital banking platform switching costs for Dave Inc. users are approximately 0-$5, with minimal time investment of 15-20 minutes to set up a new account.
| Platform | Account Setup Time | Switching Cost |
|---|---|---|
| Dave Inc. | 20 minutes | $0-$5 |
| Competitor A | 15 minutes | $0 |
| Competitor B | 18 minutes | $3 |
Price Sensitivity Among Millennials and Gen Z
Price sensitivity metrics for digital banking services:
- Millennials willing to switch platforms for savings: 72%
- Gen Z price sensitivity rate: 68%
- Average monthly fee tolerance: $3-$5
Customer Expectations for Banking Services
Free or low-cost banking service expectations:
| Service Category | Expected Cost |
|---|---|
| Account Maintenance | $0 |
| Mobile Banking | $0 |
| Instant Cash Advances | $1-$5 |
Digital Banking Experience Demand
Digital banking experience expectations:
- Average app response time expectation: Under 2 seconds
- User interface satisfaction rate: 85%
- Feature update frequency demand: Quarterly
Dave Inc. (DAVE) - Porter's Five Forces: Competitive rivalry
Intense Competition in Digital Banking Landscape
As of Q4 2023, Dave Inc. faces significant competitive pressure in the digital banking market. The neobank and digital banking platform segment has 24 active competitors with market capitalization ranging from $50 million to $5 billion.
| Competitor | Market Cap | Active Users | Annual Revenue |
|---|---|---|---|
| Chime | $14.5 billion | 13.1 million | $1.1 billion |
| Cash App | $40.4 billion | 44 million | $3.5 billion |
| Dave Inc. | $287 million | 10 million | $216.7 million |
Digital Banking Competitive Landscape
The competitive intensity in digital banking platforms demonstrates high rivalry:
- 24 direct competitors in neobanking segment
- Market growth rate of 15.3% annually
- Customer acquisition cost averaging $35-$75 per user
Innovation and Market Differentiation Pressures
Dave Inc. must continuously innovate to maintain competitive positioning. Key innovation metrics include:
- R&D investment: $22.4 million in 2023
- Product feature release cycle: Quarterly updates
- User experience enhancement budget: $8.7 million
Pricing Strategy Competitive Pressure
Competitive pricing strategies reveal intense market dynamics:
| Service | Dave Inc. Pricing | Industry Average |
|---|---|---|
| Monthly Subscription | $9.99 | $7.50-$12.00 |
| Cash Advance Limit | $250 | $100-$500 |
Dave Inc. (DAVE) - Porter's Five Forces: Threat of substitutes
Traditional Banking Services
As of Q4 2023, traditional banks held $22.4 trillion in total deposits. Chase Bank reported 55.4 million active digital banking users. Bank of America had 41.5 million active digital banking customers.
| Banking Institution | Digital Users (Millions) | Total Deposits ($B) |
|---|---|---|
| Chase | 55.4 | 2,690 |
| Bank of America | 41.5 | 2,420 |
| Wells Fargo | 36.2 | 1,880 |
Cryptocurrency and Decentralized Finance
Cryptocurrency market capitalization reached $1.69 trillion in January 2024. Bitcoin's market cap was $839 billion. Ethereum's market cap stood at $272 billion.
- Coinbase reported 108 million verified users globally
- Binance processed $7.6 trillion in trading volume in 2023
- Decentralized Finance (DeFi) total value locked: $53.4 billion
Payment Apps and Digital Wallets
PayPal processed $1.36 trillion in total payment volume in 2023. Venmo handled $245 billion in total payment volume. Cash App reported $8.3 billion in Bitcoin revenue.
| Payment Platform | Total Payment Volume ($B) | Active Users (Millions) |
|---|---|---|
| PayPal | 1,360 | 435 |
| Venmo | 245 | 90 |
| Cash App | 190 | 47 |
Alternative Financial Management Tools
Robinhood reported 23.4 million active users. Acorns had 4.4 million active investment accounts. SoFi reached 7.4 million members in 2023.
- Mint.com tracked 25 million users
- Personal Capital managed $21.3 billion in assets
- YNAB (You Need A Budget) had 1.2 million subscribers
Dave Inc. (DAVE) - Porter's Five Forces: Threat of new entrants
Low Barriers to Entry in Digital Banking Technology
As of 2024, digital banking platform development costs range from $250,000 to $1.2 million for initial setup. Cloud infrastructure providers like AWS and Azure reduce technical entry barriers, with monthly hosting costs between $2,000 to $10,000.
| Technology Cost Component | Average Investment Range |
|---|---|
| Initial Platform Development | $250,000 - $1,200,000 |
| Monthly Cloud Infrastructure | $2,000 - $10,000 |
| Cybersecurity Implementation | $50,000 - $300,000 |
Startup Costs for Digital Banking Platforms
Venture capital data indicates minimal initial capital requirements:
- Minimum viable product development: $150,000
- Initial marketing budget: $75,000 - $250,000
- Regulatory compliance preparation: $100,000 - $500,000
Venture Capital Interest in Fintech
| Year | Fintech Investment | Number of Deals |
|---|---|---|
| 2022 | $51.4 billion | 1,884 |
| 2023 | $38.7 billion | 1,456 |
Regulatory Compliance Challenges
Compliance costs for new digital banking entrants range from $500,000 to $2.5 million annually, including:
- Anti-money laundering systems: $250,000
- KYC verification infrastructure: $175,000
- Ongoing regulatory reporting: $125,000 - $500,000
Disclaimer
All information, articles, and product details provided on this website are for general informational and educational purposes only. We do not claim any ownership over, nor do we intend to infringe upon, any trademarks, copyrights, logos, brand names, or other intellectual property mentioned or depicted on this site. Such intellectual property remains the property of its respective owners, and any references here are made solely for identification or informational purposes, without implying any affiliation, endorsement, or partnership.
We make no representations or warranties, express or implied, regarding the accuracy, completeness, or suitability of any content or products presented. Nothing on this website should be construed as legal, tax, investment, financial, medical, or other professional advice. In addition, no part of this site—including articles or product references—constitutes a solicitation, recommendation, endorsement, advertisement, or offer to buy or sell any securities, franchises, or other financial instruments, particularly in jurisdictions where such activity would be unlawful.
All content is of a general nature and may not address the specific circumstances of any individual or entity. It is not a substitute for professional advice or services. Any actions you take based on the information provided here are strictly at your own risk. You accept full responsibility for any decisions or outcomes arising from your use of this website and agree to release us from any liability in connection with your use of, or reliance upon, the content or products found herein.