
|
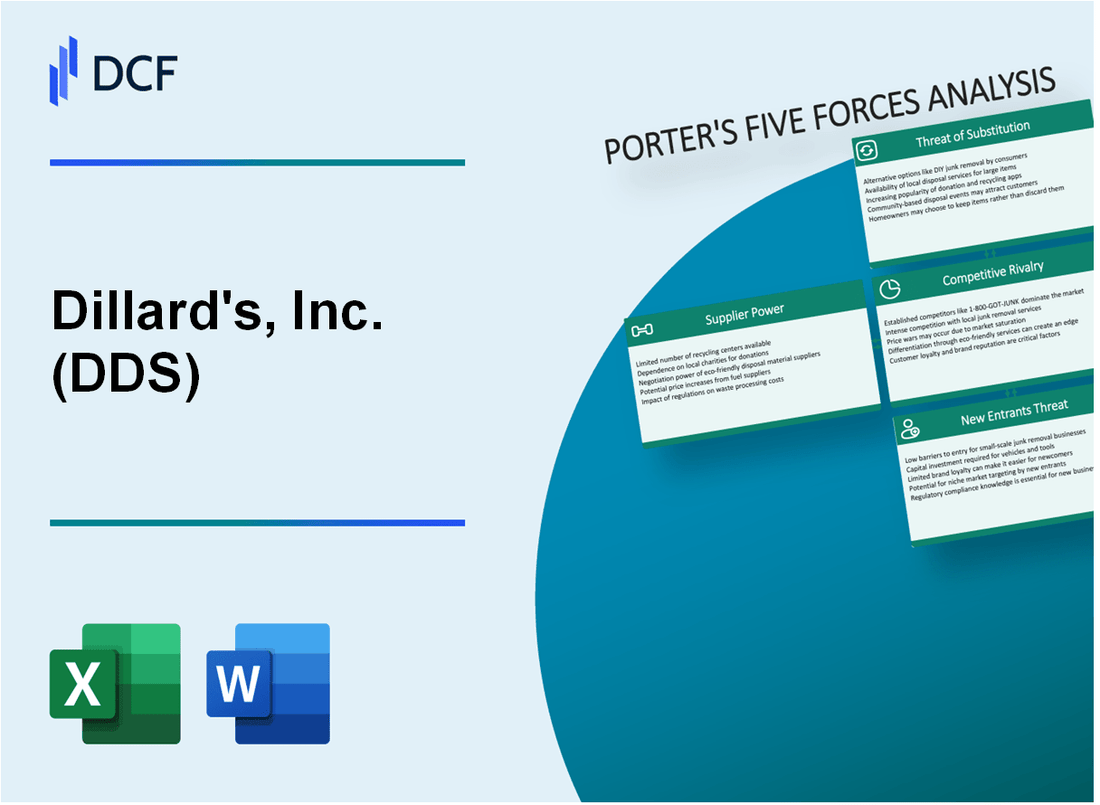
Dillard's, Inc. (DDS): 5 FORCES Analysis [Nov-2025 Updated] |
Fully Editable: Tailor To Your Needs In Excel Or Sheets
Professional Design: Trusted, Industry-Standard Templates
Investor-Approved Valuation Models
MAC/PC Compatible, Fully Unlocked
No Expertise Is Needed; Easy To Follow
Dillard's, Inc. (DDS) Bundle
You're trying to map out exactly where Dillard's, Inc. stands in this brutal retail environment, and frankly, the numbers from the fiscal year ended February 2025 tell a clear story of pressure. As someone who's spent two decades in this game, I can tell you that while Dillard's maintains strong supplier leverage thanks to a balance sheet boasting over $1 billion in cash early in 2025, the customer side is tough, evidenced by a 7% sales decline in fiscal 2024. We need to see how this financial muscle counters the extreme rivalry-which saw comparable sales drop 3%-and the high threat from substitutes like off-price retailers, all laid out across the five forces framework. Dive in below; we'll break down the risks and where Dillard's, Inc. has a fighting chance against the competition across its 272 stores.
Dillard's, Inc. (DDS) - Porter's Five Forces: Bargaining power of suppliers
When you look at Dillard's, Inc.'s relationship with its vendors, the bargaining power of suppliers generally leans toward the lower end of the spectrum. This isn't an accident; it's the result of deliberate, long-term strategy, especially given the current retail environment.
Honestly, Dillard's, Inc. has built a structure that keeps its suppliers on their toes. They don't put all their eggs in one basket with any single source. We see evidence of this in their operational philosophy, which is key to maintaining leverage in negotiations.
Here are the core elements that keep supplier power in check for Dillard's, Inc.:
- Low reliance on single vendors; Dillard's buys from many sources.
- No long-term purchase commitments, providing flexibility in sourcing.
- Strong private-label program, like Antonio Melani, reduces dependence on major brands.
The private-label strategy is defintely a major lever here. By developing exclusive, high-quality brands, Dillard's, Inc. creates its own supply source that national brands cannot compete with directly on the sales floor. For instance, exclusive lines such as Natalie Simkins x Antonio Melani footwear give the company unique inventory that drives traffic, meaning those major brands have to compete for shelf space against Dillard's, Inc.'s own successful offerings.
Also, consider the financial muscle Dillard's, Inc. brings to the table. A strong balance sheet means they can dictate payment terms, which suppliers, especially smaller ones, are often eager to accept for guaranteed business. As of November 1, 2025, Dillard's, Inc. maintained a fortress balance sheet, reporting cash and equivalents of $1.15 billion.
Here's a quick look at how these factors translate into leverage:
| Supplier Power Factor | Dillard's, Inc. Posture (Late 2025) | Impact on Supplier Power |
|---|---|---|
| Vendor Concentration | Purchases merchandise from many sources. | Lowers power; easy to switch suppliers. |
| Contractual Lock-in | No long-term purchase commitments exist. | Increases sourcing flexibility and negotiation strength. |
| Differentiation/Private Label | Strong exclusive brands like Antonio Melani. | Reduces dependence on national brand exclusivity. |
| Financial Strength (Payment Terms) | Cash and equivalents of $1.15 billion (as of Nov 1, 2025). | Strong ability to demand favorable terms. |
The lack of long-term purchase commitments is crucial. It means Dillard's, Inc. can pivot quickly if a supplier raises prices or quality slips, without being legally tied down. This flexibility is a significant advantage when negotiating the cost of goods sold.
To be fair, Dillard's, Inc. still needs its key brand partners to draw in the fashion-motivated customer. However, the company's operational discipline and deep cash reserves ensure that the relationship remains mutually beneficial, rather than one where suppliers hold the upper hand.
Finance: review Q4 2025 inventory turnover against supplier lead times by next Tuesday.
Dillard's, Inc. (DDS) - Porter's Five Forces: Bargaining power of customers
You're looking at Dillard's, Inc. (DDS) through the lens of buyer power, and honestly, the picture shows customers hold significant sway right now. This high power stems directly from the brutal retail competition we see everywhere and the fact that switching to another department store or online retailer costs a customer virtually nothing. It's a tough spot for any retailer, especially one operating 272 stores across 30 states as of late 2025.
The market dynamics suggest Dillard's has been willing to absorb margin pressure to keep shoppers coming through the doors or clicking online. When the CEO noted, "With sales down 1%, we worked on controlling expenses but lost some steam in gross margin," that signals a trade-off where customer price/value perception is dictating terms. This pressure is evident in the financials from the fiscal year ending February 1, 2025 (fiscal 2024).
Here's a quick look at the top-line results from fiscal 2024, which really frame the customer environment:
| Metric | Fiscal 2024 (Ended Feb 1, 2025) | Fiscal 2023 |
|---|---|---|
| Net Sales | $6.483 billion | $6.752 billion |
| Total Retail Sales | $6.219 billion | Implied higher than $6.219B |
| Comparable Store Sales Change | Decreased 3% | N/A |
| Net Income | $593.5 million | $738.8 million |
| Retail Gross Margin | 41.0% of sales | 41.8% of sales |
The data clearly shows customer demand weakness impacting volume. For the 52 weeks ended February 1, 2025, the number of sales transactions actually dropped by 7%. That's a significant volume contraction, even though the average dollars per transaction managed to tick up by 3%. You see, customers are buying less often, which is the classic sign of buyers holding back or finding alternatives.
The ease of comparison is a major factor empowering these customers. They don't just check the store down the street; they are comparing across Dillard's 272 physical locations and the entire digital marketplace simultaneously. This means Dillard's has to work harder on assortment and service to justify its price point.
The power dynamic is further illustrated by the operational focus areas:
- Comparable store sales fell 3% in fiscal 2024.
- Retail gross margin compressed to 41.0% from 41.8% the prior year.
- Operating expenses as a percentage of sales rose to 26.7% from 25.4%.
- Net income fell to $593.5 million from $738.8 million year-over-year.
When you see sales volume drop by 7% in transactions, and margins thin out, it's the customer voting with their wallet, forcing Dillard's to fight for every dollar. Finance: draft 13-week cash view by Friday.
Dillard's, Inc. (DDS) - Porter's Five Forces: Competitive rivalry
You're looking at Dillard's, Inc. (DDS) and wondering how it stacks up against the heavyweights. The competitive rivalry here isn't just high; it's a constant, grinding pressure cooker. You're definitely facing an extremely high rivalry among traditional department stores like Macy's and Nordstrom, but the real game-changer is the persistent threat from e-commerce giants like Amazon.
This pressure shows up directly in the top-line numbers. For the fiscal year ended February 1, 2025, Dillard's saw comparable store sales decline by 3%. That drop signals clear market share pressure; when the overall market isn't growing, a decline means competitors are taking a bigger slice of the pie. Honestly, that's a tough environment to navigate.
The margin structure is where this rivalry bites hardest. Dillard's reported a retail gross margin of 41.0% of sales for the fiscal year ended February 1, 2025. That figure is vulnerable to competitor price wars. If a major rival decides to aggressively discount key categories-say, men's apparel and accessories or shoes, which underperformed for Dillard's in Q4-Dillard's must either match the price, sacrificing margin, or risk losing the sale.
The intensity is only ramped up because the US retail market itself is mature and saturated. It's not about finding new customers; it's about stealing existing ones. Here's a quick look at Dillard's scale against that backdrop:
| Metric (FY Ended Feb 1, 2025) | Value |
|---|---|
| Net Sales | $6.483 billion |
| Retail Gross Margin | 41.0% |
| Net Income | $593.5 million |
| Total Stores (Incl. Clearance Centers) | 272 |
To be fair, Dillard's has managed to maintain a strong balance sheet, ending the year with over $1 billion in cash and short-term investments. Still, the competitive landscape demands constant vigilance on inventory and pricing strategy.
The competitive dynamics manifest in several ways you need to watch:
- Comparable store sales fell 3% year-over-year for FY2024.
- Operating expenses rose to 26.7% of sales in FY2024 from 25.4% the prior year.
- The company repurchased $535 million in shareholder returns during the year.
- Q4 2024 saw comparable sales drop by 1% on a 13-week comparison.
- The largest special dividend in history, $25.00 per share, was paid in January 2025.
The pressure is real, and it forces Dillard's to focus intensely on what they control, like expense management, which they highlighted when commenting on sales being down. If onboarding takes 14+ days, churn risk rises, and in this rivalry, slow execution means lost sales to Amazon or Macy's.
Dillard's, Inc. (DDS) - Porter's Five Forces: Threat of substitutes
The threat of substitutes for Dillard's, Inc. remains substantial, driven by changing consumer priorities and the aggressive value proposition from alternative retail formats. You see this pressure clearly when looking at the comparative performance across the sector.
The high threat from off-price retailers is evident in their Q3 2025 performance. Value-focused players like TJX Companies, which owns T.J. Maxx and Marshalls, put up impressive Q3 results and subsequently raised guidance for FY 2025. This success capitalizes on consumers trading down from mid-tier stores due to persistent economic uncertainty. Dillard's, Inc. itself experienced weaker performance in certain categories; for instance, home and furniture was cited as a weaker performing category in its first quarter of 2025 results. This dynamic forces Dillard's, Inc. to compete directly on value against these thriving discounters.
A significant portion of consumer spending is actively moving away from traditional apparel and department store offerings. Retail executives surveyed expected that 80% of consumers would prefer spending on experiences over goods in 2025. This shift is reflected in broader spending forecasts, where projected year-over-year growth for Q4 2025 slowed to just 3.7%, down from 5.7% in 2024. Still, consumers are being deliberate; while overall spending growth slowed, clicks increased 18% and orders rose 12% year-over-year in the first half of 2025, even as total spending grew only 0.4%. This suggests consumers are researching more but buying less discretionary, high-ticket apparel.
Pure-play e-commerce platforms and fast-fashion brands present a major substitution risk, especially given their year-round deal structures. E-commerce penetration reached a record 14.3% of total retail spend as of May 2025. Amazon, the dominant platform, is the go-to destination for Cyber Week, with 94% of shoppers planning to use it. The growth of other online giants is also notable; Amazon and Temu each gained 900,000 shoppers in the last year, while Shein added 600,000 new buyers, according to Roy Morgan data.
The pressure to discount remains a critical factor influencing Dillard's, Inc.'s pricing strategy. For Black Friday 2025, the discount penetration across the sector was reported at 59%, a figure Dillard's, Inc. also maintained. This level, while the lowest since 2016, still signifies that nearly three-fifths of merchandise is on sale to capture value-conscious shoppers.
Here is a quick look at the competitive landscape metrics influencing substitution:
| Metric | Value/Rate | Context |
| Black Friday 2025 Discount Penetration | 59% | Sector-wide pressure point, maintained by Dillard's, Inc. |
| Expected Consumer Preference for Experiences over Goods (2025) | 80% | Indicates a shift away from physical goods spending. |
| Projected Q4 2025 Spending Growth YoY | 3.7% | Slowing growth compared to 5.7% in 2024. |
| E-commerce Penetration of Total Retail Spend (May 2025) | 14.3% | Record high for online channel share. |
| TJX Companies (Off-Price) Q3 2025 Guidance | Raised | Indicates strength in the value/off-price segment. |
The substitution threat is multifaceted, coming from both price-driven off-price channels and experience-driven consumer behavior. You need to watch how Dillard's, Inc. manages its inventory mix, especially in categories like home goods, which are lagging.
- Home and furniture was a weaker category in Dillard's, Inc. Q1 2025 sales.
- TJX Companies reported impressive Q3 results for FY 2025.
- Amazon is used by 94% of shoppers during Cyber Week 2025.
- Consumer clicks increased 18% YoY in H1 2025, but spending grew only 0.4%.
- Dillard's, Inc. Q2 2025 comparable store sales increased 1%.
Dillard's, Inc. (DDS) - Porter's Five Forces: Threat of new entrants
The threat of new entrants for Dillard's, Inc. remains moderate, largely due to the significant sunk costs associated with physical retail infrastructure. You can't just open a store overnight; it requires massive capital commitment. Dillard's, Inc. maintains a footprint of 272 physical stores across 30 states as of early 2025. Establishing a comparable physical presence means facing high initial outlay. For instance, general in-line retail fit-out costs average around $155 per square foot nationally, but premium lifestyle centers can push build-out costs up to $580 per square foot. Even Dillard's, Inc.'s projected capital expenditure for all of FY25 is set at $120 million, illustrating the ongoing investment required just to maintain and refresh existing assets, let alone build new ones.
New players must also contend with the scale of Dillard's, Inc.'s established revenue base and the associated supply chain leverage. Competing against the $6.483 billion in annual net sales recorded in Fiscal Year 2024 is a tall order. To match the brand equity Dillard's, Inc. has built, new entrants must absorb substantial branding and inventory costs. Consider that Dillard's, Inc.'s own exclusive brand merchandise accounted for 22.7% of total net sales in FY2024, showing the importance of proprietary, high-margin product lines that new entrants lack.
However, the digital landscape definitely lowers the barrier for niche, digital-native brands. These players can bypass the massive real estate capital outlay entirely. Dillard's, Inc. itself generated $804 million in revenue from its online store, dillards.com, in 2024, proving the viability of the digital channel. A digital-first competitor can start with minimal overhead, focusing capital instead on targeted digital marketing and inventory acquisition, which is a distinct advantage against the legacy department store model.
Still, new players must work hard to overcome the established customer loyalty Dillard's, Inc. has cultivated. Loyalty is incredibly sticky and profitable; loyal customers spend 67% more on average than new customers. Furthermore, general industry data suggests that a mere 5% increase in customer retention can boost profits by 25% to 95%. This high value of retention means that acquisition-the primary focus of a new entrant-is significantly more expensive. Acquiring a new customer is consistently found to be 5 to 25 times more expensive than retaining an existing one.
Here's a quick look at the cost differential a new entrant faces when choosing between physical and digital entry:
| Barrier Component | Dillard's, Inc. Scale/Cost Reference | Implication for New Entrant |
|---|---|---|
| Physical Footprint Investment | 272 stores across 30 states | Requires multi-million dollar capital outlay; high fixed costs. |
| Construction Cost Benchmark | Fit-out costs average $155 per square foot | Significant upfront cost to establish a single location. |
| Annual Sales Scale | FY 2024 Net Sales of $6.483 billion | Requires massive supply chain investment and purchasing power. |
| Digital Revenue Benchmark | dillards.com revenue of $804 million in 2024 | Digital entry is cheaper, but scale requires substantial marketing spend to compete. |
The established customer base presents a loyalty hurdle that new entrants must clear through superior value or experience. Consider these general loyalty metrics:
- Loyal customers spend 67% more than new ones.
- Acquisition costs are 5 to 25 times higher than retention costs.
- A 5% retention increase can boost profits by 25% to 95%.
- 68% of consumers remain loyal to certain brands in 2025.
- Dillard's, Inc.'s exclusive brands accounted for 22.7% of FY2024 sales.
Disclaimer
All information, articles, and product details provided on this website are for general informational and educational purposes only. We do not claim any ownership over, nor do we intend to infringe upon, any trademarks, copyrights, logos, brand names, or other intellectual property mentioned or depicted on this site. Such intellectual property remains the property of its respective owners, and any references here are made solely for identification or informational purposes, without implying any affiliation, endorsement, or partnership.
We make no representations or warranties, express or implied, regarding the accuracy, completeness, or suitability of any content or products presented. Nothing on this website should be construed as legal, tax, investment, financial, medical, or other professional advice. In addition, no part of this site—including articles or product references—constitutes a solicitation, recommendation, endorsement, advertisement, or offer to buy or sell any securities, franchises, or other financial instruments, particularly in jurisdictions where such activity would be unlawful.
All content is of a general nature and may not address the specific circumstances of any individual or entity. It is not a substitute for professional advice or services. Any actions you take based on the information provided here are strictly at your own risk. You accept full responsibility for any decisions or outcomes arising from your use of this website and agree to release us from any liability in connection with your use of, or reliance upon, the content or products found herein.