|
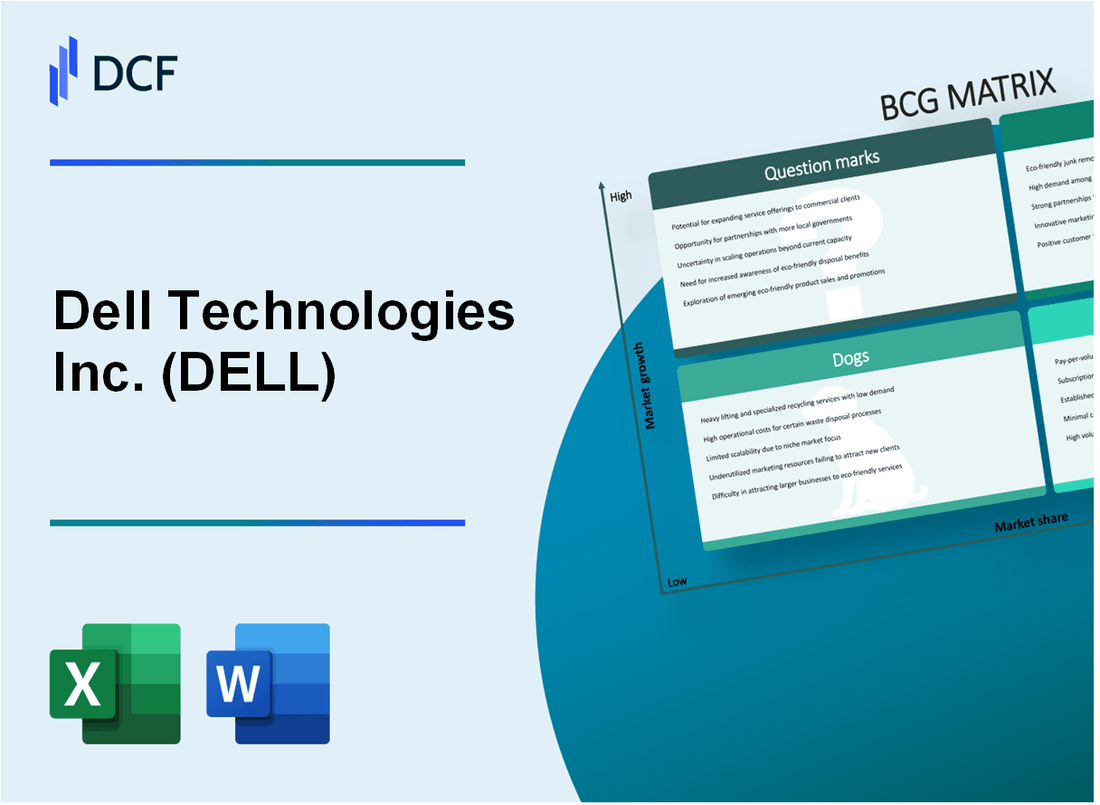
Dell Technologies Inc. (DELL): BCG Matrix [Dec-2025 Updated] |
Fully Editable: Tailor To Your Needs In Excel Or Sheets
Professional Design: Trusted, Industry-Standard Templates
Investor-Approved Valuation Models
MAC/PC Compatible, Fully Unlocked
No Expertise Is Needed; Easy To Follow
Dell Technologies Inc. (DELL) Bundle
You're looking for a clear-eyed view of where Dell Technologies Inc. is placing its bets right now, and the BCG Matrix is defintely the right tool to map their portfolio's health. Honestly, the story is clear: explosive growth in AI-Optimized Servers, backed by a record $18.4 billion backlog, is powering the 'Stars,' while the Commercial Client Solutions Group provides the stable, high-margin cash flow you expect from 'Cows' at $10.6 billion in Q3 revenue. Still, we need to watch the declining Consumer segment and those high-potential but unproven 'Question Marks' like Telecom Infrastructure-let's dive into the specifics of what to hold, what to prune, and where the next decade of profit is hiding.
Background of Dell Technologies Inc. (DELL)
You're looking at Dell Technologies Inc. (DELL), a major player that has successfully navigated the shift from a PC-centric company to a broad infrastructure provider. The company organizes its operations primarily into two major segments: the Infrastructure Solutions Group (ISG), which handles data center solutions, servers, and storage, and the Client Solutions Group (CSG), which covers their well-known PCs, laptops, and workstations. Honestly, the story of Dell Technologies lately is all about the pivot toward high-growth, high-margin infrastructure, especially with the AI boom.
To give you a sense of scale as of the last full reporting period, Dell Technologies finished its fiscal 2025 with total annual revenue hitting $95.6 billion, marking an 8% year-over-year increase. That performance led to record full-year diluted earnings per share of $6.38, up 39% from the prior year, showing they were effectively unlocking efficiencies. They also signaled confidence by announcing an 18% increase in their annual cash dividend.
Looking at the very latest operational snapshot, the third quarter of fiscal 2026 (which ended in October 2025) shows this trend accelerating. Total revenue for that quarter reached a record $27.0 billion, which is 11% higher than the same quarter last year. The real engine here is ISG; its revenue surged to $14.1 billion, up 24% year-over-year, driven by record Servers and Networking sales of $10.1 billion, a 37% jump. The AI momentum is clear: Dell Technologies booked $12.3 billion in AI server orders in that single quarter, bringing year-to-date orders to an unprecedented $30 billion.
Still, the picture isn't perfectly uniform across the board. While ISG is booming, the Storage revenue within that group was $4.0 billion, actually down 1% year-over-year, suggesting customers are prioritizing compute power over traditional storage builds right now. On the other side, the Client Solutions Group (CSG) posted revenue of $12.5 billion in Q3 FY2026, a modest 3% increase, which is a positive turnaround after some tougher periods. Management is definitely bullish, raising the full-year fiscal 2026 revenue guidance to $111.7 billion, which implies 17% growth for the year.
Dell Technologies Inc. (DELL) - BCG Matrix: Stars
You're looking at the engine room of Dell Technologies Inc.'s current growth story, which is squarely in the Stars quadrant of the Boston Consulting Group Matrix. These are the business units commanding a high market share in markets that are expanding rapidly, so they demand heavy investment to maintain that lead. Honestly, the numbers coming out of the Infrastructure Solutions Group (ISG) related to artificial intelligence infrastructure show just how much cash is being poured in to feed this growth, which is exactly what a Star requires.
The AI-Optimized Servers segment is the clearest example here. Dell Technologies is projecting shipments of roughly $25 billion for fiscal year 2026, which represents an increase of over 150% year-over-year. That's explosive market growth, and Dell is positioning itself as a leader. This momentum is built on massive order intake; they booked an unprecedented $30 billion in AI server orders year-to-date as of Q3 FY2026, with $12.3 billion of that coming in just the third quarter. You see this translating directly into the segment's top-line performance.
The broader Infrastructure Solutions Group (ISG) revenue, which houses these AI components, hit a record $14.1 billion in Q3 FY2026, up 24% year-over-year. Specifically, the Servers and Networking component, which is the core of the AI build-out, generated a Q3 FY2026 revenue of $10.1 billion, marking a 37% jump from the prior year. This segment is definitely leading the charge, even though the Storage revenue was down 1% to $4.0 billion for the quarter.
To secure this future growth, Dell Technologies is sitting on a record AI server backlog of $18.4 billion exiting Q3 FY2026. This backlog, combined with a pipeline described as multiples of that figure, shows the near-term revenue visibility is extremely strong, which is the goal for any Star product line. If Dell can sustain this success as the overall market growth rate eventually slows, this business unit is definitely on the path to becoming a Cash Cow.
Here are the key financial metrics defining the Star status for these high-growth areas:
- FY2026 AI Server Shipment Guidance: approximately $25 billion.
- Year-over-Year AI Shipment Growth: over 150%.
- Q3 FY2026 AI Server Shipments: $5.6 billion.
- Record AI Server Backlog (Exiting Q3 FY2026): $18.4 billion.
The core performance indicators for the ISG Servers and Networking unit, which is driving the Star narrative, are best summarized like this:
| Metric | Q3 FY2026 Value | Year-over-Year Change |
|---|---|---|
| ISG Revenue | $14.1 billion | 24% increase |
| Servers and Networking Revenue | $10.1 billion | 37% increase |
| Storage Revenue | $4.0 billion | 1% decrease |
| ISG Operating Income | $1.7 billion | 16% increase |
The focus on High-Performance Computing (HPC) Solutions is evident in the company's ability to engineer bespoke, large, complex clusters rapidly. This capability allows Dell to capitalize on the demand for these massive computational resources needed for cutting-edge AI and scientific workloads. The fact that they can get AI racks operational within 24 to 36 hours of delivery with uptimes topping 99% speaks directly to the execution required to maintain a leadership position in this high-growth, high-share space. Finance: draft 13-week cash view by Friday.
Dell Technologies Inc. (DELL) - BCG Matrix: Cash Cows
You're looking at the bedrock of Dell Technologies Inc.'s financial stability, the units that generate more cash than they consume, allowing the rest of the portfolio to chase growth. These Cash Cows operate in mature, slower-growing markets but command significant market share, which translates directly into high margins and predictable cash flow.
The Commercial Client Solutions Group (CSG) is a prime example of this stability. Its commercial segment provides the consistent volume you need to manage overhead. For the third quarter of fiscal year 2026, the Commercial Client Solutions Group (CSG) posted revenue of $10.6 billion, marking a 5% increase year-over-year. This growth in the commercial space, even as the consumer side dipped 7% to $1.9 billion, shows where the reliable, mature demand lies.
Within the Infrastructure Solutions Group (ISG), the core storage and traditional server business units fit this profile perfectly, even as the overall ISG group is seeing massive AI-driven growth. The Core Storage Portfolio, which includes products like PowerStore and PowerScale, is a market leader that requires minimal disruptive investment to maintain its position. This segment delivered revenue of $4.0 billion in Q3 FY2026, showing a slight contraction of 1%, which is typical for a mature, high-share product line where you are focused on milking gains rather than aggressive expansion.
For Traditional Enterprise Servers (Non-AI), we look at the total Servers and Networking revenue, which hit a Q3 record of $10.1 billion, up 37% year-over-year. However, the AI server component accounted for $5.6 billion of that total in Q3. This means the traditional, non-AI x86 compute refresh cycle-the classic Cash Cow-still contributed a substantial, stable base, which analysts noted grew double-digits year-over-year for the fifth consecutive quarter. The cash generated here funds the Question Marks.
The overall financial health supports this 'milking' strategy. Dell Technologies generated $1.2 billion in cash flow from operations for the quarter. Furthermore, the company returned $1.6 billion to shareholders in Q3 via dividends and buybacks, demonstrating that these mature units are successfully funding capital returns.
Here is the breakdown of the key revenue contributors that fit the Cash Cow profile:
| Business Unit Component | Q3 FY2026 Revenue Amount | Year-over-Year Change |
| Commercial Client Solutions Group (CSG) | $10.6 billion | Up 5% |
| Core Storage Portfolio | $4.0 billion | Down 1% |
| Servers and Networking (Total ISG Compute) | $10.1 billion | Up 37% |
| Estimated Traditional (Non-AI) Servers/Networking | Approximately $4.5 billion | Contextual |
The Managed Services and Support stream, while not broken out with a specific revenue number in the Q3 release, is inherently tied to the high-margin, recurring revenue from maintaining this vast installed base. This stream requires minimal new investment to support, helping to drive the overall ISG operating income up 16% year-over-year to $1.7 billion.
You should focus on maintaining the efficiency of these units because they are the financial engine:
- CSG Commercial: Maintain strong enterprise relationships for steady volume.
- Core Storage: Protect margins on the existing installed base.
- Non-AI Servers: Ensure efficient support for the stable replacement cycle.
- Support Contracts: Maximize renewal rates for predictable cash inflow.
The company is committed to shareholder returns, targeting growth of quarterly dividends 10% or more annually through fiscal 2030, which is directly supported by the cash these mature businesses generate.
Finance: draft 13-week cash view by Friday.
Dell Technologies Inc. (DELL) - BCG Matrix: Dogs
Dogs are business units or products characterized by a low market share within a market that is experiencing low growth. These areas frequently break even, tying up capital without providing significant returns, making divestiture a common strategic consideration. For Dell Technologies, the Dog quadrant is primarily represented by segments struggling against secular trends or intense commoditization.
Consumer Client Solutions Group (CSG) represents a clear candidate for this quadrant, particularly the consumer-facing portion. While the overall Client Solutions Group (CSG) revenue was $12.5 billion in Q3 FY2026, marking a 3% year-over-year increase, this growth is heavily skewed by the commercial side. The consumer segment itself is lagging significantly, reflecting low market share and declining segment growth dynamics.
Here is the breakdown of the Client Solutions Group performance for Q3 FY2026:
| Metric | Value | Year-over-Year Change |
| Total CSG Revenue | $12.5 billion | Up 3% |
| Commercial Client Revenue | $10.6 billion | Up 5% |
| Consumer Revenue | $1.9 billion | Down 7% |
| CSG Operating Income | $748 million | Flat |
The Consumer Client Solutions Group (CSG): Q3 FY2026 consumer revenue was $1.9 billion, down 7% year-over-year, reflecting low market share and declining segment growth. This segment is clearly in the Dog category, as its performance drags on the overall CSG unit, which grew only 3% overall, compared to the Infrastructure Solutions Group (ISG) growth of 24% in the same period. Honestly, you can see the split clearly in the numbers.
Legacy IT Services: Offerings tied to older, on-premise infrastructure models face secular decline as clients shift to cloud and modern hybrid models. While Dell Technologies is winning big in AI servers, other parts of the Infrastructure Solutions Group (ISG) are clearly struggling to maintain momentum. Specifically, the Storage revenue component, which often includes legacy and hybrid systems, was reported at $4.0 billion (or $3.98 billion) in Q3 FY2026, representing a decline of 1% year-over-year. This flatness or slight decline in a major infrastructure component suggests that the transition away from older models is actively consuming resources without yielding growth.
Low-End PC/Laptop Models: These are highly commoditized products with razor-thin margins and intense price competition in a saturated market. Dell Technologies' overall PC market share in the global PC unit shipments is ranked third, behind both Lenovo and HP. The company's strategy has increasingly focused on commercial PCs, workstations, and high-end consumer/gaming, implicitly de-emphasizing the low-end. The overall CSG revenue growth of 3% in Q3 FY2026 highlights this stagnation compared to the explosive growth elsewhere. You're definitely seeing the pressure where price is the main differentiator.
- The company is ranked third in global PC unit shipments.
- Consumer revenue for CSG declined by 7% in Q3 FY2026.
- The focus is shifting to Commercial PCs and high-end consumer units.
Dell Technologies Inc. (DELL) - BCG Matrix: Question Marks
You're looking at the areas of Dell Technologies Inc. where the market is hot, but the company's current slice of that market is still small. These are the Question Marks-they burn cash now but could become the next big thing, the Stars, if you pour in the right investment.
Multi-Cloud and Edge Solutions
The market for hybrid cloud and edge solutions is definitely growing, which is why this area fits the Question Mark profile. While Dell Technologies is a leader in the broader server market, commanding an impressive 19.3% market share in 2025, its relative share in the specific, rapidly evolving multi-cloud and edge segments remains smaller compared to the hyperscaler giants. The Infrastructure Solutions Group (ISG) revenue for Q3 Fiscal Year 2026 was $14.1 billion, up 24% year over year, showing strong overall momentum, but the specific contribution and market penetration of pure-play Multi-Cloud and Edge offerings need rapid scaling to avoid stagnation.
Here's a look at the competitive landscape where Dell Technologies is fighting for share:
| Competitor | 2025 Server Market Share |
|---|---|
| Dell Technologies Inc. | 19.3% |
| Hewlett Packard Enterprise (HPE) | 13% |
| IBM | 3.2% |
These new solutions require heavy investment to capture mindshare. If they don't gain traction quickly, they risk becoming Dogs.
Telecom/5G Infrastructure
The 5G Infrastructure Equipment market is projected to be worth $47.44 billion in 2025, showing massive growth potential with an 84.2% compound annual growth rate from 2024. Dell Technologies Inc. is investing here to build out its presence, particularly in areas like private cellular networks, where the Total Addressable Market (TAM) is estimated at $16.7 billion in 2025. Still, Dell Technologies' current market share in the core telecom equipment space is not yet established against incumbents. The company's strategy is to win by engineering bespoke, high-performance solutions for complex cluster deployments, which is a high-cash-burn, high-potential play.
Key growth drivers in this space include:
- Enhanced data speed and capacity.
- IoT integration across verticals.
- Network upgrades and expansion.
Emerging Software-Defined Offerings
This category covers next-generation software and integrated stack offerings that require significant Research and Development spend from Dell Technologies. These products are designed to integrate deeply with the growing AI and hybrid cloud ecosystems but have not yet translated that potential into leading market share figures. The focus is on increasing the mix and margin of Dell IP offerings, as noted when gross margin was driven by a mix shift to AI servers in Q3 Fiscal Year 2026. The challenge is converting R&D expenditure into dominant revenue streams.
Overall Services Revenue
While specific segment breakdowns are often bundled, the overall Services revenue for Dell Technologies Inc. in Q3 Fiscal Year 2026 was reported at $5.75 billion. This figure reportedly saw a 5.4% decline year-over-year, which signals a strategic pivot is needed even within the high-growth sub-segments. This decline in the aggregate services number suggests that while new, high-growth areas exist, they aren't yet offsetting softness or are not being recognized as quickly as needed in the top-line services number. The company is focused on capturing growth across every segment, but this specific metric indicates a current drag.
Here are some recent financial data points for context:
- Q3 FY2026 Total Revenue: $27.0 billion.
- Q3 FY2026 ISG Revenue: $14.1 billion.
- Q3 FY2026 CSG Revenue: $12.5 billion.
- Q3 FY2026 Cash Flow from Operations: $1.2 billion.
- Q3 FY2026 Capital Return: $1.6 billion.
You need to decide where to place the next big bet.
Disclaimer
All information, articles, and product details provided on this website are for general informational and educational purposes only. We do not claim any ownership over, nor do we intend to infringe upon, any trademarks, copyrights, logos, brand names, or other intellectual property mentioned or depicted on this site. Such intellectual property remains the property of its respective owners, and any references here are made solely for identification or informational purposes, without implying any affiliation, endorsement, or partnership.
We make no representations or warranties, express or implied, regarding the accuracy, completeness, or suitability of any content or products presented. Nothing on this website should be construed as legal, tax, investment, financial, medical, or other professional advice. In addition, no part of this site—including articles or product references—constitutes a solicitation, recommendation, endorsement, advertisement, or offer to buy or sell any securities, franchises, or other financial instruments, particularly in jurisdictions where such activity would be unlawful.
All content is of a general nature and may not address the specific circumstances of any individual or entity. It is not a substitute for professional advice or services. Any actions you take based on the information provided here are strictly at your own risk. You accept full responsibility for any decisions or outcomes arising from your use of this website and agree to release us from any liability in connection with your use of, or reliance upon, the content or products found herein.