
|
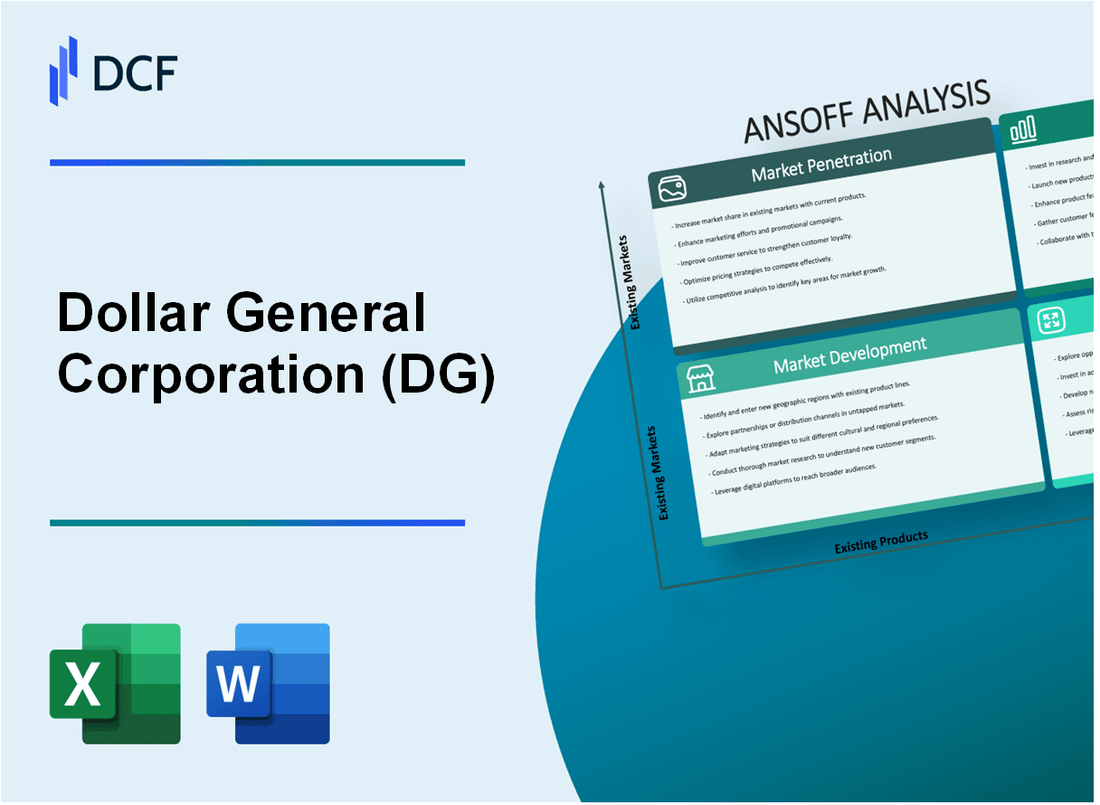
Dollar General Corporation (DG): ANSOFF MATRIX [Dec-2025 Updated] |
Fully Editable: Tailor To Your Needs In Excel Or Sheets
Professional Design: Trusted, Industry-Standard Templates
Investor-Approved Valuation Models
MAC/PC Compatible, Fully Unlocked
No Expertise Is Needed; Easy To Follow
Dollar General Corporation (DG) Bundle
You're looking for the clear, actionable growth path for Dollar General Corporation (DG), and honestly, after twenty years analyzing these moves, the Ansoff Matrix lays out their fiscal 2025 plan perfectly. It's not just one idea; it's a four-pronged attack: doubling down on existing stores with 2,250 Project Elevate remodels aiming for a 2.1% to 2.6% same-store sales lift, expanding their footprint by opening 575 new US rural stores, beefing up product appeal with over 1,000 new private label items, and testing the suburban waters with the Popshelf concept. This is a financially-backed blueprint showing exactly where they are putting their capital this year, and you'll want to see the details on each quadrant below.
Dollar General Corporation (DG) - Ansoff Matrix: Market Penetration
Market penetration for Dollar General Corporation (DG) centers on driving deeper sales within its existing store footprint and customer base through operational excellence and enhanced convenience. This strategy relies heavily on store modernization and disciplined execution to capture more wallet share from current and newly attracted shoppers.
The physical store base is being actively upgraded. Dollar General plans to execute approximately 2,250 Project Elevate remodels during fiscal 2025. These lighter-touch renovations on mature stores are specifically designed to drive incremental sales growth, with management targeting an annualized comparable sales lift between 3% to 5% for these remodeled locations. By the second quarter of fiscal 2025, the company had already completed 729 Project Elevate remodels.
To boost basket size and convenience, digital expansion is a key focus. Dollar General is working to expand its in-house same-day service, which was active in 3,000-plus locations as of the first quarter of 2025. The overall goal is to expand this digital delivery service to 10,000 stores by year-end 2025. This complements the existing partnership with DoorDash, which offers delivery from over 16,000 stores.
The 'Back to Basics' strategy is the operational backbone supporting these efforts, focusing on in-store execution and loss mitigation. This approach has already shown tangible results, including a 6.9% decrease in per-store inventory and better store productivity. Shrink mitigation, a critical component, improved gross margins by 61 basis points in the first quarter of 2025 alone. Furthermore, the strategy includes SKU rationalization, progressing toward a net reduction of 1,000 SKUs across the chain.
Dollar General is successfully leveraging its core value proposition to attract a broader demographic. The company reported seeing the highest percent of trade-in customers from middle- and higher-income households in the last four years during the first quarter of 2025. To maintain this appeal, Dollar General remains committed to its everyday low price structure, keeping at least 2,000 items priced at or below the $1 mark. While the core customer base, typically earning under $35,000 annually, still accounts for about 60% of sales, these new, wealthier shoppers are reportedly making more trips and spending more with the retailer.
Operational discipline is intended to translate into specific financial outcomes for the full fiscal year. The target for fiscal 2025 same-store sales growth is set between 2.1% to 2.6%. This target follows a strong start, with first-quarter same-store sales increasing by 2.4% and second-quarter same-store sales growing by 2.8%. Net sales for the first fiscal quarter of 2025 reached $10.4 billion.
Here's a quick look at the key metrics tied to these Market Penetration efforts:
| Metric Category | Target/Plan for Fiscal 2025 | Latest Reported Performance/Actual |
| Project Elevate Remodels | Execute 2,250 remodels | 668 completed in Q1 2025 |
| Project Elevate Comp Sales Lift | 3% to 5% annualized lift | N/A (Target) |
| Digital Delivery Expansion | Expand to 10,000 stores | Active in 3,000-plus locations |
| Fiscal 2025 Same-Store Sales Growth | Targeting 2.1% to 2.6% | Reported 2.4% in Q1 2025 |
| Shrink Mitigation Impact | Targeting 6-7% operating margin by 2028 | Improved gross margin by 61 basis points in Q1 2025 |
| Value Proposition Metric | Maintain 2,000-plus items at or below $1 | Highest percent of trade-in customers in four years |
The immediate focus for operational discipline involves several key areas you should track:
- Improve in-store execution and reduce shrink.
- Optimize inventory with a 6.9% lower inventory per store achieved.
- Continue attracting higher-income 'trade-in' customers.
- Ensure the 2,250 Project Elevate remodels stay on schedule.
- Maintain the commitment to everyday low prices.
Dollar General Corporation (DG) - Ansoff Matrix: Market Development
You're looking at Dollar General Corporation's (DG) strategy for taking its existing concept into new geographic areas, which is the Market Development quadrant of the Ansoff Matrix. This isn't about inventing new products; it's about planting more stores where the current format fits the local need, especially in rural America. The company has a clear, capital-intensive plan for fiscal 2025 to execute this expansion.
The core of this strategy involves significant physical expansion across the United States and a measured push into Mexico. Dollar General Corporation plans to open approximately 575 new Dollar General stores in the U.S. rural markets in fiscal 2025. To support this, the company is allocating capital expenditures expected to fall between $1.3 billion and $1.4 billion for the year. The cost to build these new stores averages approximately $500,000 to open, covering both capital expenditure and inventory, a figure that is more than 40% higher than in 2019. Expectations for new store returns remain 'very strong,' though they are down modestly from the historic target in the 20%-plus range due to higher occupancy and operating costs.
The international leg of this market development involves the Mi Súper Dollar General banner. Dollar General Corporation plans to continue this international push by opening up to 15 new Mi Súper Dollar General stores in Mexico. This move adapts the successful U.S. proposition to the Mexican retail landscape.
Beyond net new stores, the strategy includes optimizing the existing footprint to better serve these rural communities, which is a form of market development by enhancing the offering in established areas. Dollar General Corporation plans to relocate 45 existing stores into larger formats. This effort is part of a much larger real estate overhaul for the fiscal year. The company is converting older, smaller stores through two major remodel programs to support expanded offerings and improve the customer experience. Specifically, the plan includes 2,000 full remodels under Project Renovate and upgrades for another 2,250 stores through Project Elevate, which is a 'lighter-touch' remodel for mature locations.
Here's the quick math on the total planned real estate projects for fiscal 2025, which collectively total approximately 4,885 projects, or nearly 5,000. The expected first-year comparable sales lift on the 2,000 full remodels is projected to be approximately 6% to 8%, on average, which is better than the expected returns from new stores. What this estimate hides is that the company is also closing underperforming locations as part of a portfolio optimization review.
You can see the breakdown of the planned real estate activity for Dollar General Corporation in fiscal 2025 here:
| Project Type | Planned Number for Fiscal 2025 |
|---|---|
| Total Real Estate Projects | Approximately 4,885 |
| New U.S. Store Openings | 575 |
| New Mexico Store Openings | Up to 15 |
| Full Store Remodels (Project Renovate) | Approximately 2,000 |
| Incremental Remodels (Project Elevate) | Approximately 2,250 |
| Store Relocations | Approximately 45 |
The Market Development focus is clearly on aggressive unit growth in the core U.S. rural market while testing the international waters. The strategy relies heavily on improving the existing base through remodels to drive incremental sales. The planned activities are:
- Open 575 new U.S. stores.
- Open up to 15 new stores in Mexico.
- Execute 2,000 full remodels.
- Implement 2,250 Project Elevate remodels.
- Relocate 45 existing stores.
Finance: draft the cash flow impact for the $1.3 billion to $1.4 billion CapEx by next Tuesday.
Dollar General Corporation (DG) - Ansoff Matrix: Product Development
You're looking at the specifics of how Dollar General Corporation (DG) is developing new offerings to drive growth within its existing market space. This is all about deepening the value proposition right where they already operate.
Dollar General Corporation (DG) is making a major investment in its private brand strategy, announcing plans to roll out more than 1,000 new private label items across all categories throughout 2025. This expansion covers food and beverage, household essentials, and health and beauty products. The goal is to offer more affordable alternatives without sacrificing quality, which is key as shoppers remain sensitive to price pressures.
Specifically for groceries, Dollar General Corporation (DG) plans to add over 100 new products to the Clover Valley grocery brand in the first quarter of 2025. More than half of these additions will be under the Clover Valley banner, enhancing food staples. Clover Valley, which was introduced in 2009, already included approximately 600 items before this Q1 2025 push. In fiscal 2023, Clover Valley generated retail sales of $2.3B, making it the largest private brand by sales.
The expansion into fresh food continues, addressing food deserts by planning to add fresh produce offerings to approximately 300 additional locations throughout 2025. This brings the total number of stores carrying fresh produce to roughly 7,000 locations. This is part of a larger store update plan for fiscal year 2025, which aims to complete around 4,885 projects in the U.S.
Dollar General Corporation (DG) is focused on improving private brand quality and packaging to compete directly with national brands for customer trust. This focus is not just about quantity; it is about ensuring that owned-brand products can stand shoulder to shoulder with national competitors. More than half of Dollar General Corporation (DG)'s customer baskets already contain at least one private label item.
Here are the key product development targets and relevant scale metrics for Dollar General Corporation (DG) as of 2025 plans:
| Product Development Metric | Target/Amount | Timeframe/Context |
| Total New Private Label Items Rollout | 1,000+ | 2025 |
| New Clover Valley Grocery Items Added | 100+ | Q1 2025 |
| Existing Clover Valley Items (Pre-2025 Additions) | ~600 | Prior to Q1 2025 |
| Total Locations with Fresh Produce Offering | ~7,000 | 2025 Target |
| Clover Valley Retail Sales | $2.3B | Fiscal 2023 |
| Total US Store Count | 16,403 | 2025 |
The strategy emphasizes quality improvements alongside product line expansion. The company is reinforcing its value proposition where consumables already account for approximately 80% of total sales.
Key product development focus areas include:
- Rolling out over 1,000 new private label SKUs.
- Adding new items to Clover Valley, spanning dry and refrigerated categories.
- Upgrading packaging appeal for owned brands.
- Expanding fresh produce availability by 300 stores.
The company is making significant investments in its private brands to bring more on-trend products and pantry staples to shelves. Finance: draft 13-week cash view by Friday.
Dollar General Corporation (DG) - Ansoff Matrix: Diversification
You're looking at Dollar General Corporation's move into new customer segments and product categories, which is classic diversification on the Ansoff Matrix. This strategy centers on concepts like Popshelf, which specifically targets suburban women in households with an annual income between $50,000 and $125,000. This is a distinct departure from the core Dollar General customer, typically in households earning $40,000 or less and located in more rural settings.
The Popshelf concept itself is designed around a distinct, non-consumable product mix, aiming for a different shopping mission than the core chain. You'll find merchandise heavily weighted toward home décor, seasonal items, and party goods. The pricing structure reinforces this differentiation, with approximately 95 percent of items priced at $5 or less. Historically, early Popshelf locations showed promising unit economics, with annualized sales ranging from $1.7 million to $2 million per store, compared to a standard Dollar General's first-year sales of $1.4 million. Furthermore, the gross margin was projected at over 40 percent, which is about 8 points higher than the traditional Dollar General format.
Dollar General Corporation is also actively managing this portfolio, showing a willingness to pivot based on performance. As part of a store portfolio optimization review announced in early 2025, the company planned to convert an additional six underperforming Popshelf locations into the core Dollar General format. This followed the closure of 45 Popshelf stores, leaving a remaining footprint of 180 locations after the initial Q1 fiscal 2025 actions. This conversion action is a direct risk mitigation step within the diversification effort, pulling underperforming new concepts back to the proven core model.
Beyond Popshelf, the diversification strategy includes formats like DG Market and DGX, which blend the core value proposition with new product assortments, particularly in groceries and convenience. You should note the total store base as of August 1, 2025, which included 20,746 Dollar General, DG Market, DGX, and pOpshelf stores across the United States and Mexico. The DG Market format, for instance, was noted as early as late 2021 to be operating in up to 14 store-within-a-store configurations, combining Popshelf offerings with a larger footprint focusing on groceries. This shows a layered approach to diversification, testing new formats in different geographies and customer needs.
Here's a quick comparison of the formats driving this diversification strategy, based on available data points:
| Format | Primary Target Customer Income (Approx.) | Key Product Focus | Approximate Size (SF) | Reported Conversion/Closure Action (Early 2025) |
|---|---|---|---|---|
| Core Dollar General | $40,000 or less | Consumables, Essentials | Varies (Smaller than Popshelf) | 6 Popshelf stores converted to this format |
| Popshelf | $50,000 to $125,000 | Home Décor, Seasonal, Party Goods (Non-consumables) | 9,000 | 45 locations closed; 180 remaining after Q1 FY2025 actions |
| DG Market | Core/New Mix | Groceries, Core Essentials | Larger Footprint | Operated in 14 store-within-a-store formats as of Q3 FY2021 |
| DGX | Urban Convenience | Convenience/New Mix | Varies | Part of total store count of 20,746 as of August 1, 2025 |
The overall context for these diversification moves is set against the backdrop of the main business. Dollar General Corporation reported net sales of $40.6 billion for fiscal year 2024, a 5 percent increase over fiscal 2023. The company planned to open 575 new stores in the US during fiscal year 2025, ending January 30, 2026, alongside 4,250 remodels.
You can see the strategic focus points for this diversification quadrant:
- Targeting suburban customers with household incomes up to $125,000 via Popshelf.
- Offering a distinct, non-consumable product mix where 95 percent of items are $5 or less.
- Executing strategic portfolio management by converting six underperforming Popshelf locations to the core Dollar General format.
- Blending the core value model with broader grocery/convenience offerings in the DG Market and DGX formats.
Finance: draft 13-week cash view by Friday.
Disclaimer
All information, articles, and product details provided on this website are for general informational and educational purposes only. We do not claim any ownership over, nor do we intend to infringe upon, any trademarks, copyrights, logos, brand names, or other intellectual property mentioned or depicted on this site. Such intellectual property remains the property of its respective owners, and any references here are made solely for identification or informational purposes, without implying any affiliation, endorsement, or partnership.
We make no representations or warranties, express or implied, regarding the accuracy, completeness, or suitability of any content or products presented. Nothing on this website should be construed as legal, tax, investment, financial, medical, or other professional advice. In addition, no part of this site—including articles or product references—constitutes a solicitation, recommendation, endorsement, advertisement, or offer to buy or sell any securities, franchises, or other financial instruments, particularly in jurisdictions where such activity would be unlawful.
All content is of a general nature and may not address the specific circumstances of any individual or entity. It is not a substitute for professional advice or services. Any actions you take based on the information provided here are strictly at your own risk. You accept full responsibility for any decisions or outcomes arising from your use of this website and agree to release us from any liability in connection with your use of, or reliance upon, the content or products found herein.