
|
Dollar General Corporation (DG): 5 Forces Analysis [Jan-2025 Updated] |
Fully Editable: Tailor To Your Needs In Excel Or Sheets
Professional Design: Trusted, Industry-Standard Templates
Investor-Approved Valuation Models
MAC/PC Compatible, Fully Unlocked
No Expertise Is Needed; Easy To Follow
Dollar General Corporation (DG) Bundle
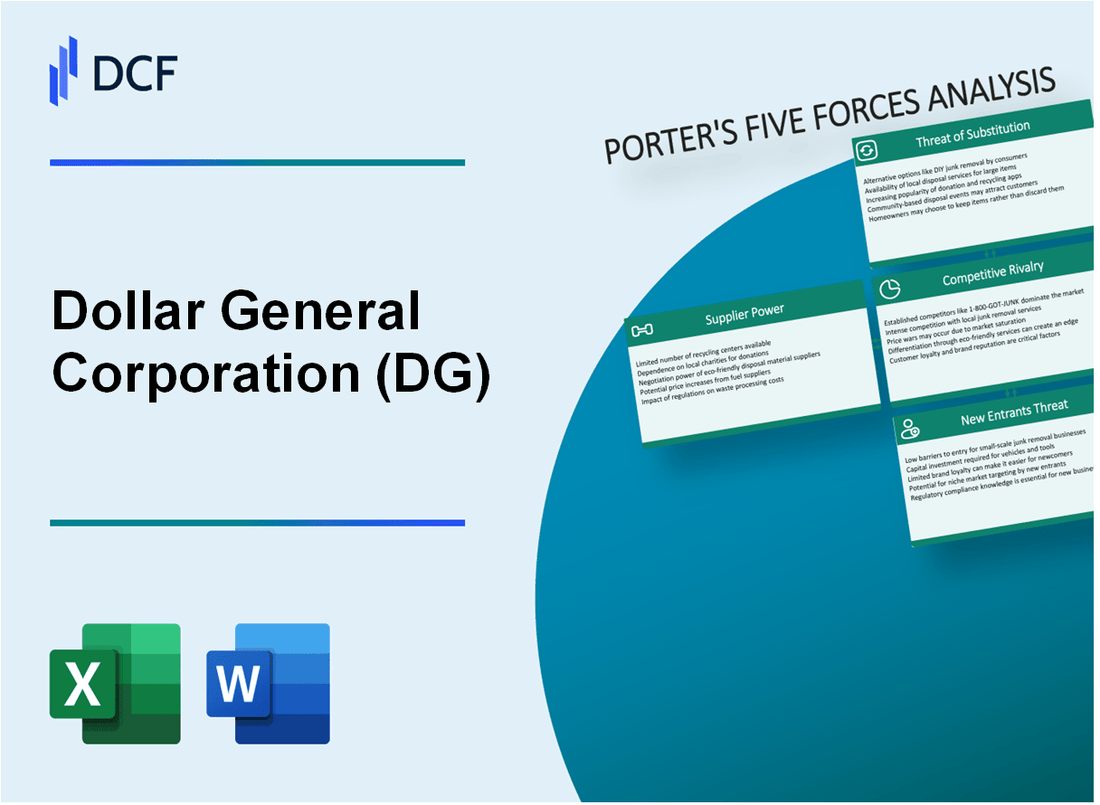
Dollar General Corporation's strategic landscape reveals a complex interplay of competitive forces shaping its retail dominance. In an era of evolving consumer preferences and retail dynamics, understanding the company's position through Michael Porter's Five Forces Framework unveils critical insights into its market resilience, competitive strategy, and potential growth challenges. From navigating supplier relationships to countering emerging market threats, Dollar General demonstrates a sophisticated approach to maintaining its stronghold in the discount retail sector, balancing competitive pressures with strategic adaptability.
Dollar General Corporation (DG) - Porter's Five Forces: Bargaining power of suppliers
Limited Supplier Concentration
Dollar General sources merchandise from approximately 1,400 different suppliers across multiple product categories in 2024. The company's diverse product range includes:
- Consumables: 77% of total sales
- Seasonal merchandise: 8% of total sales
- Home products: 7% of total sales
- Apparel: 4% of total sales
Purchase Volume and Negotiating Position
In 2023, Dollar General reported total net sales of $34.6 billion, enabling significant purchasing leverage with suppliers. The company's annual merchandise procurement volume provides strong negotiating power.
| Procurement Metric | 2023 Value |
|---|---|
| Total Merchandise Purchases | $22.3 billion |
| Number of Active Suppliers | 1,400 |
| Average Supplier Contract Duration | 3-5 years |
Supplier Switching Capabilities
Dollar General maintains flexibility with multiple supplier relationships across product categories, with approximately 25% of suppliers being interchangeable for specific merchandise lines.
Economies of Scale
The company's scale allows for significant cost reductions:
- Negotiated volume discounts averaging 12-15%
- Consolidated shipping and logistics efficiencies
- Centralized procurement strategies
Vendor Relationship Management
Dollar General maintains long-term relationships with key vendors, with approximately 60% of core suppliers having partnerships exceeding 5 years.
| Vendor Relationship Metric | Percentage |
|---|---|
| Long-term Vendor Partnerships | 60% |
| Annual Vendor Performance Reviews | 100% |
| Suppliers Meeting Performance Standards | 85% |
Dollar General Corporation (DG) - Porter's Five Forces: Bargaining power of customers
Low-income Consumer Base with Price Sensitivity
Dollar General's core customer demographic includes households with annual income of $40,000 or less. 59% of customers earn less than $40,000 annually. The average household income for Dollar General shoppers is $37,500.
| Customer Income Segment | Percentage |
|---|---|
| Below $25,000 | 36% |
| $25,000 - $40,000 | 23% |
| $40,000 - $60,000 | 17% |
High Customer Loyalty in Discount Retail Segment
Dollar General maintains a 72% customer retention rate. The company serves approximately 16 million customers weekly across 18,216 stores.
Minimal Switching Costs for Consumers
- Average price difference between Dollar General and competitors: 12-15%
- Low product differentiation allows easy customer migration
- No significant loyalty program barriers
Broad Product Selection Attracts Budget-Conscious Shoppers
Dollar General offers approximately 12,000 SKUs per store, with 75% of products priced under $5. The company stocks over 22,000 total product variations across its store network.
| Product Category | Percentage of Store Inventory |
|---|---|
| Consumables | 44% |
| Seasonal | 18% |
| Home Products | 16% |
| Apparel | 12% |
| Other | 10% |
Consistent Pricing Strategy Reduces Customer Bargaining Power
Dollar General maintains an average gross margin of 31.5%. The company's consistent low-price strategy limits customer negotiation opportunities.
Dollar General Corporation (DG) - Porter's Five Forces: Competitive rivalry
Competitive Landscape Overview
As of Q4 2023, Dollar General Corporation faces intense competition in the discount retail sector with the following market dynamics:
| Competitor | Number of Stores | Annual Revenue |
|---|---|---|
| Walmart | 10,524 | $611.3 billion |
| Dollar Tree | 16,402 | $27.3 billion |
| Family Dollar | 8,200 | $9.2 billion |
| Dollar General | 18,216 | $34.2 billion |
Store Footprint Comparison
Dollar General's store distribution as of 2023:
- Total stores: 18,216
- Rural market stores: 75% of total locations
- Suburban market stores: 22% of total locations
- Urban market stores: 3% of total locations
Market Positioning Metrics
| Metric | Dollar General Performance |
|---|---|
| Average Store Size | 7,400 sq ft |
| Average Store Revenue | $1.87 million annually |
| Market Share in Discount Retail | 22.5% |
Pricing Strategy Comparison
Competitive pricing analysis for 2023:
- Average product price at Dollar General: $3.25
- Average product price at Walmart: $4.75
- Average product price at Dollar Tree: $3.50
Expansion Strategies
Dollar General's growth metrics for 2023:
- New store openings: 1,050 stores
- Store remodels: 1,800 locations
- Investment in new store development: $1.3 billion
Dollar General Corporation (DG) - Porter's Five Forces: Threat of substitutes
Online e-commerce platforms challenging traditional retail
In 2023, e-commerce sales reached $1.1 trillion in the United States. Amazon's market share in online retail was 37.8% as of Q4 2023. Walmart.com captured 6.3% of online retail market share.
| E-commerce Platform | Market Share 2023 | Annual Revenue |
|---|---|---|
| Amazon | 37.8% | $574 billion |
| Walmart.com | 6.3% | $611.3 billion |
| Target.com | 2.1% | $109.1 billion |
Emerging discount retail and digital shopping alternatives
Dollar Tree and Family Dollar combined operated 16,915 stores in 2023. Discount store market grew 4.2% in 2023.
Convenience stores and pharmacies offering similar product ranges
CVS operated 9,900 retail locations in 2023. Walgreens maintained 9,021 stores. 7-Eleven had 8,057 stores in the United States.
| Retailer | Number of Stores 2023 | Annual Revenue |
|---|---|---|
| CVS | 9,900 | $322.5 billion |
| Walgreens | 9,021 | $307.4 billion |
| 7-Eleven | 8,057 | $84.8 billion |
Growth of digital grocery and general merchandise platforms
Online grocery sales reached $187.7 billion in 2023. Digital grocery market projected 11.7% growth in 2024.
Limited product uniqueness increases substitute threat
Dollar General's product overlap with competitors:
- Household essentials: 78% similar across retailers
- Personal care items: 65% product similarity
- Grocery items: 72% comparable product range
Dollar General Corporation (DG) - Porter's Five Forces: Threat of new entrants
High Initial Capital Requirements for Retail Infrastructure
Dollar General's retail infrastructure requires substantial capital investment. As of 2023, the company operated 18,216 stores with a total capital expenditure of $1.2 billion. Store setup costs range between $250,000 to $350,000 per location.
| Capital Metric | 2023 Value |
|---|---|
| Total Store Count | 18,216 |
| Capital Expenditure | $1.2 billion |
| Average Store Setup Cost | $250,000 - $350,000 |
Established Brand Recognition and Market Presence
Dollar General's market share in the discount retail segment is approximately 7.5%, with annual revenue of $34.2 billion in 2023.
Complex Supply Chain and Logistics Barriers
The company maintains 29 distribution centers across the United States, processing approximately 1.3 million cases daily.
| Supply Chain Metric | 2023 Value |
|---|---|
| Distribution Centers | 29 |
| Daily Case Processing | 1.3 million |
Economies of Scale Protection
- Purchasing power: $15.3 billion in annual inventory procurement
- Merchandise gross margin: 32.7%
- Operating expenses: 22.3% of total revenue
Regulatory Compliance and Distribution Network Challenges
Compliance costs for Dollar General in 2023 were estimated at $178 million, covering various state and federal regulations.
| Regulatory Compliance Metric | 2023 Value |
|---|---|
| Annual Compliance Expenditure | $178 million |
Disclaimer
All information, articles, and product details provided on this website are for general informational and educational purposes only. We do not claim any ownership over, nor do we intend to infringe upon, any trademarks, copyrights, logos, brand names, or other intellectual property mentioned or depicted on this site. Such intellectual property remains the property of its respective owners, and any references here are made solely for identification or informational purposes, without implying any affiliation, endorsement, or partnership.
We make no representations or warranties, express or implied, regarding the accuracy, completeness, or suitability of any content or products presented. Nothing on this website should be construed as legal, tax, investment, financial, medical, or other professional advice. In addition, no part of this site—including articles or product references—constitutes a solicitation, recommendation, endorsement, advertisement, or offer to buy or sell any securities, franchises, or other financial instruments, particularly in jurisdictions where such activity would be unlawful.
All content is of a general nature and may not address the specific circumstances of any individual or entity. It is not a substitute for professional advice or services. Any actions you take based on the information provided here are strictly at your own risk. You accept full responsibility for any decisions or outcomes arising from your use of this website and agree to release us from any liability in connection with your use of, or reliance upon, the content or products found herein.