
|
Dynatrace, Inc. (DT): ANSOFF MATRIX [Dec-2025 Updated] |
Fully Editable: Tailor To Your Needs In Excel Or Sheets
Professional Design: Trusted, Industry-Standard Templates
Investor-Approved Valuation Models
MAC/PC Compatible, Fully Unlocked
No Expertise Is Needed; Easy To Follow
Dynatrace, Inc. (DT) Bundle
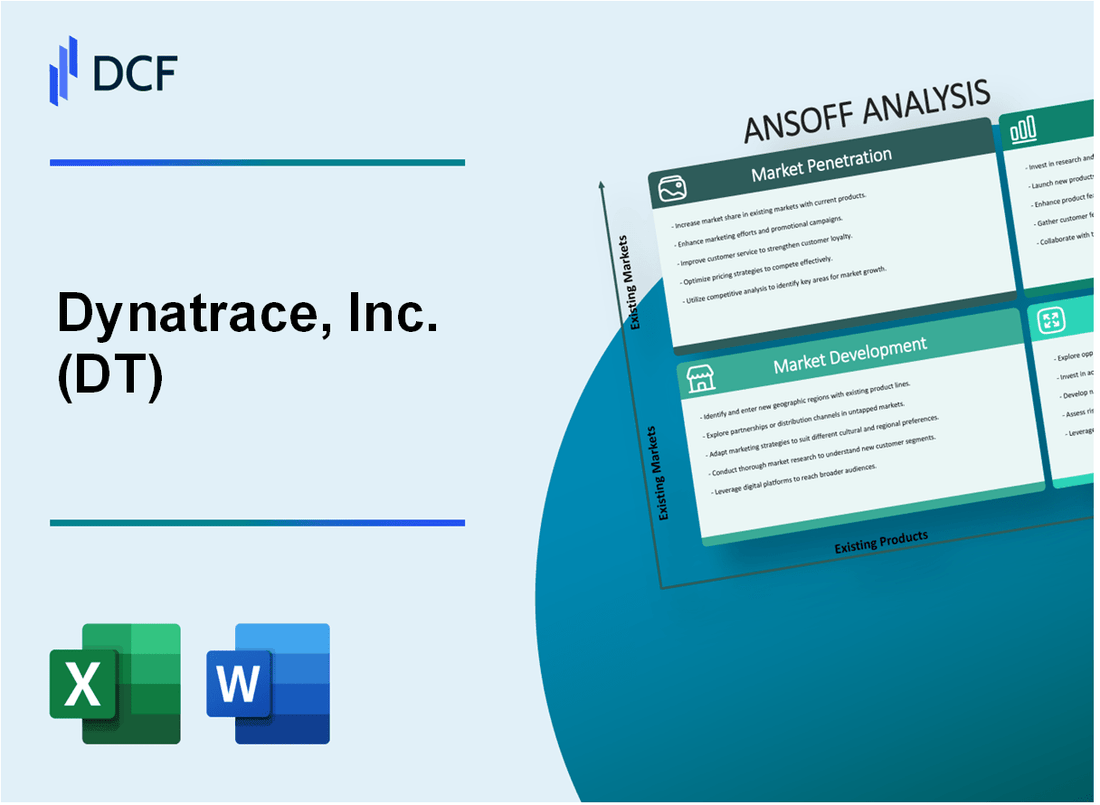
You're digging into how a company with \$1.70 billion in FY 2025 revenue and a strong 110% net retention rate plans its next growth spurt. Honestly, looking at their current AI-powered platform, the question isn't if they'll grow, but how they'll attack the market next. As someone who's mapped out strategies for big asset managers, I find the Ansoff Matrix the clearest way to cut through the noise; it forces us to look at four distinct paths: digging deeper in current markets, finding new ones, building new tech, or making a big leap into something totally new. Below, I've broken down the concrete actions for each vector, so you can see exactly where the near-term opportunities-and the defintely required investments-lie.
Dynatrace, Inc. (DT) - Ansoff Matrix: Market Penetration
Drive consumption growth for the Dynatrace Platform Subscription (DPS) model, which already accounts for over 60% of Annual Recurring Revenue (ARR).
As of the first quarter of fiscal 2026, the Dynatrace Platform Subscription (DPS) licensing models continue to gain traction, with over 65% of ARR leveraging this flexible, scalable, and transparent subscription approach. Consumption growth rates for DPS customers are growing twice the rate of SKU-based customers. This is supported by the fact that DPS customers consume, on average, 12 capabilities compared to 5 for SKU-based customers. The average ARR per DPS customer was over $600,000 as of Q4 FY2025. The total ARR for the company reached $1.73 billion at the end of fiscal year 2025.
Increase cross-selling of existing security products, like Cloud Security Posture Management (CSPM), to the current observability customer base.
While focusing on security cross-sell, success in other platform extensions shows the potential for expansion. More than one-third of the customer base is now leveraging the Log Management solution, with the number of customers leveraging logs up 18% quarter over quarter. Log-related consumption is projected to exceed $100 million. Furthermore, in the first quarter of fiscal 2026, 50% of the 12 large expansion deals greater than $1 million in Annual Contract Value (ACV) had significant Log Management deployments.
Offer targeted incentives to boost the net retention rate, which was already strong at 110% in FY 2025.
The dollar-based net retention rate for the full fiscal year 2025 was 110%, a slight decrease from 111% in FY 2024. The gross retention rate remains in the mid-90s percentage range. The Chief Financial Officer indicated an expectation for the net retention rate to move lower by approximately 30 to 70 basis points going into fiscal year 2026, reflecting the timing of consumption growth against ARR recognition.
Deepen strategic alliances with hyperscalers like AWS, where partner-influenced revenue is already a major growth engine.
By fiscal year 2025, partners influenced 70-80% of total ACV. This influence was evident in the fourth quarter of fiscal 2025, where 14 of 15 deals greater than $1 million in ACV were closed in collaboration with partners. Hyperscaler-sourced ARR has tripled in key periods. Dynatrace signed a new strategic collaboration agreement with Amazon Web Services (AWS) during the fourth quarter of fiscal 2025.
Focus sales efforts on converting the remaining 40% of customers still on older, SKU-based licensing to the DPS model.
The transition is well underway, with over 40% of the customer base leveraging the DPS licensing models as of the fiscal year 2025 results. As of Q1 FY2026, this figure has grown to over 45% of the customer base on DPS. The company closed 12 large expansion deals worth over $1 million annually in Q1 FY2026, with 10 of those involving partners.
| Metric | FY 2025 / Latest Data Point | Context/Comparison Point |
| DPS ARR Contribution | Over 65% of ARR (Q1 FY2026) | SKU-based customers consume 5 capabilities on average. |
| Net Retention Rate (NRR) | 110% (FY 2025) | Down from 111% in FY 2024. |
| Customer Base on DPS | Over 45% (Q1 FY2026) | Implies less than 55% remain on SKU-based licensing. |
| Partner Influence on ACV | 70-80% of total ACV (FY 2025) | 14 of 15 largest deals in Q4 FY2025 were partner-influenced. |
| Log Management Adoption | Over one-third of customers | Log-related consumption projected to exceed $100 million. |
- DPS customers consume, on average, 12 capabilities.
- Consumption growth rates for DPS customers are growing twice the rate of SKU-based customers.
- 14 of 15 deals greater than $1 million in ACV in Q4 FY2025 were partner-driven.
- Hyperscaler-sourced ARR has tripled in key periods.
- The company reported total revenue of $1.699 billion for full year fiscal 2025.
Dynatrace, Inc. (DT) - Ansoff Matrix: Market Development
Market Development for Dynatrace, Inc. centers on taking the existing, proven observability platform into new customer segments and geographies. You're looking at expanding the footprint beyond the established core, which, based on fiscal year 2025 results, remains heavily weighted toward the United States.
The geographic revenue breakdown for fiscal year 2025 shows the current concentration:
| Geography | FY2025 Revenue Share |
| United States | 58% |
| Europe, Middle East and Africa | 24% |
| Asia Pacific and Latin America (Combined Remainder) | 18% |
This split clearly shows the opportunity in Asia Pacific (APAC) and Latin America (LATAM) markets, which collectively represent the remaining 18% of the total fiscal year 2025 revenue of $1,699 million. Aggressively expanding sales and partner channels here is a direct Market Development play.
To capture the broader enterprise, Dynatrace, Inc. is pushing its licensing model, which serves as a de facto product tiering strategy for scale. Over 60% of Annual Recurring Revenue (ARR) now leverages the Dynatrace Platform Subscription (DPS) licensing models as of the end of fiscal year 2025. This model is key to reaching smaller enterprises by offering a consumption-based path that avoids the high initial commitment of larger enterprise agreements.
Leveraging the platform for new departmental buyers is supported by the platform's core capabilities, such as the Grail data lakehouse, which was expected to be generally available on Google Cloud by June 30, 2025. This unification of data types-logs, metrics, traces, events-is what enables insights that cross from IT into business operations, which is the necessary foundation for targeting non-IT teams like finance or business operations.
For the European market, compliance is a major driver for new adoption, particularly with the Digital Operational Resilience Act (DORA). Full implementation of DORA began on January 17, 2025. To capitalize on this, Dynatrace, Inc. introduced the Compliance Assistant app. This tool is purpose-built to provide visibility and automation specifically for DORA requirements, helping teams automate up to 80% of manual compliance configuration checks. This directly addresses the need to meet local data residency and compliance requirements, which often necessitates new regional infrastructure or partnerships.
The success of the partner channel in driving expansion is evident in the latest deal metrics. In the fourth quarter of fiscal year 2025, Dynatrace, Inc. closed 15 deals greater than $1 million in Annual Contract Value (ACV), with 14 of those closed in collaboration with partners. This trend continued into the first quarter of fiscal year 2026, where 12 expansion deals over $1 million in ACV were closed, with 10 in partner collaboration. This partner-led expansion is critical for scaling sales efforts into new geographies and segments.
The focus on compliance, as seen with the DORA initiative, is a direct lever for regional adoption in regulated markets. The platform's ability to provide deterministic insights, as highlighted by the non-GAAP operating margin of 29% for fiscal year 2025, shows the underlying efficiency that supports aggressive market development investment.
Dynatrace, Inc. (DT) - Ansoff Matrix: Product Development
You're looking at how Dynatrace, Inc. is planning to expand its product portfolio, which is backed by serious investment. For fiscal year 2025, the company spent $\mathbf{\$385}$ million on Research and Development, which represented about $\mathbf{22.64\%}$ of its trailing twelve months revenue. That's the financial muscle behind these planned product pushes.
The first major push is integrating Generative AI (GenAI) into the Davis® AI engine for autonomous remediation. Dynatrace announced extended capabilities for the observability of customers' GenAI initiatives in January 2025. By February 2025, the company extended the Davis AI engine to include generative capabilities, complementing its existing causal analytics. A stated roadmap suggested automating common remediation workflows using generative AI with human approvals within a $\mathbf{90-day}$ window from that time.
For existing clients, the focus is on launching specialized observability modules for new frontiers. While specific revenue or adoption numbers for quantum computing or edge AI modules aren't public, the $\mathbf{\$385}$ million R&D spend is explicitly supporting enhancements in AI and new offerings. This investment fuels the necessary underlying platform evolution to support such complex, emerging technology stacks, which often require specialized monitoring for hardware like Nvidia GPUs.
To complement existing runtime security and Cloud Security Posture Management (CSPM) offerings, Dynatrace is moving toward a fully integrated, end-to-end Application Security Testing (AST) suite. The company unveiled plans in February 2025 to add a CSPM offering that extends application security reach beyond Kubernetes clusters, with a general availability target within $\mathbf{90}$ days of that announcement. This builds upon the existing Application Security Module, which provides continuous runtime application self-protection.
To accelerate 'shift-left' adoption among non-expert developers, a low-code/no-code interface is a priority for the Observability for Developers product. This module, unveiled in February 2025, includes a Live Debugger tool that was slated for general availability within $\mathbf{90}$ days. The goal is to bridge the divide between IT operations and application development teams using dashboards based on the same data, tailored for specific needs.
Building out a dedicated FinOps (Financial Operations) module is also on the agenda to help existing customers optimize cloud spend using Dynatrace's data. FinOps, which brings financial accountability to cloud usage, becomes critical as spending rises; one study indicated enterprises often wait until cloud spending hits $\mathbf{\$100}$ million per year before developing at-scale FinOps capabilities. Dynatrace already offers Cloud Spend Monitoring, tracking costs across AWS, Azure, and GCP, but the development of a more dedicated module aims to embed this optimization directly into the platform's core data flow.
Here is a snapshot of the financial context for these product development efforts in FY 2025:
| Metric | Amount / Percentage |
| Total Revenue (FY 2025) | $\mathbf{\$1,699}$ million |
| Research & Development Expense (FY 2025) | $\mathbf{\$385}$ million |
| R&D as Percentage of Revenue (TTM) | $\mathbf{22.64\%}$ |
| Subscription Revenue (FY 2025) | $\mathbf{\$1,622}$ million |
| Free Cash Flow (FY 2025) | $\mathbf{\$431}$ million |
| Non-GAAP Operating Margin (FY 2025) | $\mathbf{29\%}$ |
The company's platform is built on the Dynatrace Grail data lakehouse, which supports petabyte-scale data ingestion, a necessary foundation for feeding advanced AI models like the enhanced Davis engine.
- LLM Model Analytics track KPIs like input/output errors and token consumption.
- LLM Input and Output Guardrails help detect model hallucinations and PII leakage.
- Multi-model Tracing maps dependencies between multiple LLMs in RAG pipelines.
- The platform supports tracing origins of output for compliance and governance.
Finance: draft $\mathbf{13}$-week cash view by Friday.
Dynatrace, Inc. (DT) - Ansoff Matrix: Diversification
You're looking at how Dynatrace, Inc. (DT) can expand beyond its core observability market, which saw total revenue of $1.699 billion for fiscal year 2025 ending March 31, 2025.
Acquire a company in the adjacent, non-observability data analytics space to enter the broader $65 billion total addressable market (TAM) for security and beyond.
- The target TAM for security and adjacent analytics is stated as $65 billion.
- Dynatrace, Inc. (DT) reported a Free Cash Flow of $431 million in fiscal year 2025.
- The most recent acquisition activity included the purchase of Metis Data in March 2025.
- For context, the Security Analytics Market was projected to reach $19.74 billion in 2025.
Develop a new, AI-driven platform for industrial IoT (IIoT) monitoring, leveraging core observability technology for manufacturing or energy sectors in new markets.
The global Industrial IoT market size was calculated at $514.39 billion in 2025. Manufacturing remains a dominant vertical, accounting for close to 30% of total IIoT spend. The Services and Connectivity segment within IIoT is projected to grow at a Compound Annual Growth Rate (CAGR) of 25.53% through 2030.
Create a managed security service offering (MSSP) in partnership with a Global System Integrator (GSI) to target small-to-medium businesses (SMBs) in a new service-based model.
- The consumption-based Dynatrace Platform Subscription (DPS) licensing model enables partners to assemble observability-as-a-service bundles.
- The Large Enterprises segment held the largest share in the Security Analytics market in 2024, but the SMEs segment held the highest growth over the forecast period.
- Dynatrace closed 15 deals greater than $1 million in Annual Contract Value (ACV) in Q4 of fiscal year 2025, with 14 in collaboration with partners.
Launch a specialized compliance and governance platform, separate from core observability, for highly regulated financial services in the EMEA region.
Dynatrace is already enabling compliance with standards such as PCI DSS, CIS, and GDPR through its existing platform capabilities. The company allocated 22.64% of its trailing twelve months revenue to Research and Development (R&D) in fiscal year 2025, totaling $384.57 million, to underpin product innovation.
Use the core data platform to build a new product for non-IT operational technology (OT) monitoring, like smart city infrastructure, in a new geographic market.
The growth trajectory for the IIoT market, which includes OT monitoring, is substantial, with some forecasts projecting a market size of $2.1 trillion by 2030-2034. The Asia Pacific region is predicted to reach an IIoT CAGR of 26.7% from 2025 to 2034.
Here's a quick look at some of the key financial and market figures relevant to these diversification vectors:
| Metric Category | Value | Unit/Context |
|---|---|---|
| Dynatrace FY2025 Total Revenue | $1.699 billion | Fiscal Year Ending March 31, 2025 |
| Dynatrace FY2025 Subscription Revenue | $1.622 billion | Fiscal Year Ending March 31, 2025 |
| Security Analytics Market Size (2025 Projection) | $19.74 billion | Global Market Estimate |
| Security Analytics Market CAGR (2025-2032) | 16.2% | Forecasted Growth Rate |
| Industrial IoT Market Size (2025 Estimate) | $514.39 billion | Global Market Estimate |
| Dynatrace FY2025 Non-GAAP Income from Operations | $494 million | Fiscal Year Ending March 31, 2025 |
Finance: draft 13-week cash view by Friday.
Disclaimer
All information, articles, and product details provided on this website are for general informational and educational purposes only. We do not claim any ownership over, nor do we intend to infringe upon, any trademarks, copyrights, logos, brand names, or other intellectual property mentioned or depicted on this site. Such intellectual property remains the property of its respective owners, and any references here are made solely for identification or informational purposes, without implying any affiliation, endorsement, or partnership.
We make no representations or warranties, express or implied, regarding the accuracy, completeness, or suitability of any content or products presented. Nothing on this website should be construed as legal, tax, investment, financial, medical, or other professional advice. In addition, no part of this site—including articles or product references—constitutes a solicitation, recommendation, endorsement, advertisement, or offer to buy or sell any securities, franchises, or other financial instruments, particularly in jurisdictions where such activity would be unlawful.
All content is of a general nature and may not address the specific circumstances of any individual or entity. It is not a substitute for professional advice or services. Any actions you take based on the information provided here are strictly at your own risk. You accept full responsibility for any decisions or outcomes arising from your use of this website and agree to release us from any liability in connection with your use of, or reliance upon, the content or products found herein.