
|
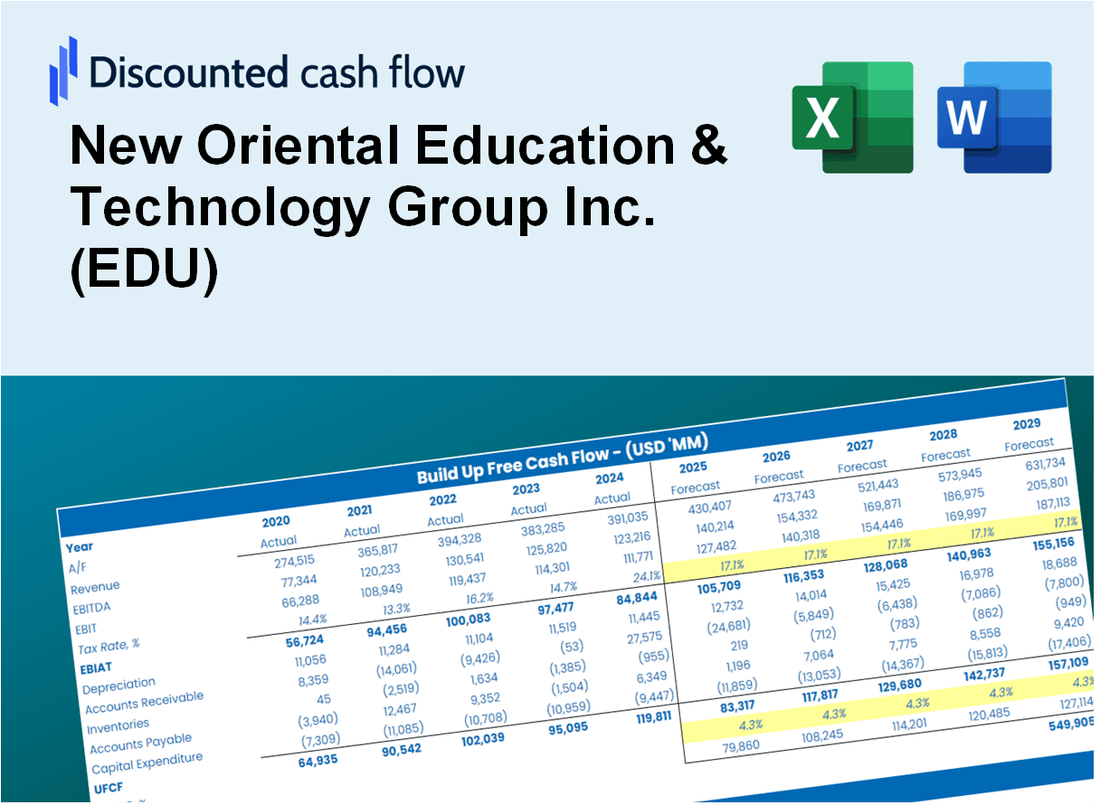
New Oriental Education & Technology Group Inc. (EDU) DCF Valuation |
Fully Editable: Tailor To Your Needs In Excel Or Sheets
Professional Design: Trusted, Industry-Standard Templates
Investor-Approved Valuation Models
MAC/PC Compatible, Fully Unlocked
No Expertise Is Needed; Easy To Follow
New Oriental Education & Technology Group Inc. (EDU) Bundle
Streamline your analysis and improve precision with our (EDU) DCF Calculator! With real data from New Oriental Education & Technology Group Inc. and customizable assumptions, this tool enables you to forecast, evaluate, and value (EDU) like a seasoned investor.
Discounted Cash Flow (DCF) - (USD MM)
| Year | AY1 2021 |
AY2 2022 |
AY3 2023 |
AY4 2024 |
AY5 2025 |
FY1 2026 |
FY2 2027 |
FY3 2028 |
FY4 2029 |
FY5 2030 |
|---|---|---|---|---|---|---|---|---|---|---|
| Revenue | 4,276.5 | 3,105.2 | 2,997.8 | 4,313.6 | 4,900.3 | 5,226.7 | 5,574.8 | 5,946.2 | 6,342.2 | 6,764.7 |
| Revenue Growth, % | 0 | -27.39 | -3.46 | 43.89 | 13.6 | 6.66 | 6.66 | 6.66 | 6.66 | 6.66 |
| EBITDA | 551.9 | -834.2 | 312.7 | 457.2 | 595.4 | 200.9 | 214.3 | 228.6 | 243.8 | 260.1 |
| EBITDA, % | 12.91 | -26.86 | 10.43 | 10.6 | 12.15 | 3.84 | 3.84 | 3.84 | 3.84 | 3.84 |
| Depreciation | 230.2 | 194.2 | 122.7 | 106.8 | 106.8 | 213.1 | 227.3 | 242.4 | 258.6 | 275.8 |
| Depreciation, % | 5.38 | 6.25 | 4.09 | 2.48 | 2.18 | 4.08 | 4.08 | 4.08 | 4.08 | 4.08 |
| EBIT | 321.7 | -1,028.4 | 190.0 | 350.4 | 488.5 | -12.2 | -13.0 | -13.8 | -14.8 | -15.7 |
| EBIT, % | 7.52 | -33.12 | 6.34 | 8.12 | 9.97 | -0.2327 | -0.2327 | -0.2327 | -0.2327 | -0.2327 |
| Total Cash | 6,261.0 | 4,191.0 | 3,996.6 | 4,775.1 | 4,758.7 | 5,196.5 | 5,542.6 | 5,911.8 | 6,305.6 | 6,725.6 |
| Total Cash, percent | .0 | .0 | .0 | .0 | .0 | .0 | .0 | .0 | .0 | .0 |
| Account Receivables | 8.7 | 16.4 | 136.8 | 29.7 | 40.2 | 71.1 | 75.8 | 80.9 | 86.3 | 92.0 |
| Account Receivables, % | 0.20266 | 0.5291 | 4.56 | 0.68827 | 0.82028 | 1.36 | 1.36 | 1.36 | 1.36 | 1.36 |
| Inventories | 31.2 | 27.9 | 52.7 | 92.8 | 80.9 | 75.1 | 80.1 | 85.5 | 91.2 | 97.2 |
| Inventories, % | 0.72898 | 0.89928 | 1.76 | 2.15 | 1.65 | 1.44 | 1.44 | 1.44 | 1.44 | 1.44 |
| Accounts Payable | 38.4 | 22.3 | 69.8 | 105.7 | 80.5 | 84.0 | 89.6 | 95.6 | 101.9 | 108.7 |
| Accounts Payable, % | 0.89888 | 0.71779 | 2.33 | 2.45 | 1.64 | 1.61 | 1.61 | 1.61 | 1.61 | 1.61 |
| Capital Expenditure | -436.3 | -150.7 | -143.0 | -283.4 | -259.2 | -331.3 | -353.3 | -376.9 | -402.0 | -428.7 |
| Capital Expenditure, % | -10.2 | -4.85 | -4.77 | -6.57 | -5.29 | -6.34 | -6.34 | -6.34 | -6.34 | -6.34 |
| Tax Rate, % | 28.67 | 28.67 | 28.67 | 28.67 | 28.67 | 28.67 | 28.67 | 28.67 | 28.67 | 28.67 |
| EBITAT | 343.1 | -1,126.9 | 111.8 | 249.5 | 348.5 | -9.8 | -10.4 | -11.1 | -11.8 | -12.6 |
| Depreciation | ||||||||||
| Changes in Account Receivables | ||||||||||
| Changes in Inventories | ||||||||||
| Changes in Accounts Payable | ||||||||||
| Capital Expenditure | ||||||||||
| UFCF | 135.5 | -1,104.1 | -6.2 | 175.8 | 172.3 | -149.6 | -140.6 | -149.9 | -159.9 | -170.6 |
| WACC, % | 4.49 | 4.49 | 3.75 | 3.97 | 3.97 | 4.13 | 4.13 | 4.13 | 4.13 | 4.13 |
| PV UFCF | ||||||||||
| SUM PV UFCF | -681.4 | |||||||||
| Long Term Growth Rate, % | 4.00 | |||||||||
| Free cash flow (T + 1) | -177 | |||||||||
| Terminal Value | -134,523 | |||||||||
| Present Terminal Value | -109,870 | |||||||||
| Enterprise Value | -110,551 | |||||||||
| Net Debt | -989 | |||||||||
| Equity Value | -109,562 | |||||||||
| Diluted Shares Outstanding, MM | 16 | |||||||||
| Equity Value Per Share | -6,764.21 |
What You Will Get
- Real New Oriental Data: Preloaded financials – from revenue to EBIT – based on actual and projected figures for New Oriental Education & Technology Group Inc. (EDU).
- Full Customization: Adjust all critical parameters (yellow cells) like WACC, growth %, and tax rates to fit your analysis.
- Instant Valuation Updates: Automatic recalculations to analyze the impact of changes on New Oriental's fair value.
- Versatile Excel Template: Designed for quick edits, scenario testing, and detailed projections specific to New Oriental Education & Technology Group Inc. (EDU).
- Time-Saving and Accurate: Avoid building models from scratch while ensuring precision and flexibility in your financial assessments.
Key Features
- Pre-Loaded Data: New Oriental Education's historical financial statements and pre-filled forecasts.
- Fully Adjustable Inputs: Edit WACC, tax rates, revenue growth, and EBITDA margins.
- Instant Results: See New Oriental Education's intrinsic value recalculate in real time.
- Clear Visual Outputs: Dashboard charts display valuation results and key metrics.
- Built for Accuracy: A professional tool for analysts, investors, and finance experts.
How It Works
- Step 1: Download the Excel file for New Oriental Education & Technology Group Inc. (EDU).
- Step 2: Review the pre-filled financial data and forecasts for New Oriental.
- Step 3: Adjust key inputs such as enrollment growth, WACC, and tax rates (highlighted cells).
- Step 4: Observe the DCF model update in real-time as you modify your assumptions.
- Step 5: Evaluate the outputs and leverage the results for your investment decisions.
Why Choose This Calculator for New Oriental Education & Technology Group Inc. (EDU)?
- User-Friendly Interface: Tailored for both novices and seasoned professionals.
- Customizable Inputs: Adjust variables easily to suit your financial analysis.
- Real-Time Valuation: Observe immediate updates to New Oriental's valuation as you tweak the inputs.
- Preloaded Data: Comes equipped with New Oriental's latest financial metrics for swift evaluation.
- Relied Upon by Experts: Favored by analysts and investors for making well-informed choices.
Who Should Use This Product?
- Professional Investors: Develop comprehensive and accurate valuation models for analyzing investments in New Oriental Education & Technology Group Inc. (EDU).
- Corporate Finance Teams: Evaluate valuation scenarios to inform strategic decisions within educational sectors.
- Consultants and Advisors: Deliver precise valuation insights to clients regarding New Oriental Education & Technology Group Inc. (EDU).
- Students and Educators: Utilize real-world data to enhance learning and practice in financial modeling.
- Education Sector Enthusiasts: Gain insights into how education companies like New Oriental Education & Technology Group Inc. (EDU) are valued in the market.
What the Template Contains
- Historical Data: Includes New Oriental Education’s past financials and baseline forecasts.
- DCF and Levered DCF Models: Detailed templates to calculate New Oriental Education’s intrinsic value.
- WACC Sheet: Pre-built calculations for Weighted Average Cost of Capital.
- Editable Inputs: Modify key drivers like growth rates, EBITDA %, and CAPEX assumptions.
- Quarterly and Annual Statements: A complete breakdown of New Oriental Education’s financials.
- Interactive Dashboard: Visualize valuation results and projections dynamically.
Disclaimer
All information, articles, and product details provided on this website are for general informational and educational purposes only. We do not claim any ownership over, nor do we intend to infringe upon, any trademarks, copyrights, logos, brand names, or other intellectual property mentioned or depicted on this site. Such intellectual property remains the property of its respective owners, and any references here are made solely for identification or informational purposes, without implying any affiliation, endorsement, or partnership.
We make no representations or warranties, express or implied, regarding the accuracy, completeness, or suitability of any content or products presented. Nothing on this website should be construed as legal, tax, investment, financial, medical, or other professional advice. In addition, no part of this site—including articles or product references—constitutes a solicitation, recommendation, endorsement, advertisement, or offer to buy or sell any securities, franchises, or other financial instruments, particularly in jurisdictions where such activity would be unlawful.
All content is of a general nature and may not address the specific circumstances of any individual or entity. It is not a substitute for professional advice or services. Any actions you take based on the information provided here are strictly at your own risk. You accept full responsibility for any decisions or outcomes arising from your use of this website and agree to release us from any liability in connection with your use of, or reliance upon, the content or products found herein.