
|
Emerald Holding, Inc. (EEX): BCG Matrix [Dec-2025 Updated] |
Fully Editable: Tailor To Your Needs In Excel Or Sheets
Professional Design: Trusted, Industry-Standard Templates
Investor-Approved Valuation Models
MAC/PC Compatible, Fully Unlocked
No Expertise Is Needed; Easy To Follow
Emerald Holding, Inc. (EEX) Bundle
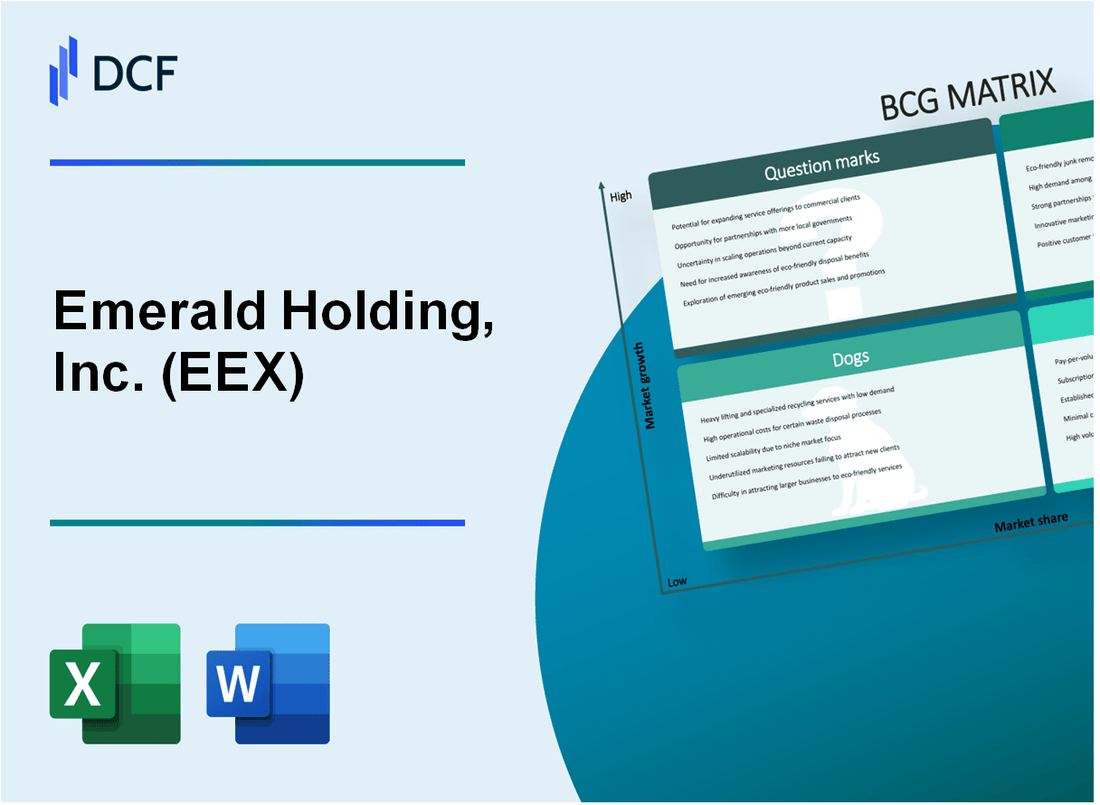
You need the hard truth on Emerald Holding, Inc.'s (EEX) portfolio as of late 2025, and we've mapped it using the BCG lens. Forget the jargon; we're looking at which digital ventures are the high-growth 'Stars,' which established trade shows are the dependable 'Cash Cows' funding everything else, which legacy assets are draining resources as 'Dogs,' and where the big, risky 'Question Marks' sit. Honestly, this breakdown shows you exactly where the capital needs to move right now to secure the next few years of growth. Keep reading to see the precise quadrant placement for every major EEX business unit, starting with the strategic map below.
Background of Emerald Holding, Inc. (EEX)
You're looking at Emerald Holding, Inc. (EEX), which, as of late 2025, stands as America's largest producer of trade shows and their associated conferences, content, and commerce. Honestly, they operate right at the intersection of B2B events, digital content, and commerce technology, making them a key player in the live experiences sector. They own and run a curated portfolio that includes B2B events, trade shows, B2C showcases, and a scaled hosted buyer platform, delivering commerce-driven solutions across various industries.
Looking at the year-to-date performance through the third quarter of 2025, Emerald Holding showed solid top-line momentum. Total revenues reached $330.7 million, marking a 13.3% increase over the prior year period. This growth was largely fueled by revenues generated from strategic acquisitions, though higher Organic Revenues also contributed. On the profitability side, Year-to-Date Adjusted EBITDA (a non-GAAP measure) hit $90.8 million, which is a substantial 32.4% jump compared to the same period last year.
Now, let's drill into the most recent numbers from the third quarter ended September 30, 2025. Total revenue for Q3 was $77.5 million, up from $72.6 million a year prior. However, you need to note that the Organic Revenues-which strip out the impact of acquisitions and scheduling-actually declined by 6.8% year-over-year for the quarter. The company reported a net loss of $14.4 million for the quarter, which is wider than the $11.1 million net loss reported in Q3 2024. Still, the Adjusted EBITDA for the quarter managed a small increase, reaching $12.8 million versus $12.5 million the year before.
Following that Q3 report, management raised and narrowed its full-year 2025 guidance, showing defintely increased confidence in the back half of the year. They now expect total revenues for the full year to fall between $460 million and $465 million, with Adjusted EBITDA projected to be between $122.5 million and $127.5 million. A key strategic move this year was the August 2025 acquisition of Generis Group, which expands Emerald's portfolio into high-growth peer-to-peer executive events. Furthermore, the company is actively pushing technology initiatives, including the implementation of an AI-powered event agent to boost efficiency.
Emerald Holding, Inc. (EEX) - BCG Matrix: Stars
The Stars quadrant for Emerald Holding, Inc. (EEX) is characterized by business units or events that command a leading market share within rapidly expanding market segments. These are the current revenue drivers that require significant investment to maintain their growth trajectory and eventually transition into Cash Cows when market growth moderates.
The Connections segment, comprising the core B2B conferences, represents the established leader with high market share. For the first quarter of fiscal year 2025, this segment demonstrated robust underlying health, with Organic Revenues growing by 6.6%, reaching $129.8 million versus the first quarter of 2024. While the third quarter saw a dip in overall organic revenue by 6.8%, the first half of the year indicated strong market capture for the core platform. In the second quarter of 2025, the Connections segment generated $70.1 million in Organic Revenues, marking a 1.7% year-over-year increase, and accounted for over 90% of the total Q2 revenue, which was $95.4 million out of total Q2 revenue of $105.5 million.
The high-growth focus is evident in strategic acquisitions made throughout 2025, specifically targeting niche, high-potential sectors. The acquisition of Generis Group in August 2025 is a prime example, expanding Emerald Holding, Inc.'s peer-to-peer executive events portfolio to over 50 annual programs. Management projects this acquisition will add roughly $10 million of incremental revenue in the first half of 2026. Similarly, the acquisition of Insurtech Insights, which included its London event, signals a direct investment into the high-growth technology/insurtech space.
Digital and Content-as-a-Service offerings, while showing mixed recent organic results, represent a segment with historically high growth potential. As of 2022, digital event technologies contributed 42% of total revenue streams, with virtual event platforms alone generating $39.7 million. The recent acquisition of This is Beyond reinforces this strategic focus on digital platforms, which are critical for maintaining market leadership in a hybrid event environment.
Events capitalizing on global B2B recovery are also positioned as Stars. Historically, international events contributed 62% of total revenue in 2022, amounting to $296.5 million. The inclusion of the London event from the Insurtech Insights acquisition directly leverages this international footprint.
Here is a comparison of the core market leader versus the growth-focused acquisitions in the first half of 2025:
| Metric | Connections Segment (Core Leader) | Growth Drivers (Acquisitions & Digital Focus) |
| Q1 2025 Organic Revenue Growth | 6.6% | Not Separately Reported (Overall Organic Growth: 5.6%) |
| Q2 2025 Organic Revenue Growth | 1.7% | Not Separately Reported (Overall Organic Growth: 0.4%) |
| Q2 2025 Revenue Contribution | $70.1 million (Organic) / $95.4 million (Total) | Content/Commerce: Declining 8.1% YoY (Approx. $10.1 million in Q2 2025) |
| Key 2025 Acquisition | N/A (Core Business) | Insurtech Insights (Technology/International Focus) |
| Projected 2026 Revenue Impact (H1) | Underlying Core Growth | Generis Group: Expected to add $10 million |
The company's overall financial performance for the first three quarters of 2025 reflects the investment required by these Stars. Year-to-date total revenue reached $330.7 million, a 13.3% increase, with Adjusted EBITDA reaching $90.8 million, a 32.4% increase, demonstrating that cash is being consumed to fuel this growth, though profitability is improving.
The high-potential, recently launched events are gaining traction, as evidenced by the Q1 2025 organic revenue growth of 5.6%, which was driven by the Connections business and a new event launch. The company's strategy is clearly focused on nurturing these leaders.
- Connections Segment: Core market share leader.
- Insurtech Insights: Niche acquisition in high-growth sector.
- This is Beyond: Bolsters digital/Content-as-a-Service offering.
- Generis Group: Expands executive summit portfolio.
- Q1 2025 Organic Growth: 5.6%, indicating strong underlying market demand.
Emerald Holding, Inc. (EEX) - BCG Matrix: Cash Cows
You're looking at the bedrock of Emerald Holding, Inc.'s business-the events that have been market leaders for years. These are the established, large-scale trade shows like ASD Market Week and NY NOW. They operate in mature B2B verticals such as gift, home, and jewelry, where growth is steady rather than explosive, fitting the low-growth criteria for a Cash Cow.
These core events are designed to be highly efficient operations. For instance, ASD Market Week is noted for enabling buyers to achieve margins of up to 300%, which speaks to the high value and established supplier/buyer network within that vertical. This event consistently draws around 30,000 attendees per show, indicating a high relative market share and dominance in its consumer merchandise space.
The financial performance for the first nine months of fiscal year 2025 suggests these stable assets are performing as expected, generating significant cash flow that supports the rest of the portfolio. Year-to-date revenue through September 30, 2025, reached $330.7 million, with Adjusted EBITDA growing 32.4% year-over-year to $90.8 million. This strong profitability, even with some organic revenue headwinds in Q3, is what you expect from a Cash Cow segment.
The company's full-year 2025 guidance reaffirms this stability, projecting total revenues between $460 million and $465 million and Adjusted EBITDA between $122.5 million and $127.5 million. Investments here are focused on maintaining efficiency, such as leveraging data to improve cross-selling, rather than massive promotional spending to capture new market share.
Here's a look at the overall financial performance metrics that reflect the strength of these core, cash-generating businesses as of the latest reported data for 2025:
| Metric | Value (As of Q3 2025 YTD) | Value (FY 2025 Guidance Midpoint) |
|---|---|---|
| Year-to-Date Revenue (9 Months Ended 9/30/2025) | $330.7 million | N/A |
| Year-to-Date Adjusted EBITDA (9 Months Ended 9/30/2025) | $90.8 million | N/A |
| Year-to-Date Organic Revenue Growth (9 Months Ended 9/30/2025) | 1.0% | N/A |
| Full Year 2025 Revenue Guidance Range | N/A | $460 million - $465 million |
| Full Year 2025 Adjusted EBITDA Guidance Range | N/A | $122.5 million - $127.5 million |
The Cash Cow strategy is to 'milk' these gains passively, using the cash to fund other areas of the portfolio. For example, the company ended Q2 2025 with $156.4 million in cash, a direct result of these profitable, established events contributing to operating cash flow.
You can see the efficiency in the core business units, which are the primary drivers of the company's positive cash generation trend:
- Year-to-date 2025 Net Cash Provided by Operating Activities was $30.3 million.
- Year-to-date 2025 Free Cash Flow (excl. insurance) was $24.2 million.
- The company repurchased $16.2 million of common stock year-to-date through September 30, 2025.
- A quarterly dividend of $0.015 per share was declared for the quarter ending September 30, 2025.
These events dominate their specific B2B verticals, meaning the high market share is secure, and the focus remains on maintaining operational excellence rather than aggressive market expansion spending.
Emerald Holding, Inc. (EEX) - BCG Matrix: Dogs
You're looking at the parts of Emerald Holding, Inc. (EEX) that aren't pulling their weight in the current market, the ones that tie up capital without delivering meaningful returns. These are the Dogs-low market share in low-growth areas. Honestly, the Q3 2025 organic revenue decline of 6.8% year-over-year points directly to the drag these units create, even as acquisitions boost the top line.
The core issue here is the continued existence of assets that require attention but offer minimal upside. Management's strategy to shed non-profitable events, like the three discontinued events in Q2 2025 that were not contributing to profitability, is a direct move to prune this quadrant.
Here's how the profile of these underperformers typically looks within Emerald Holding, Inc. (EEX):
- Legacy print publications and media assets with declining subscription revenue.
- Small, regional events in mature or shrinking industries with low attendance.
- Events facing intense, low-cost competition and having poor margins.
- Business units demanding more management time than the revenue justifies.
We can look at the historical trend for physical trade shows to see the magnitude of the challenge these legacy assets present. Even in 2023, before the full impact of current headwinds, the trend was clear:
| Metric | 2022 Value (Physical Trade Shows) | 2023 Value (Physical Trade Shows) | Decline Rate |
|---|---|---|---|
| Total Physical Trade Show Revenue | $124.7 million | $103.1 million | 17.3% |
This 17.3% drop in physical trade show revenue between 2022 and 2023 illustrates the cash-consuming nature of these legacy businesses, which are prime candidates for the Dog classification. These units frequently break even or consume cash, acting as traps for capital that could be deployed into Stars or Question Marks.
The contrast between the overall company outlook and the organic performance is stark. The full-year 2025 guidance anticipates total revenue between $450 million and $460 million, largely driven by acquisitions, but the underlying organic health is concerning:
| Period | Total Revenue Reported | Organic Revenue Change |
|---|---|---|
| Full Year 2024 | $398.8 million | +5.9% (vs 2023) |
| Q3 2025 | $77.5 million | -6.8% (vs Q3 2024) |
The -6.8% organic decline in Q3 2025 suggests that the rate of decay in the Dog segments is outpacing the company's ability to grow its Stars and Question Marks organically. Expensive turn-around plans are rarely effective here; divestiture is the cleaner action. For instance, the company absorbed about $1 million in Selling, General, and Administrative (SG&A) costs from the Generis acquisition in Q3 2025 without recognizing any revenue from that specific business in the quarter, which is the opposite of what a Dog needs-it needs to be lean. You want to minimize management focus on these areas; the $95.4 million cash balance as of September 30, 2025, needs to be protected from these cash traps.
Emerald Holding, Inc. (EEX) - BCG Matrix: Question Marks
You're looking at the new frontiers for Emerald Holding, Inc. (EEX), the areas that are in high-growth markets but where the company is still building its dominant position. These are the investments that consume cash now, hoping to become tomorrow's Stars. For Emerald Holding, Inc., these Question Marks are heavily concentrated in strategic acquisitions made in 2025 and new technology initiatives.
New digital platforms and virtual event technology requiring heavy investment represent a key area. While Emerald Holding, Inc. is focused on live events, its strategy includes blending in digital tools. For instance, the portfolio company VYTAL, which drives tech-enabled reuse solutions, entered the U.S. market in 2024. In 2024, VYTAL served over 160 events across 17 countries, including the Olympics 2024 and EURO 2024 fan zones. Another digital/product play, Mad Tea, is on track to surpass $10M in sales next year (2026). These ventures require capital to scale their technology and market adoption against established players.
Recent, smaller acquisitions in unproven or highly fragmented B2B markets are classic Question Marks. Emerald Holding, Inc. closed the acquisition of Insurtech Insights in March 2025, marking an entry into the insurance technology sector. This move targets a high-growth industry undergoing digital transformation. Similarly, the August 2025 acquisition of Generis Group, a leader in B2B executive summits, expands the portfolio into a segment known for high customer satisfaction. These acquisitions need heavy investment to integrate and rapidly capture market share within their specialized verticals.
The financial impact of these new ventures is being factored into the outlook. For the full year 2025, management expects contributions of approximately $40 million to Revenue and approximately $15 million to Adjusted EBITDA from the announced acquisitions, including Insurtech Insights and This is Beyond. This expected contribution, relative to the total 2025 revenue guidance of $450 - $460 million, shows these are significant growth drivers that need nurturing.
Events that have struggled to recover post-pandemic, showing inconsistent attendance, can also fall into this category if they are new launches or have not yet stabilized their market share. While Emerald Holding, Inc. pruned over 20 underperforming events totaling $21.2 million in historic run-rate revenue in 2024, the organic performance in the third quarter of 2025 suggests continued pressure in certain areas. Third-quarter consolidated revenues were $77.5 million, but the organic revenue-which excludes new shows-was $64.0 million, a decline of 6.8% versus Q3 2024 organic revenues of $68.7 million. The company notes Q3 is historically its smallest period, but this organic dip signals a need for decisive investment or divestment action.
Any new event launch in a highly competitive market where EEX lacks a dominant position is inherently a Question Mark. The acquisition of This is Beyond, which operates in the $1.3 trillion luxury travel market, introduces Emerald Holding, Inc. to a sector where it is establishing its footprint. This is Beyond brings seven premier B2B events, such as LE Miami and PURE Life Experiences, which must now compete for share against established luxury travel platforms.
Here is a look at the key ventures categorized as Question Marks requiring investment to gain market share:
| Venture/Area | Market/Sector Focus | Key 2025 Financial Impact (Guidance) | Operational Metric |
| Insurtech Insights Acquisition | Insurance Technology (High Growth) | Contributes approx. $40M to 2025 Revenue | Produces conferences in London, Hong Kong, and New York |
| Generis Group Acquisition | Executive-Level B2B Summits | Contributes approx. $15M to 2025 Adjusted EBITDA | Operates 17 annual events across U.S. and Europe |
| This is Beyond Acquisition | Experiential & Luxury Travel | Part of the overall acquisition revenue contribution | Brings seven premier B2B events in a $1.3T market |
| VYTAL (Digital Reuse Tech) | Tech-Enabled Reuse Solutions | On track to surpass $10M in sales (Mad Tea) | Served over 160 events across 17 countries in 2024 |
The strategy for these units centers on rapid scaling, as evidenced by the need to grow quickly or risk becoming Dogs. The company's overall liquidity remains strong, ending Q1 2025 with $276.8 million in cash and full availability of its $110.0 million credit facility, providing the necessary fuel for these high-potential investments.
Specific areas demanding heavy investment to drive market adoption include:
- Integrating the 17 Generis Group events into the core portfolio.
- Scaling the Insurtech Insights platform across the U.S., Europe, and Asia.
- Driving adoption for the seven luxury travel events acquired from This is Beyond.
- Increasing the scale and revenue of the VYTAL reuse system in the U.S. market.
- Improving organic performance to reverse the Q3 2025 organic revenue decline of 6.8%.
Disclaimer
All information, articles, and product details provided on this website are for general informational and educational purposes only. We do not claim any ownership over, nor do we intend to infringe upon, any trademarks, copyrights, logos, brand names, or other intellectual property mentioned or depicted on this site. Such intellectual property remains the property of its respective owners, and any references here are made solely for identification or informational purposes, without implying any affiliation, endorsement, or partnership.
We make no representations or warranties, express or implied, regarding the accuracy, completeness, or suitability of any content or products presented. Nothing on this website should be construed as legal, tax, investment, financial, medical, or other professional advice. In addition, no part of this site—including articles or product references—constitutes a solicitation, recommendation, endorsement, advertisement, or offer to buy or sell any securities, franchises, or other financial instruments, particularly in jurisdictions where such activity would be unlawful.
All content is of a general nature and may not address the specific circumstances of any individual or entity. It is not a substitute for professional advice or services. Any actions you take based on the information provided here are strictly at your own risk. You accept full responsibility for any decisions or outcomes arising from your use of this website and agree to release us from any liability in connection with your use of, or reliance upon, the content or products found herein.