
|
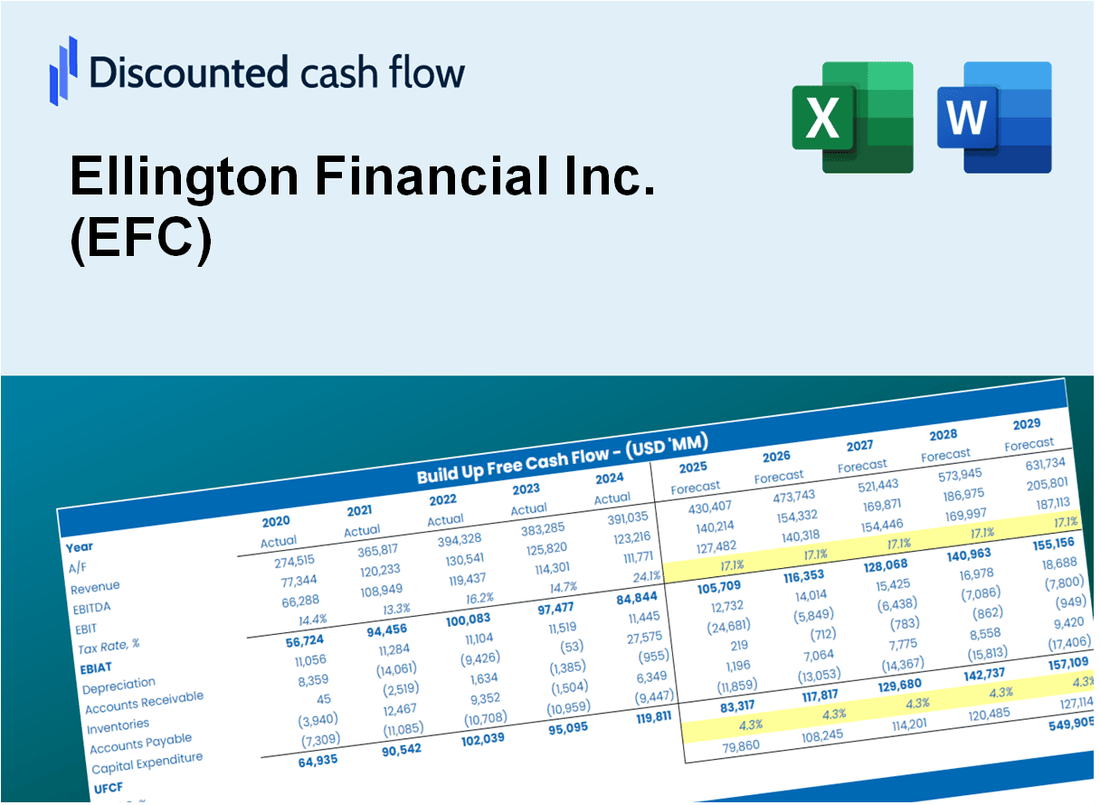
Ellington Financial Inc. (EFC) DCF Valuation |
Fully Editable: Tailor To Your Needs In Excel Or Sheets
Professional Design: Trusted, Industry-Standard Templates
Investor-Approved Valuation Models
MAC/PC Compatible, Fully Unlocked
No Expertise Is Needed; Easy To Follow
Ellington Financial Inc. (EFC) Bundle
Looking to determine the intrinsic value of Ellington Financial Inc.? Our EFC DCF Calculator integrates real-world data with comprehensive customization options, enabling you to refine your forecasts and enhance your investment strategies.
What You Will Get
- Real EFC Financials: Access to historical and projected data for precise valuation.
- Customizable Inputs: Adjust WACC, tax rates, revenue growth, and capital expenditures as needed.
- Dynamic Calculations: Intrinsic value and NPV are updated automatically.
- Scenario Analysis: Evaluate various scenarios to assess Ellington Financial's future performance.
- User-Friendly Design: Tailored for professionals while remaining approachable for newcomers.
Key Features
- Customizable Financial Inputs: Adjust essential metrics such as interest rates, loan-to-value ratios, and dividend yields.
- Instant DCF Analysis: Automatically computes intrinsic value, net present value, and additional financial metrics.
- High-Precision Valuation: Leverages Ellington Financial’s (EFC) actual performance data for accurate valuation insights.
- Effortless Scenario Testing: Easily explore various financial scenarios and assess their potential impacts.
- Efficiency Booster: Streamline your valuation process without the hassle of constructing intricate financial models from the ground up.
How It Works
- Step 1: Download the prebuilt Excel template featuring Ellington Financial Inc. (EFC) data.
- Step 2: Review the pre-filled sheets to familiarize yourself with the essential metrics.
- Step 3: Modify forecasts and assumptions in the editable yellow cells (WACC, growth, margins).
- Step 4: Instantly access recalculated results, showcasing Ellington Financial Inc.’s (EFC) intrinsic value.
- Step 5: Make well-informed investment choices or create reports based on the outputs.
Why Choose This Calculator for Ellington Financial Inc. (EFC)?
- Designed for Experts: A sophisticated tool utilized by financial analysts, portfolio managers, and investors.
- Comprehensive Data: Ellington Financial’s historical and projected financials are preloaded for precise analysis.
- What-If Scenarios: Effortlessly simulate various forecasts and assumptions to explore potential outcomes.
- Detailed Results: Automatically computes intrinsic value, NPV, and essential financial metrics.
- User-Friendly: Clear, step-by-step instructions make the process straightforward and accessible.
Who Should Use This Product?
- Institutional Investors: Develop comprehensive and accurate valuation models for investment analysis in Ellington Financial Inc. (EFC).
- Financial Analysts: Evaluate various valuation scenarios to inform investment strategies and recommendations.
- Wealth Managers: Offer clients precise valuation insights and investment opportunities related to Ellington Financial Inc. (EFC).
- Students and Educators: Utilize real market data to enhance learning and practice in financial modeling and analysis.
- Market Enthusiasts: Gain insights into how financial firms like Ellington Financial Inc. (EFC) are assessed and valued in the market.
What the Template Contains
- Historical Data: Includes Ellington Financial Inc.'s (EFC) past financials and baseline forecasts.
- DCF and Levered DCF Models: Detailed templates to calculate Ellington Financial Inc.'s (EFC) intrinsic value.
- WACC Sheet: Pre-built calculations for Weighted Average Cost of Capital.
- Editable Inputs: Modify key drivers like growth rates, EBITDA %, and CAPEX assumptions.
- Quarterly and Annual Statements: A complete breakdown of Ellington Financial Inc.'s (EFC) financials.
- Interactive Dashboard: Visualize valuation results and projections dynamically.
Disclaimer
All information, articles, and product details provided on this website are for general informational and educational purposes only. We do not claim any ownership over, nor do we intend to infringe upon, any trademarks, copyrights, logos, brand names, or other intellectual property mentioned or depicted on this site. Such intellectual property remains the property of its respective owners, and any references here are made solely for identification or informational purposes, without implying any affiliation, endorsement, or partnership.
We make no representations or warranties, express or implied, regarding the accuracy, completeness, or suitability of any content or products presented. Nothing on this website should be construed as legal, tax, investment, financial, medical, or other professional advice. In addition, no part of this site—including articles or product references—constitutes a solicitation, recommendation, endorsement, advertisement, or offer to buy or sell any securities, franchises, or other financial instruments, particularly in jurisdictions where such activity would be unlawful.
All content is of a general nature and may not address the specific circumstances of any individual or entity. It is not a substitute for professional advice or services. Any actions you take based on the information provided here are strictly at your own risk. You accept full responsibility for any decisions or outcomes arising from your use of this website and agree to release us from any liability in connection with your use of, or reliance upon, the content or products found herein.