
|
Eos Energy Enterprises, Inc. (EOSE): 5 FORCES Analysis [Nov-2025 Updated] |
Fully Editable: Tailor To Your Needs In Excel Or Sheets
Professional Design: Trusted, Industry-Standard Templates
Investor-Approved Valuation Models
MAC/PC Compatible, Fully Unlocked
No Expertise Is Needed; Easy To Follow
Eos Energy Enterprises, Inc. (EOSE) Bundle
You're digging into the competitive landscape for Eos Energy Enterprises, Inc. (EOSE) right now, and honestly, it's a classic David vs. Goliath story playing out in the long-duration energy storage market as of late 2025. While their zinc chemistry offers a compelling, non-flammable alternative to lithium-ion, the pressure is intense: they face dominant rivals, yet boast a solid $\mathbf{\$644.4 \text{ million}}$ backlog as of September 2025, which helps offset the current scaling pains reflected in their $\mathbf{\$52.7 \text{ million}}$ Q3 2025 adjusted EBITDA loss. We've mapped out the five forces-from the low leverage of their abundant domestic suppliers to the high hurdles new entrants face-to give you a clear picture of where the real risks and opportunities lie for this US-based manufacturer projecting only $\mathbf{\$150 \text{ million}}$ to $\mathbf{\$160 \text{ million}}$ in 2025 revenue. Keep reading to see exactly how these dynamics shape their path forward.
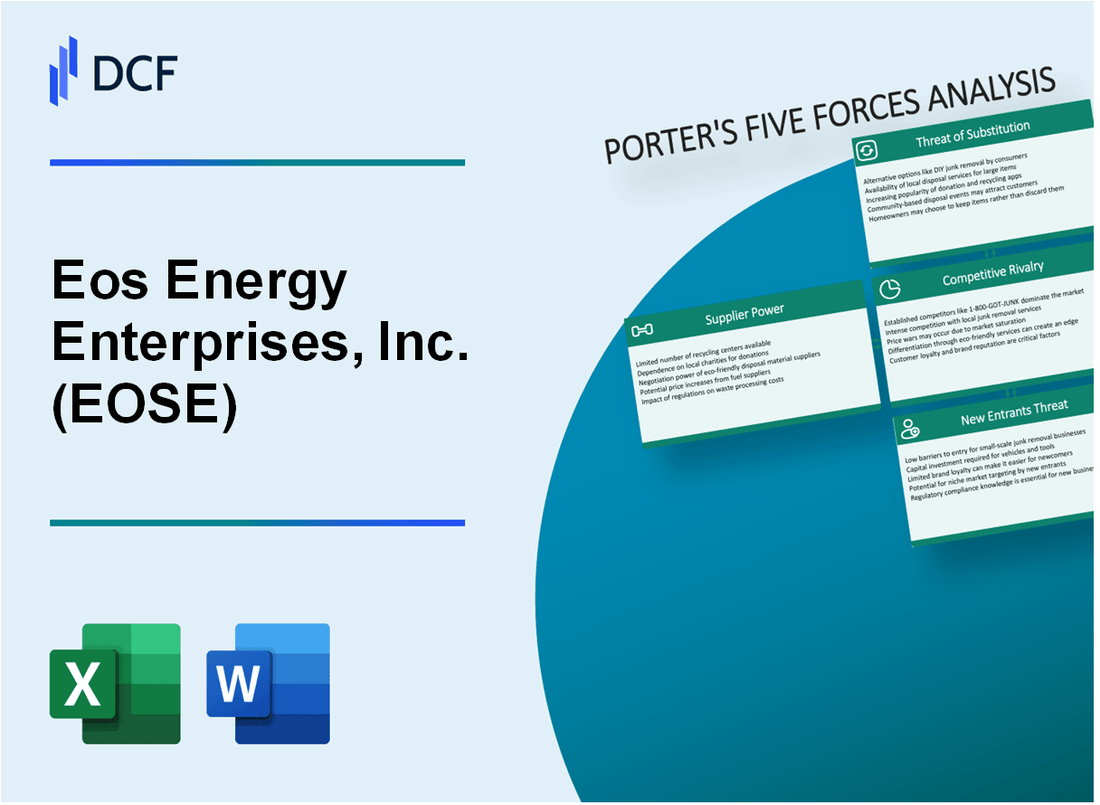
Eos Energy Enterprises, Inc. (EOSE) - Porter's Five Forces: Bargaining power of suppliers
The bargaining power of suppliers for Eos Energy Enterprises, Inc. (EOSE) appears relatively low, a direct consequence of the company's strategic technology choice and its aggressive focus on domestic manufacturing and supply chain resilience.
Eos Energy Enterprises' Znyth™ technology is inherently designed to mitigate geopolitical supply risks associated with dominant battery chemistries. You see this clearly in the material selection:
- - Low reliance on geopolitically sensitive materials like lithium.
- - Key components like zinc and water are abundant, reducing supplier scarcity power.
The company's commitment to American sourcing is a major factor limiting external supplier leverage. This focus is not just strategic for policy alignment but directly impacts supply security and cost predictability. Here's the quick math on their domestic advantage:
| Metric | Data Point (as of late 2025) |
| Domestic Content Ratio | Exceeding 90% |
| Manufacturing Capacity Goal (YE 2025) | Annualized rate of 2 GWh per year |
| Manufacturing Expansion Investment | $352.9 million |
| 2025 Full-Year Revenue Guidance (Low End) | $150 million |
The supply chain has seen targeted strengthening, moving away from the constraints experienced previously. This proactive management means suppliers have less leverage over Eos Energy Enterprises now than they might have had in prior periods.
- - Supply chain was diversified in early 2025 after prior bottlenecks were resolved.
The resolution of prior bottlenecks, which involved enhancing performance from an existing supplier alongside adding additional new supplier capacity, confirms the successful execution of supply chain diversification efforts that started in early 2025. This diversification reduces dependency on any single source for critical inputs.
Eos Energy Enterprises, Inc. (EOSE) - Porter's Five Forces: Bargaining power of customers
You're looking at Eos Energy Enterprises, Inc. (EOSE) through the lens of customer power, and honestly, it's a mixed bag right now. The power of the buyer is inherently high because the typical customers-large utility operators and major project developers-are few in number but command massive procurement volumes. These are not small, fragmented buyers; they are sophisticated entities that can negotiate hard on price and terms for multi-megawatt or gigawatt-hour projects. That concentration definitely gives them leverage.
Still, customers definitely have alternatives. The market for battery energy storage systems (BESS) is dominated by established lithium-ion providers, which means Eos Energy Enterprises, Inc. (EOSE) is competing against incumbents with proven, scaled supply chains. If Eos Energy Enterprises, Inc. (EOSE) can't meet a specific technical requirement or price point, a large utility can pivot to a competitor's lithium-ion offering, so that threat of substitution is real.
But here's where Eos Energy Enterprises, Inc. (EOSE) pushes back: the US-made product eligibility for Inflation Reduction Act (IRA) tax credits. Because Eos Energy Enterprises, Inc. (EOSE) manufactures its zinc-based systems in the United States, projects using their technology can often capture significant domestic content bonuses. This translates directly into lower effective project costs for the customer, which is a powerful incentive that can override some of the negotiating leverage they might otherwise have. It's a key differentiator that helps Eos Energy Enterprises, Inc. (EOSE) secure deals.
To give you a clear picture of the current commercial standing that tempers customer power, look at these hard numbers as of late 2025:
| Metric | Value as of Sep 30, 2025 | Context |
|---|---|---|
| Orders in Backlog | $644.4 million | Near-term revenue commitment from customers. |
| Total Commercial Pipeline | $22.6 billion | Total identified long duration energy storage demand. |
| Data Center Pipeline Share | 22% | Concentration within the total pipeline. |
The backlog acts as a near-term lock-in, making it difficult for those specific customers to walk away from committed orders. However, the pipeline shows both risk and opportunity regarding customer concentration. Here's the quick math on that:
- Strong backlog of $644.4 million as of September 30, 2025, locks in near-term revenue.
- Total commercial pipeline reached $22.6 billion as of September 30, 2025.
- Data center segment now accounts for approximately 22% of the total pipeline.
- The pipeline also includes utilities and industrial customers, diversifying the base.
Finance: draft 13-week cash view by Friday.
Eos Energy Enterprises, Inc. (EOSE) - Porter's Five Forces: Competitive rivalry
You're looking at a market where Eos Energy Enterprises, Inc. is fighting for space against established giants. The rivalry is definitely intense, especially when you stack Eos Energy Enterprises up against dominant, scaled lithium-ion incumbents like Tesla or CATL, who have massive manufacturing footprints and deep customer relationships.
Eos Energy Enterprises is still in a significant scaling phase, which puts pressure on its competitive footing right now. For instance, the company is projecting full-year 2025 revenue in the range of $150 million to $160 million. To put that into perspective against the incumbents, consider the operational losses that come with this growth push. Eos Energy Enterprises reported an Adjusted EBITDA loss of $52.7 million for the third quarter of 2025. That loss, while accompanied by a record quarterly revenue of $30.5 million in Q3 2025, shows the cost of scaling production.
Still, Eos Energy Enterprises is making moves to stand out. Differentiation is strong, primarily through its non-flammable zinc chemistry and its commitment to US manufacturing. This is a key differentiator in a market where safety and domestic supply chains are increasingly important factors for buyers.
The competition is certainly heating up in the rapidly growing long-duration storage market. Eos Energy Enterprises is building a commercial pipeline that speaks to this demand, but it also shows the scale of the opportunity they are chasing. Here's a quick look at their commercial momentum as of September 30, 2025:
- Commercial Pipeline Value: $22.6 billion
- Commercial Pipeline Capacity: Approximately 91 GWh
- Order Backlog Value: Approximately $644.4 million
- Order Backlog Capacity: Approximately 2.5 GWh
The company's ability to convert this pipeline into revenue while managing costs is the critical near-term challenge. You can see the scale-up is underway, but profitability remains a hurdle. The Q3 2025 results showed a Gross Loss of $33.9 million, even as revenue doubled sequentially to $30.5 million from $15.2 million in Q2 2025.
The path to competing effectively hinges on manufacturing execution. Eos Energy Enterprises is aiming to ramp production to an annualized rate of 2 GWh per year by year-end 2025. This is a massive jump, as Q3 2025 capacity utilization was only at 15%, with management targeting 90-plus% utilization exiting Q4 2025.
To give you a clearer picture of the financial state supporting this rivalry and scaling effort, here are some key figures from the end of Q3 2025:
| Metric | Amount (as of Sept 30, 2025) |
|---|---|
| Total Cash Reserves | $126.8 million |
| Q3 2025 Revenue | $30.5 million |
| Q3 2025 Adjusted EBITDA Loss | $52.7 million |
| Q3 2025 Net Loss Attributable to Shareholders | $641.4 million |
The rivalry dynamic is therefore one where Eos Energy Enterprises must rapidly scale its US-made, differentiated product to capture a share of the growing pipeline before incumbents fully pivot their massive capacity to long-duration needs. Finance: draft 13-week cash view by Friday.
Eos Energy Enterprises, Inc. (EOSE) - Porter's Five Forces: Threat of substitutes
The threat of substitution for Eos Energy Enterprises, Inc. (EOSE) is dynamic, heavily dependent on the required energy storage duration. For short-duration needs, the incumbent technology presents a significant challenge, but Eos Energy Enterprises' Znyth technology is specifically targeting the longer-duration segments where substitutes are less mature or cost-prohibitive for Li-ion.
- High threat from mature lithium-ion for short-duration (2-4 hour) applications.
- Lower threat in the core 3-12 hour LDES market where Znyth competes.
- Alternative LDES technologies like flow batteries and compressed air are viable substitutes.
- Eos Energy Enterprises' non-flammable, non-toxic chemistry offers a safety advantage over lithium-ion.
For short-duration needs, the threat from established lithium-ion (Li-ion) is substantial. The average capital expenditure (capex) for a 4-hour duration Li-ion battery energy storage system (BESS) was reported at US$304/kWh in 2023, with US-based installed costs averaging US$353/kWh. Eos Energy Enterprises is positioning its Znyth technology for medium-to-long duration applications, specifically targeting 4 to 16+ hours. This positioning is key, as the cost reduction trajectory for Li-ion, driven by massive deployment in both transport and power sectors, is expected to outpace that of most Long-Duration Energy Storage (LDES) technologies this decade.
The core LDES market, where Eos Energy Enterprises focuses, sees a reduced, though still present, threat from Li-ion. Eos Energy Enterprises reaffirmed its 2025 revenue guidance between $150 million and $190 million, with a commercial opportunity pipeline reaching $22.6 billion as of September 30, 2025. This pipeline conversion is Eos Energy Enterprises' immediate focus, but the long-duration requirement inherently limits the direct substitution by standard Li-ion systems, which are better suited for shorter shifts.
Alternative LDES technologies are viable substitutes, particularly in the utility-scale segment. Flow batteries and compressed air energy storage (CAES) have shown the most commercial success among non-Li-ion LDES options. The global stationary flow battery storage market exceeded USD 7.6 billion in 2024, with the North America segment holding a 47% share in 2024. The utility segment was the largest end-user, accounting for approximately 53% of the global flow battery market in 2024.
Here's a quick look at the comparative capital costs for different storage types, based on the latest available surveys:
| Technology | Duration Focus | Average Capital Expenditure (Capex) |
| Lithium-ion (Li-ion) | 4-hour | US$304/kWh |
| Compressed Air Energy Storage (CAES) | 8-hour | $293/kWh |
| Thermal Energy Storage | 8-hour | $232/kWh |
| Flow Batteries (Average) | Longer Duration | US$444/kWh (2023) |
| Flow Batteries (Best Rate/LCOS) | 10+ hours | As low as $0.06/kWh |
Eos Energy Enterprises' Znyth technology, a zinc-based system, is positioned against these substitutes. While specific 2025 LCOS data for Znyth is not public, the DOE analysis places zinc battery varieties near flow batteries on a cost-performance basis for long duration, citing $0.08/kWh. Eos Energy Enterprises' third quarter 2025 revenue was $30.5 million, indicating ongoing commercialization against these competitive alternatives. The non-flammable, non-toxic chemistry of Eos Energy Enterprises' technology provides a distinct safety and operational advantage over Li-ion, which is critical for utility and industrial customers managing risk profiles. For instance, Eos Energy Enterprises secured a 750 MWh master supply agreement with MN8 Energy, demonstrating traction despite the competitive landscape.
Finance: draft 13-week cash view by Friday.
Eos Energy Enterprises, Inc. (EOSE) - Porter's Five Forces: Threat of new entrants
You're looking at the barriers to entry in the energy storage manufacturing space, and for Eos Energy Enterprises, Inc. (EOSE), the hurdles for a newcomer are quite steep right now. Building a competitive battery gigafactory isn't like setting up a software shop; it demands serious, upfront capital.
- - High capital expenditure is required for manufacturing scale-up to the 2 GWh annualized rate.
- - Strong intellectual property (IP) portfolio with over 122 patents creates a barrier.
- - New entrants face high bankability and customer confidence hurdles without a proven track record.
- - Government incentives like IRA tax credits favor existing domestic manufacturers.
Let's look at the money needed just to get to the starting line. Eos Energy Enterprises, Inc. is aggressively scaling its 'Project AMAZE' facility in Pittsburgh to hit an annualized rate of 2 GWh by the end of 2025. This expansion involves a substantial investment, with the company committing approximately $352.9 million toward the facility move and scale-up, supported in part by a $277 million Department of Energy loan. To put that in perspective, a 2022 estimate suggested a 1 GWh factory required about $50 million in capital investment, which was noted as being 60% lower than a comparable Lithium-ion facility. Still, that initial outlay is significant, and new entrants must secure similar, massive funding just to compete on volume.
The technological moat is also substantial. Eos Energy Enterprises, Inc. relies on its proprietary Znyth™ battery chemistry and system design, protected by its IP. While the exact count as of late 2025 isn't public, the company has a history of building this defense; as of early 2023, they cited 93 patents pending, issued, or published across 23 countries. New players must either license this technology-which is unlikely for a direct competitor-or spend years and millions developing non-infringing, equally effective alternatives. That R&D runway is a major deterrent.
Beyond the factory floor, there's the customer trust factor. You can have the best battery, but if a utility or data center developer can't secure project financing based on your product's long-term reliability, you're stuck. Eos Energy Enterprises, Inc. has been actively tackling this by launching a comprehensive insurance program to boost technology bankability. They are backing this up with tangible commercial success; as of the third quarter of 2025, their commercial opportunity pipeline stood at $22.6 billion, with a firm orders backlog of $644.4 million. Landing a 750 MWh master supply agreement with MN8 Energy, for example, provides the proven track record that a startup simply won't have yet.
Finally, the regulatory environment, particularly the Inflation Reduction Act (IRA) and subsequent legislative changes, heavily favors domestic producers like Eos Energy Enterprises, Inc. The IRA offers production tax credits like the 45X, providing up to $35 per kWh for domestically produced battery cells. For 2025, to qualify for the full clean vehicle tax credit component, the critical mineral requirement is 60 percent sourced domestically or from a free-trade partner. Furthermore, the One Big Beautiful Bill Act (OBBBA), signed in July 2025, introduced stricter Foreign Entity of Concern (FEOC) restrictions that apply to tax years beginning after July 4, 2025, effectively creating a policy preference for established U.S. supply chains, which new entrants would struggle to meet immediately.
Here's a quick look at the scale of the barriers Eos Energy Enterprises, Inc. has already overcome or is currently managing:
| Barrier Component | Metric/Value | Context/Date |
|---|---|---|
| Manufacturing Scale-Up Target | 2 GWh annualized rate | Expected by year-end 2025 |
| Projected Capital Expenditure (Project AMAZE) | $352.9 million | Investment for HQ move and manufacturing expansion |
| Commercial Pipeline Strength | $22.6 billion | As of Q3 2025 |
| Firm Orders Backlog | $644.4 million | As of September 30, 2025 |
| Key Supply Agreement Size | 750 MWh | Master supply agreement with MN8 Energy |
| IRA Critical Mineral Requirement | 60 percent | Applicable percentage for clean vehicle tax credit in 2025 |
| IRA Production Tax Credit (Cells) | $35 per kWh | Section 45X credit for domestically produced battery cells |
| Established Patent Base (Latest Count) | 93 patents (issued/pending/published) | As of December 31, 2022 |
The capital intensity during this scale-up phase is definitely a concern analysts watch, but for a new entrant, matching the existing production ramp and the secured commercial pipeline is the defintely tougher challenge. Finance: draft 13-week cash view by Friday.
Disclaimer
All information, articles, and product details provided on this website are for general informational and educational purposes only. We do not claim any ownership over, nor do we intend to infringe upon, any trademarks, copyrights, logos, brand names, or other intellectual property mentioned or depicted on this site. Such intellectual property remains the property of its respective owners, and any references here are made solely for identification or informational purposes, without implying any affiliation, endorsement, or partnership.
We make no representations or warranties, express or implied, regarding the accuracy, completeness, or suitability of any content or products presented. Nothing on this website should be construed as legal, tax, investment, financial, medical, or other professional advice. In addition, no part of this site—including articles or product references—constitutes a solicitation, recommendation, endorsement, advertisement, or offer to buy or sell any securities, franchises, or other financial instruments, particularly in jurisdictions where such activity would be unlawful.
All content is of a general nature and may not address the specific circumstances of any individual or entity. It is not a substitute for professional advice or services. Any actions you take based on the information provided here are strictly at your own risk. You accept full responsibility for any decisions or outcomes arising from your use of this website and agree to release us from any liability in connection with your use of, or reliance upon, the content or products found herein.