
|
Farmer Bros. Co. (FARM): PESTLE Analysis [Nov-2025 Updated] |
Fully Editable: Tailor To Your Needs In Excel Or Sheets
Professional Design: Trusted, Industry-Standard Templates
Investor-Approved Valuation Models
MAC/PC Compatible, Fully Unlocked
No Expertise Is Needed; Easy To Follow
Farmer Bros. Co. (FARM) Bundle
You're trying to figure out what the new, leaner Farmer Bros. Co. (FARM) looks like now that they've pivoted to a pure-play coffee manufacturer, especially with that $100 million cash boost for reinvestment. Honestly, while the balance sheet looks cleaner, the external pressures-think volatile Arabica prices, rising labor costs, and intense sustainability demands-are the real story shaping their 2025 performance. Dive below to see the full PESTLE breakdown that maps these risks and opportunities to clear actions for your own analysis.
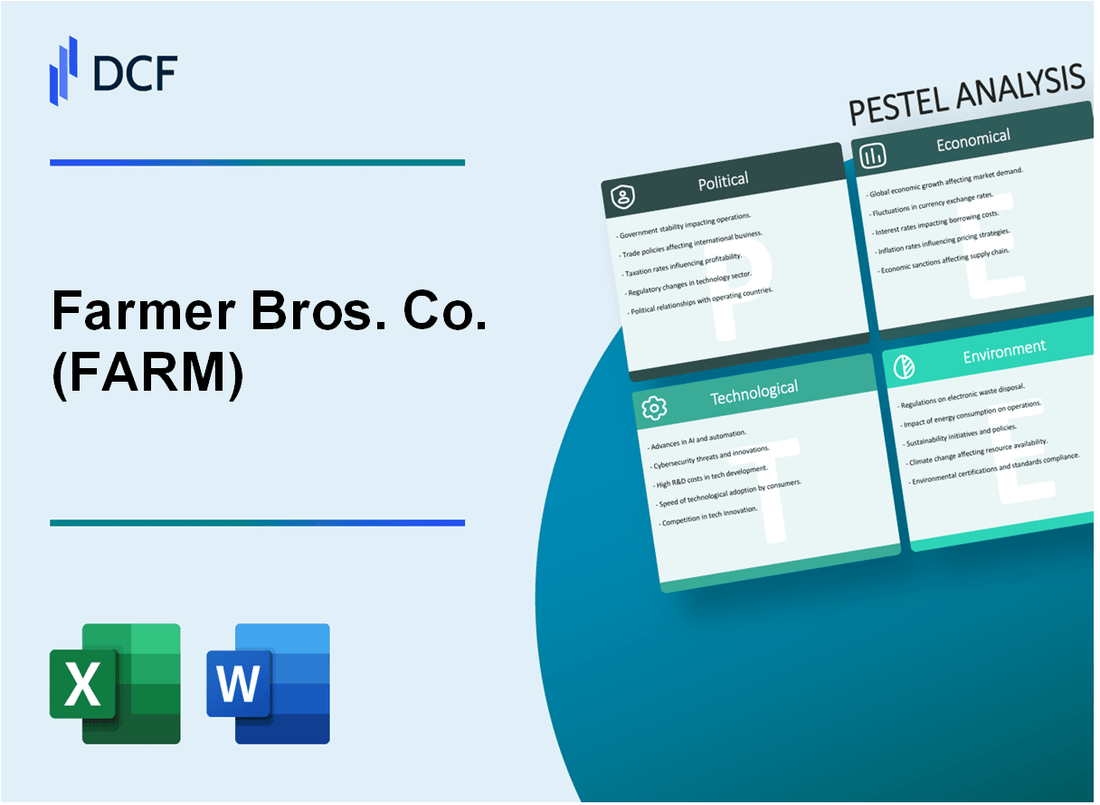
Farmer Bros. Co. (FARM) - PESTLE Analysis: Political factors
US trade policy shifts affect green coffee import tariffs.
The political volatility in US trade policy created a massive, short-term cost risk for Farmer Bros. Co. in fiscal year 2025. We saw a dizzying swing from new tariffs to a near-total rollback, which is a classic example of political risk translating directly into procurement cost uncertainty. Initially, a universal 10% tariff on most imported goods, including green coffee, took effect in April 2025, followed by a severe escalation: a 50% tariff on Brazilian green coffee imports, effective August 1, 2025. Brazil is a critical global supplier, so this move immediately spiked market volatility.
Here's the quick math: a 50% tariff on a major origin country's supply chain would have forced a complete, costly, and rapid re-blending of Farmer Bros. Co.'s product line. However, the political pressure from rising consumer prices forced a sharp reversal. By November 2025, the US government removed almost all tariffs on green coffee imports, including the 40% levy on Brazilian agricultural imports, backdating the change to November 13, 2025. This reversal is a huge, immediate win for cost stability, but it defintely highlights the fragility of the global supply chain.
| Key US Green Coffee Tariff Shifts (FY 2025) | Effective Date | Tariff Rate | Impact on Farmer Bros. Co. |
|---|---|---|---|
| Universal Reciprocal Tariff | April 5, 2025 | 10% | Increased raw material cost baseline. |
| Brazil-Specific Tariff | August 1, 2025 | 50% | Major supply chain disruption; forced sourcing pivot. |
| Tariff Rollback (Coffee) | November 2025 | 0% (on most origins) | Immediate cost relief; stabilized procurement strategy. |
Regulatory enforcement of Food and Drug Administration (FDA) standards remains a constant operational cost.
While the political climate has pushed for deregulation in some areas, the FDA's enforcement of food safety standards remains a non-negotiable operational cost for a major food manufacturer like Farmer Bros. Co. The focus in 2025 is less on new rules and more on stricter enforcement of existing ones, particularly for imported products. The FDA is using new technology to increase scrutiny on imports: a July 2025 policy change mandated that all entries of FDA-regulated products must be reviewed for admissibility, regardless of their value, which increases the risk of customs delays and detentions.
The company must maintain rigorous compliance with the Food Safety Modernization Act (FSMA), especially the Foreign Supplier Verification Programs (FSVP). Still, a key political development has temporarily eased one major compliance burden. Congress halted funding for the enforcement of the Food Traceability Rule (under FSMA Section 204) until July 20, 2028. This political action effectively delays a significant, costly IT and process overhaul that would have been critical in 2025, freeing up capital for other operational improvements.
- Strengthen FSVP documentation for all green coffee suppliers.
- Prepare for increased import scrutiny at US ports.
- Reallocate capital from the now-delayed Food Traceability Rule compliance.
Geopolitical stability in key coffee-producing nations impacts supply chain reliability.
The political and economic instability in coffee-producing nations directly translates into price volatility and supply risk for Farmer Bros. Co. The global coffee market in 2025 was a powder keg, with Arabica futures surging to a record high of approximately $4.41 per pound in the first half of the year, driven by a mix of climate shocks and geopolitical tensions. For a company that reported $342.3 million in net sales for fiscal 2025, this volatility is a direct threat to the 43.5% gross margin they achieved.
Political instability in key regions, such as labor protests and port strikes in Colombia, or currency fluctuations in Brazil and Vietnam, creates logistical bottlenecks and price uncertainty. This forces Farmer Bros. Co. to invest more in hedging (using coffee-related derivative instruments) and to diversify its sourcing portfolio, which adds complexity and cost to procurement. The risk isn't just price; it's the reliability of supply that feeds their direct-store-delivery (DSD) network.
Government contracts for foodservice, a significant channel, face budget scrutiny.
As a major supplier to institutional buyers, including healthcare facilities and large foodservice operators, Farmer Bros. Co.'s revenue stream is indirectly exposed to US government budget scrutiny. The new administration's focus on cost efficiency in 2025, spearheaded by the Department of Government Efficiency (DOGE), mandated that federal agencies review and potentially terminate or modify all existing contracts by March 26, 2025. This is a political risk that impacts the entire institutional foodservice channel.
The trend is a shift toward fixed-price contracts to transfer financial risk away from the government and onto the contractor. This means less flexibility for Farmer Bros. Co. to pass on sudden raw material cost spikes-like the mid-year tariff shock-to its government-linked customers. The company must now factor in a higher political risk premium when bidding on or renewing large institutional contracts, especially those tied to federal or state funding, to protect its margins from the green coffee price volatility that is expected to pressure gross margins into the high 30s in fiscal 2026.
Farmer Bros. Co. (FARM) - PESTLE Analysis: Economic factors
You're looking at the economic landscape for Farmer Bros. Co. right now, and honestly, it's a mixed bag of commodity shock and resilient consumer habits. My take, based on the 2025 fiscal year close, is that managing input costs is the single most important lever you have, especially since you've already locked in some pricing wins.
Arabica coffee futures show high volatility, impacting cost of goods sold (COGS)
The raw material cost is definitely keeping procurement teams on edge. Arabica coffee futures were the star performer in Q3 2025, climbing 22.2% that quarter alone, pushing the year-to-date increase to 17.23% by late October. Nearby futures settled at $3.7485 per pound on September 30, 2025, and kept climbing to $4.0115 by late November. This volatility directly hit your COGS. For instance, in the first quarter of fiscal 2026, your gross margins compressed to 39.7%, a roughly 400 basis point decline year-over-year, because you chose to hold off on further price increases. You need to be ready for continued pressure, as the company anticipates a significant increase in overall COGS in fiscal 2026.
Persistent inflation in the foodservice sector pressures customer pricing and margin
While you managed to push your FY2025 gross margin up to 43.5% from 39.3% the year prior through proactive pricing, that leverage is fading. The broader foodservice sector is still seeing price hikes; the USDA projected food-away-from-home prices to rise by 3.4% for 2025, and the September index showed a 3.7% annual increase. This environment means your customers are feeling the squeeze, which limits how much you can pass along. We expect margins to average in the high 30s throughout fiscal 2026 as a result of this input cost/pricing tension. That's the reality check for the next few quarters.
High interest rates make capital expenditure on new roasting equipment more expensive
Higher borrowing costs definitely make financing big equipment purchases a tougher call. You saw this reflected in your fiscal 2025 capital expenditures, which came in at $9.6 million, a noticeable drop from $13.8 million in fiscal 2024, mainly because you cut back on coffee brewing equipment spend. The plan for fiscal 2026 is more conservative, targeting $9-$11 million in CapEx. It's smart to be disciplined here; every dollar spent on debt service or new CapEx is a dollar not available for working capital when commodity prices are spiking.
The company's post-DSD sale balance sheet shows a cash increase of over $100 million for strategic reinvestment
Now, let's talk balance sheet strength, because this is where the strategic moves are paying off, though perhaps not to the $100 million figure you mentioned. The DSD sale was a major deleveraging event. As of June 30, 2025, your unrestricted cash stood at $6.8 million, and you had $14.3 million borrowed on the revolver. The key metric is the net debt position, which improved by roughly $10 million over the year. More importantly, your free cash flow generation was much better, hitting $6.5 million for the full fiscal year 2025-a $34.5 million year-over-year increase. That improved cash flow is your real strategic asset right now.
US consumer spending on out-of-home coffee remains strong, driving B2B demand
Here's the good news supporting your B2B sales pipeline: the American consumer still wants their coffee out of the house. The overall out-of-home coffee market in the US is projected to expand at a 4.6% CAGR through 2035. In Spring 2025, 66% of Americans drank coffee daily, and those drinking specialty coffee were more likely to get it prepared out-of-home (35% vs. 20% for traditional drinkers). This signals that while consumers are price-sensitive, they still value the quality and experience you provide to your foodservice clients. You need to make sure your value-added services-like market insight and beverage planning-are front and center to capture this demand.
Finance: draft 13-week cash view by Friday
Farmer Bros. Co. (FARM) - PESTLE Analysis: Social factors
You're looking at a consumer base that cares deeply about where their coffee comes from, which directly impacts how Farmer Bros. Co. needs to position its premium and specialty offerings. The demand for ethically sourced beans isn't just a niche anymore; it's mainstream. For instance, over 65% of coffee consumers in the US now say they are willing to pay more for coffee that is certified sustainable. This trend is fueling the Fair Trade segment, which the market projects to grow at a compound annual growth rate of about 10.10% through 2033. For Farmer Bros. Co., which already lists organic and Direct Trade options, this means your sourcing story is a critical sales tool, not just a compliance checkbox.
Health consciousness is also reshaping the cup itself. Consumers are moving past simply cutting sugar; they want functional benefits baked right in. While black coffee is seeing a resurgence due to a desire for authenticity, we're also seeing rapid growth in coffee fortified with ingredients like adaptogens or nootropics. Organic coffee search interest spiked notably in the summer months of July and August 2025. This suggests that for your specialty tier, the opportunity isn't just in the bean quality but in the clean label-think low-sugar formulations using natural sweeteners like monk fruit, which are becoming more common.
The labor market remains a persistent headache, affecting both sourcing and your internal operations like manufacturing and distribution. While wage growth has slowed to about 4% over the last two years, the average wage in food manufacturing is now around $59,873 per year, up 23% since the pandemic era. Farmer Bros. Co. itself noted navigating labor market shortages in its Fiscal 2025 results. If you can't staff your roastery or delivery routes efficiently, your margins-which improved to 43.5% in Fiscal 2025-are at risk of erosion from unexpected labor costs.
The way people work has fundamentally changed the Office Coffee Service (OCS) segment. Hybrid work is now the expected baseline, with about 69% of global workers preferring it. This means the traditional bulk-brew model for a full office floor is less reliable. Companies are actively redesigning breakrooms to be collaboration hubs, making the quality of the coffee a key perk to draw employees back in. So, while the total volume might shift, the value per cup in the office is rising-employees now expect barista-level drinks like lattes and cold brew. Honestly, this is a chance to pivot OCS contracts toward high-end, customizable equipment and premium bean sales.
Here's a quick look at some of the social data points impacting your strategy:
| Social Factor Area | Key Metric/Data Point (2025) | Source/Context |
|---|---|---|
| Ethical Demand | 65% of consumers willing to pay a premium for sustainable coffee | Consumer willingness to pay |
| Fair Trade Growth | CAGR of 10.10% (forecasted 2025-2033) | Fair Trade Coffee Market projection |
| Labor Challenge | 47% of food manufacturers cite lack of qualified candidates as biggest challenge | Food Manufacturing Labor Survey (Q3 2024) |
| Manufacturing Wages | Average sector wage of $59,873/year (up 23% since pandemic) | US Food Manufacturing data |
| Work Style | 69% of global workers prefer hybrid work models | WEF 2025 Global Workforce Outlook |
If your DSD (Direct Store Delivery) route optimization efforts, which you've been pushing, are hampered by driver retention due to wage competition, that $342.3 million in fiscal 2025 net sales could stall. We defintely need to model the cost of a 5% wage increase against the savings from route optimization.
Finance: draft 13-week cash view by Friday.
Farmer Bros. Co. (FARM) - PESTLE Analysis: Technological factors
You're looking at how Farmer Bros. Co. is using technology to claw back margin and streamline a complex national distribution network. Honestly, the numbers from fiscal 2025 show they are making progress on efficiency, even if they aren't detailing every new piece of hardware.
The big takeaway is that operational improvements, which technology underpins, helped push the gross margin up to 43.5% in fiscal 2025, a 420 basis point jump from the prior year's 39.3%. That kind of margin expansion doesn't happen by accident; it requires process refinement.
Increased adoption of automated roasting and packaging systems to improve efficiency and yield
While Farmer Bros. Co. doesn't publish a specific metric for automation adoption, the focus on internal efficiency gains across manufacturing is a clear indicator of tech deployment. They explicitly cited capturing internal efficiency gains from their manufacturing optimization initiatives in fiscal 2025.
This kind of efficiency gain in a roasting and packaging environment usually means investing in better throughput and less waste. Their capital expenditures for the full fiscal year 2025 were $9.6 million. That spend, lower than the $13.8 million in fiscal 2024, suggests a shift from large-scale asset replacement to potentially more targeted technology upgrades, like automation, or perhaps a planned slowdown in CapEx following major prior investments.
Here's a quick look at the spending context:
| Metric | Fiscal 2025 Value (in thousands) | Fiscal 2024 Value (in thousands) |
| Capital Expenditures Paid | $9,600 | $13,800 |
| Net Sales | $342,300 | $341,100 |
What this estimate hides is the specific return on investment for any new automation; we only see the aggregate CapEx number.
Use of predictive analytics to manage complex green coffee inventory and commodity risk
The company has definitely been working on inventory control. They completed initiatives to rationalize their coffee SKU (Stock Keeping Unit) portfolio, which directly helps procurement and inventory management capabilities. This is a foundational step that makes any advanced analytics more effective.
Managing green coffee inventory and commodity risk is a constant battle, especially given the volatility in global coffee prices. While they don't detail their predictive models, the improved gross margin to 43.5% in fiscal 2025 suggests better cost control, which is the goal of such systems.
The focus on inventory management is also reflected in their cash flow: net cash provided by operating activities in fiscal 2025 increased by $30.2 million compared to fiscal 2024, driven in part by a decrease in inventory. That's a tangible result of better planning, whether through analytics or SKU cuts.
Digital integration with foodservice distributors streamlines B2B ordering and logistics
Farmer Bros. Co. serves a massive customer base, from small restaurants to large institutional buyers, primarily through its Direct Store Delivery (DSD) network, which utilized over 200 delivery routes as of June 30, 2025. Managing this requires sophisticated logistics.
The company relies on this DSD network and also uses 3PL (Third-Party Logistics) providers for long-haul distribution. Streamlining B2B ordering means integrating their systems with these distributors and customers. The general focus on network optimization initiatives suggests they are driving toward better data flow across this chain.
Key logistical touchpoints as of fiscal year-end 2025:
- Over 200 nationwide DSD routes.
- Over 90 storage locations.
- Use of 3PLs for long-haul transport.
If onboarding takes 14+ days, churn risk rises, so digital speed here is defintely key.
Investment in new single-serve and cold brew processing technology is critical for growth
Consumer trends are clearly pushing Farmer Bros. Co. toward ready-to-drink and single-serve formats, which are critical growth areas. The company's product offerings already include ready-to-drink cold brew and iced coffee.
The technological investment here is tied to capturing this demand. The launch of their new specialty coffee brand, Sum>One Coffee Roasters, in March 2025, signals a direct push into higher-value segments where single-serve and specialty processing matter most.
This focus is strategic because while unit sales decreased by 12.3% in fiscal 2025, the average unit price increased by 14.5%, leading to a net sales increase of 0.3% to $342.3 million. Moving volume into higher-priced, potentially tech-enabled formats like cold brew or single-serve is how they plan to drive top-line revenue growth in fiscal 2026.
Finance: draft 13-week cash view by Friday.
Farmer Bros. Co. (FARM) - PESTLE Analysis: Legal factors
You're looking at the legal landscape for Farmer Bros. Co. as of late 2025, and honestly, the biggest legal anchor right now is the structure you built around the Direct Store Delivery (DSD) business. Remember that big sale of the direct ship business back in 2023? That agreement fundamentally shifted your operational compliance focus almost entirely to DSD, which management rightly calls your most profitable channel. Near-term operations are dictated by maintaining the service levels and route optimization within that DSD network, as the company continues to execute on that focused strategy through fiscal 2025.
Compliance with the terms of the major Direct Store Delivery (DSD) sale agreement dictates near-term operations
The legal framework from the 2023 sale to TreeHouse Foods means your near-term operational compliance is laser-focused on DSD. This strategic pivot, designed to improve margins, means you must adhere strictly to any ongoing manufacturing or transition clauses that might still be in effect, even as you push for route optimization and customer penetration in that channel. The legal structure now supports a leaner operation centered on DSD, which is key to realizing the efficiency gains management is reporting.
Stricter state-level labor laws, including minimum wage hikes, affect manufacturing costs
State-level labor laws present a persistent, though often geographically varied, legal headwind. While we don't have Farmer Bros. Co.'s specific manufacturing labor cost breakdown for 2025, the broader U.S. context shows significant pressure. For instance, in the agricultural sector, some regions saw Adverse Effect Wage Rate (AEWR) changes in 2025 ranging from a 2% decrease to a 10% increase, and national heavy/tractor-trailer driver wages rose 25% over five years. If your remaining manufacturing or distribution roles are subject to state minimum wage hikes, these costs will eat into the 43.5% gross margin you achieved in fiscal 2025. You need to keep a close eye on where your production staff is located; California, for example, saw a modest 1% increase for H-2A workers in some categories, but other states saw much higher jumps.
Here's a quick look at the numbers grounding your 2025 operational scale:
| Metric (Fiscal Year 2025) | Value |
| Net Sales | $342.3 million |
| Gross Margin | 43.5% |
| Adjusted EBITDA | $14.8 million |
| Capital Expenditures | $9.6 million |
Food safety regulations (e.g., FSMA) require continuous investment in compliance and record-keeping
Federal mandates like the Food Safety Modernization Act (FSMA) mean compliance isn't a one-time fix; it's a continuous legal obligation requiring investment in processes and record-keeping. For a company handling coffee, tea, and culinary products, maintaining rigorous traceability and preventative controls is non-negotiable to avoid costly shutdowns or recalls. While your capital expenditures for fiscal 2025 were $9.6 million, a decrease from the prior year, you must ensure that a sufficient portion of that spend, or operating budget, is dedicated to maintaining and upgrading systems to meet evolving FSMA standards. What this estimate hides is the ongoing cost of labor dedicated solely to compliance documentation.
Patent protection for proprietary coffee blends and processing methods is a priority
Protecting your intellectual property (IP) is a core legal defense, especially as you roll out new tiers like the Sum>One Coffee Roasters brand. Farmer Bros. Co. confirms it owns a number of United States trademarks and service marks registered with the United States Patent and Trademark Office (USPTO). For your proprietary coffee blends and unique processing methods, maintaining active trademark and, where applicable, patent protection is crucial. This legal shield prevents competitors from copying your value proposition. Defintely check the renewal dates on your key marks.
- Protect registered trademarks and service marks.
- Secure patents for novel processing techniques.
- Ensure vendor agreements cover IP use rights.
- Monitor for potential IP infringement by rivals.
Finance: draft 13-week cash view by Friday.
Farmer Bros. Co. (FARM) - PESTLE Analysis: Environmental factors
You're looking at the environmental pressures on Farmer Bros. Co. as we move through 2025, and honestly, the biggest story is that they've already hit some major internal targets, which is great, but the external supply chain risks are still very real.
Climate change impacts on key coffee-growing regions threaten long-term supply stability
The climate is making sourcing a tightrope walk. While Farmer Bros. Co. has been proactive, the external environment is volatile. For instance, in late 2024, Arabica prices had jumped 13% in December alone, with Robusta prices doubling compared to 2023 levels, showing just how quickly supply shocks hit the market. Brazil, your largest supplier region, was forecasting a 4.4% drop in its 2025 production, with Arabica output specifically expected to decline by 12%. This volatility directly impacts your cost of goods sold and inventory planning.
Here's a snapshot of the market turbulence we are seeing as a result of these climate events:
| Metric | Peak Price (Recent High) | Current Price (Approx. Late 2024/Early 2025) | Source of Volatility |
| Arabica Coffee (per lb) | US$4.30 | US$2.80 | Droughts, supply adjustments |
| Robusta Coffee (per lb) | US$2.75 | US$1.73 | Adverse weather in Vietnam/Indonesia |
What this estimate hides is that these price swings are a symptom of long-term risk; studies suggest that suitable growing areas for Arabica could shrink by up to 50% by 2050.
Customer and investor pressure for sustainable packaging (e.g., compostable, recyclable) is rising
Even though your Scope 1 and 2 emission goals are met, the focus is shifting downstream to packaging and product lifecycle. Investors are watching how you handle materials, not just energy use. While I don't have the exact 2025 packaging mix for Farmer Bros. Co., the industry trend demands a pivot away from single-use plastics. Your commitment to waste diversion shows you understand the material flow challenge, having diverted 320,000 Tons of waste in 2024. You need to map out a clear, public-facing roadmap for achieving compostable or highly recyclable packaging across your major product lines, especially for your foodservice clients who are under similar pressure.
Increased scrutiny on water usage in coffee processing requires efficiency investments
Coffee processing is water-intensive, and as climate change drives regional droughts-like the one that hit Vietnam's Robusta yield by 20% in 2023/24-water stewardship becomes a financial risk, not just a PR point. While Farmer Bros. Co. has certifications like Rainforest Alliance that touch on water conservation, you need to show concrete, site-specific water intensity metrics for your roasting and distribution centers. Think about investing in closed-loop systems or advanced filtration; this is where the next wave of efficiency gains will come from, similar to how producers in Brazil are adopting smart irrigation to manage water deficits exceeding 400mm in some areas.
The company must report on Scope 1 and 2 emissions reduction targets to meet stakeholder expectations
This is one area where Farmer Bros. Co. is definitely ahead of the curve, which is a strong point to make to any skeptical investor. You set an ambitious goal to cut absolute Scope 1 and 2 emissions by 30% by 2025 from a 2018 base year, and you actually achieved a 39% reduction by 2022. That's three years early, which is defintely worth highlighting. Scope 3, which covers the supply chain, is the next frontier; you hit the 18% reduction goal early too, with a 26% decrease reported in 2022.
Here is the baseline data you are reporting against:
- Scope 1 Emissions (2022): 18,893,000 kg CO2e.
- Scope 3 Emissions (2022): 491,311,000 kg CO2e.
- Roasting facilities achieved 90% waste diversion from landfill.
- Overall company waste sent to landfill reduced by 47% since 2018.
Now, the action is to formalize the next set of targets, aligning with the 2030 and 2050 net-zero roadmaps the industry is adopting.
Finance: draft the 13-week cash flow view by Friday, specifically modeling the impact of potential green bond financing for water efficiency upgrades.
Disclaimer
All information, articles, and product details provided on this website are for general informational and educational purposes only. We do not claim any ownership over, nor do we intend to infringe upon, any trademarks, copyrights, logos, brand names, or other intellectual property mentioned or depicted on this site. Such intellectual property remains the property of its respective owners, and any references here are made solely for identification or informational purposes, without implying any affiliation, endorsement, or partnership.
We make no representations or warranties, express or implied, regarding the accuracy, completeness, or suitability of any content or products presented. Nothing on this website should be construed as legal, tax, investment, financial, medical, or other professional advice. In addition, no part of this site—including articles or product references—constitutes a solicitation, recommendation, endorsement, advertisement, or offer to buy or sell any securities, franchises, or other financial instruments, particularly in jurisdictions where such activity would be unlawful.
All content is of a general nature and may not address the specific circumstances of any individual or entity. It is not a substitute for professional advice or services. Any actions you take based on the information provided here are strictly at your own risk. You accept full responsibility for any decisions or outcomes arising from your use of this website and agree to release us from any liability in connection with your use of, or reliance upon, the content or products found herein.