
|
Flowserve Corporation (FLS) DCF Valuation |
Fully Editable: Tailor To Your Needs In Excel Or Sheets
Professional Design: Trusted, Industry-Standard Templates
Investor-Approved Valuation Models
MAC/PC Compatible, Fully Unlocked
No Expertise Is Needed; Easy To Follow
Flowserve Corporation (FLS) Bundle
Gain insight into your Flowserve Corporation (FLS) valuation analysis with our sophisticated DCF Calculator! Preloaded with accurate (FLS) data, this Excel template enables you to adjust forecasts and assumptions to determine the intrinsic value of Flowserve Corporation with accuracy.
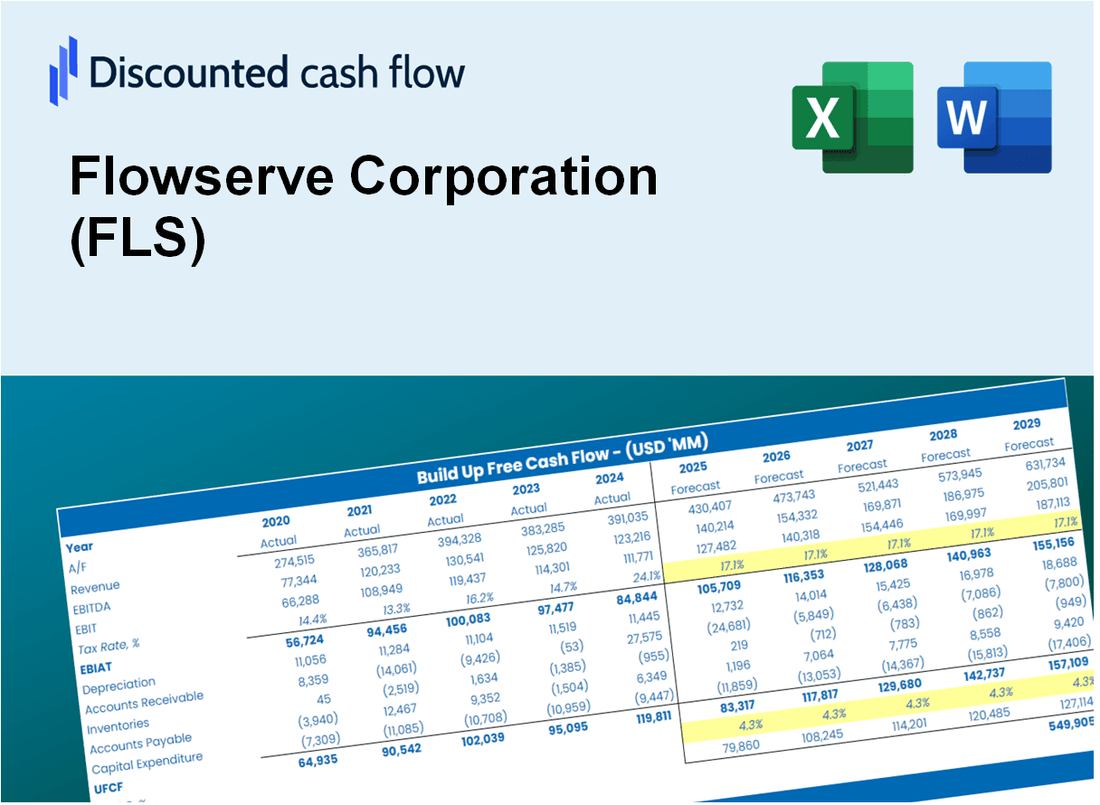
Discounted Cash Flow (DCF) - (USD MM)
| Year | AY1 2020 |
AY2 2021 |
AY3 2022 |
AY4 2023 |
AY5 2024 |
FY1 2025 |
FY2 2026 |
FY3 2027 |
FY4 2028 |
FY5 2029 |
|---|---|---|---|---|---|---|---|---|---|---|
| Revenue | 3,728.1 | 3,541.1 | 3,615.1 | 4,320.6 | 4,557.8 | 4,809.4 | 5,074.8 | 5,354.9 | 5,650.5 | 5,962.4 |
| Revenue Growth, % | 0 | -5.02 | 2.09 | 19.51 | 5.49 | 5.52 | 5.52 | 5.52 | 5.52 | 5.52 |
| EBITDA | 351.1 | 385.2 | 291.6 | 374.4 | 541.1 | 470.3 | 496.3 | 523.7 | 552.6 | 583.1 |
| EBITDA, % | 9.42 | 10.88 | 8.07 | 8.67 | 11.87 | 9.78 | 9.78 | 9.78 | 9.78 | 9.78 |
| Depreciation | 100.8 | 99.8 | 91.0 | 83.7 | 85.6 | 114.0 | 120.3 | 127.0 | 134.0 | 141.4 |
| Depreciation, % | 2.7 | 2.82 | 2.52 | 1.94 | 1.88 | 2.37 | 2.37 | 2.37 | 2.37 | 2.37 |
| EBIT | 250.3 | 285.4 | 200.6 | 290.7 | 455.5 | 356.3 | 376.0 | 396.7 | 418.6 | 441.7 |
| EBIT, % | 6.71 | 8.06 | 5.55 | 6.73 | 9.99 | 7.41 | 7.41 | 7.41 | 7.41 | 7.41 |
| Total Cash | 1,095.3 | 658.5 | 435.0 | 545.7 | 675.4 | 841.2 | 887.6 | 936.6 | 988.3 | 1,042.9 |
| Total Cash, percent | .0 | .0 | .0 | .0 | .0 | .0 | .0 | .0 | .0 | .0 |
| Account Receivables | 1,031.2 | 934.8 | 1,102.1 | 1,162.1 | 1,275.6 | 1,341.1 | 1,415.2 | 1,493.3 | 1,575.7 | 1,662.7 |
| Account Receivables, % | 27.66 | 26.4 | 30.49 | 26.9 | 27.99 | 27.89 | 27.89 | 27.89 | 27.89 | 27.89 |
| Inventories | 667.2 | 678.3 | 803.2 | 879.9 | 837.3 | 942.7 | 994.7 | 1,049.6 | 1,107.6 | 1,168.7 |
| Inventories, % | 17.9 | 19.15 | 22.22 | 20.37 | 18.37 | 19.6 | 19.6 | 19.6 | 19.6 | 19.6 |
| Accounts Payable | 440.2 | 410.1 | 476.7 | 547.8 | 545.3 | 588.9 | 621.4 | 655.6 | 691.8 | 730.0 |
| Accounts Payable, % | 11.81 | 11.58 | 13.19 | 12.68 | 11.96 | 12.24 | 12.24 | 12.24 | 12.24 | 12.24 |
| Capital Expenditure | -57.4 | -54.9 | -76.3 | -67.4 | -81.0 | -82.1 | -86.7 | -91.4 | -96.5 | -101.8 |
| Capital Expenditure, % | -1.54 | -1.55 | -2.11 | -1.56 | -1.78 | -1.71 | -1.71 | -1.71 | -1.71 | -1.71 |
| Tax Rate, % | 26.78 | 26.78 | 26.78 | 26.78 | 26.78 | 26.78 | 26.78 | 26.78 | 26.78 | 26.78 |
| EBITAT | 161.4 | 269.0 | 245.2 | 242.6 | 333.5 | 296.0 | 312.4 | 329.6 | 347.8 | 367.0 |
| Depreciation | ||||||||||
| Changes in Account Receivables | ||||||||||
| Changes in Inventories | ||||||||||
| Changes in Accounts Payable | ||||||||||
| Capital Expenditure | ||||||||||
| UFCF | -1,053.5 | 369.1 | 34.4 | 193.3 | 264.7 | 200.5 | 252.5 | 266.4 | 281.1 | 296.6 |
| WACC, % | 8.24 | 8.48 | 8.53 | 8.39 | 8.31 | 8.39 | 8.39 | 8.39 | 8.39 | 8.39 |
| PV UFCF | ||||||||||
| SUM PV UFCF | 1,011.1 | |||||||||
| Long Term Growth Rate, % | 3.50 | |||||||||
| Free cash flow (T + 1) | 307 | |||||||||
| Terminal Value | 6,279 | |||||||||
| Present Terminal Value | 4,197 | |||||||||
| Enterprise Value | 5,208 | |||||||||
| Net Debt | 1,012 | |||||||||
| Equity Value | 4,196 | |||||||||
| Diluted Shares Outstanding, MM | 132 | |||||||||
| Equity Value Per Share | 31.70 |
What You Will Get
- Editable Forecast Inputs: Easily modify key assumptions (growth %, margins, WACC) to explore various scenarios.
- Real-World Data: Flowserve Corporation’s financial data pre-filled to kickstart your analysis.
- Automatic DCF Outputs: The template computes Net Present Value (NPV) and intrinsic value automatically.
- Customizable and Professional: A sleek Excel model tailored to meet your valuation requirements.
- Built for Analysts and Investors: Perfect for evaluating projections, confirming strategies, and enhancing efficiency.
Key Features
- Comprehensive FLS Data: Pre-loaded with Flowserve Corporation's historical performance metrics and future projections.
- Customizable Parameters: Modify revenue growth rates, profit margins, discount rates, tax assumptions, and capital investments.
- Interactive Valuation Framework: Automatic recalculations of Net Present Value (NPV) and intrinsic value as you adjust inputs.
- Scenario Analysis: Develop various forecasting scenarios to evaluate different valuation possibilities.
- Intuitive Interface: Designed to be straightforward and accessible for both seasoned professionals and newcomers.
How It Works
- Download: Get the pre-built Excel file featuring Flowserve Corporation's (FLS) financial data.
- Customize: Modify projections, including revenue growth, EBITDA %, and WACC.
- Update Automatically: The intrinsic value and NPV calculations refresh in real-time.
- Test Scenarios: Generate various projections and instantly compare results.
- Make Decisions: Leverage the valuation outcomes to inform your investment strategy.
Why Choose the Flowserve (FLS) Calculator?
- Precision: Utilizes accurate Flowserve financial data for reliable results.
- Adaptability: Allows users to easily adjust and experiment with various inputs.
- Efficiency: Eliminate the need to create a DCF model from the ground up.
- Expert-Level: Crafted with the expertise and attention to detail expected at the CFO level.
- Intuitive: Simple to navigate, suitable for users with minimal financial modeling knowledge.
Who Should Use This Product?
- Professional Investors: Develop comprehensive and trustworthy valuation models for portfolio assessments of Flowserve Corporation (FLS).
- Corporate Finance Teams: Evaluate valuation scenarios to inform strategic decisions within the organization.
- Consultants and Advisors: Deliver precise valuation insights for clients interested in Flowserve Corporation (FLS).
- Students and Educators: Utilize real-world data to enhance learning and practice in financial modeling.
- Engineering and Manufacturing Professionals: Gain insights into how companies like Flowserve Corporation (FLS) are valued in the industrial sector.
What the Template Contains
- Comprehensive DCF Model: Editable template with detailed valuation calculations tailored for Flowserve Corporation (FLS).
- Real-World Data: Flowserve’s historical and projected financials preloaded for thorough analysis.
- Customizable Parameters: Adjust WACC, growth rates, and tax assumptions to explore different scenarios.
- Financial Statements: Complete annual and quarterly breakdowns for enhanced insights into Flowserve's performance.
- Key Ratios: Integrated analysis for profitability, efficiency, and leverage specific to Flowserve Corporation (FLS).
- Dashboard with Visual Outputs: Charts and tables designed to provide clear, actionable results for stakeholders.
Disclaimer
All information, articles, and product details provided on this website are for general informational and educational purposes only. We do not claim any ownership over, nor do we intend to infringe upon, any trademarks, copyrights, logos, brand names, or other intellectual property mentioned or depicted on this site. Such intellectual property remains the property of its respective owners, and any references here are made solely for identification or informational purposes, without implying any affiliation, endorsement, or partnership.
We make no representations or warranties, express or implied, regarding the accuracy, completeness, or suitability of any content or products presented. Nothing on this website should be construed as legal, tax, investment, financial, medical, or other professional advice. In addition, no part of this site—including articles or product references—constitutes a solicitation, recommendation, endorsement, advertisement, or offer to buy or sell any securities, franchises, or other financial instruments, particularly in jurisdictions where such activity would be unlawful.
All content is of a general nature and may not address the specific circumstances of any individual or entity. It is not a substitute for professional advice or services. Any actions you take based on the information provided here are strictly at your own risk. You accept full responsibility for any decisions or outcomes arising from your use of this website and agree to release us from any liability in connection with your use of, or reliance upon, the content or products found herein.