
|
FMC Corporation (FMC): ANSOFF MATRIX [Dec-2025 Updated] |
Fully Editable: Tailor To Your Needs In Excel Or Sheets
Professional Design: Trusted, Industry-Standard Templates
Investor-Approved Valuation Models
MAC/PC Compatible, Fully Unlocked
No Expertise Is Needed; Easy To Follow
FMC Corporation (FMC) Bundle
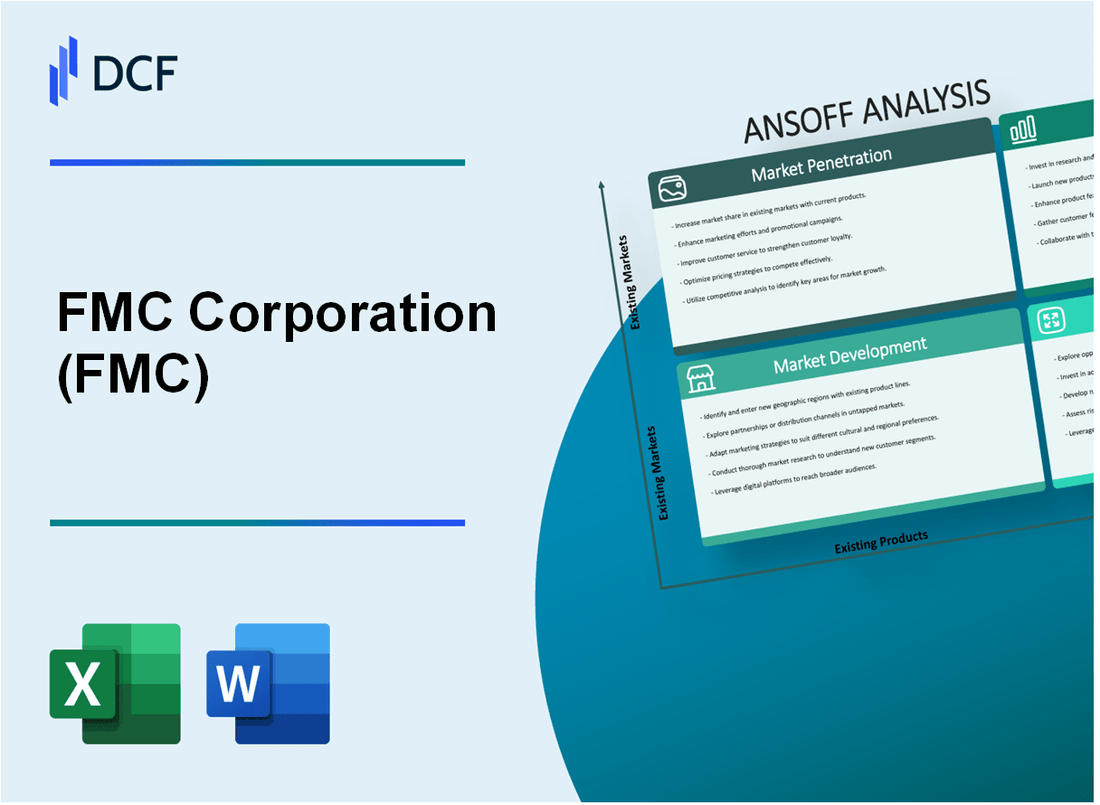
You're looking for the real playbook on how FMC Corporation plans to hit its revised 2025 revenue target, sitting right between $3.92 billion and $4.02 billion; well, after two decades analyzing these moves, I can tell you the Ansoff Matrix is the clearest way to see their game plan. Forget the jargon-this breakdown shows exactly where they are doubling down on core products like diamide insecticides for immediate gains (Market Penetration), where they are pushing existing tech into new fields (Market Development), how they are cooking up new actives from the R&D kitchen (Product Development), and the bolder bets they are making outside core crop protection (Diversification). Honestly, seeing these four vectors mapped out gives you the precise actions needed to understand their near-term risk and reward profile, so let's dive into the specifics below.
FMC Corporation (FMC) - Ansoff Matrix: Market Penetration
You're looking at how FMC Corporation is pushing harder into its established markets, which is the essence of market penetration. This isn't about finding new customers in new places; it's about selling more of what you already have to the people who already buy from you. For FMC, this means maximizing sales of their core diamide insecticides, Rynaxypyr and Cyazypyr, right where they are already strong, while also aggressively tackling regional hurdles.
In North America, the core market for these products, the push is showing traction. For the third quarter of 2025, revenue in this region grew 4 percent year-over-year, supported by higher volume from branded products like Rynaxypyr active ingredient. This growth came as diamide partners increased orders and branded sales benefited from improved channel inventory levels.
The situation in Latin America, particularly Brazil, requires a more direct approach to maintain and grow share against competitive pricing and liquidity issues. FMC is executing a new direct-to-grower sales route in Brazil, specifically targeting large corn and soybean growers that the previous model couldn't reach effectively. This is a critical move, as Latin America sales in Q3 2025 were 8 percent lower than the prior year, with low customer liquidity causing credit constraints in Brazil and Argentina specifically.
To fund more competitive pricing across the portfolio, FMC is leveraging significant internal efficiencies. The company is driving toward a targeted $250 million in run-rate cost savings by the end of 2025, stemming from restructuring actions that exceeded expectations in 2024, delivering $165 million in cost reductions that year.
A major operational focus for the second half of 2025 is driving product-on-the-ground sales to correct distributor inventory levels across Latin America and Asia. This involves a deliberate sales strategy to move product consumption faster than sales into the channel. The inventory correction has been a challenge; for instance, sales in Asia, excluding the India business sale adjustments, dropped 47 percent in Q3 2025, while Latin America was down 8 percent. The company anticipates inventory recovery in Latin America during the latter half of 2025.
FMC is also enhancing market penetration by expanding the use of existing molecules through new, differentiated formulations. This is central to their Rynaxypyr strategy: offering basic solo formulations at lower prices to compete with generics, while simultaneously providing higher-value versions through new, often patented, formulations and mixtures. The company expects sales of these new-generation products to reach between $200 million and $250 million in 2025. Furthermore, FMC is planning for three new mixtures in 2026 specifically to address resistance issues and broaden control spectrums.
Here's a look at the regional performance metrics tied to these penetration efforts in Q3 2025:
| Region | Q3 2025 Revenue Change (YoY) | Key Driver/Challenge |
| North America | 4 percent increase | Higher volume from branded products like Rynaxypyr active. |
| Latin America | 8 percent decline | Competitive pricing and low customer liquidity in Brazil and Argentina. |
| Asia (Excluding India) | 47 percent decline | Increased generic competition and inventory destocking. |
| EMEA | 11 percent increase | Volume growth, including branded Cyazypyr products. |
The strategy relies on moving product consumption, or 'product-on-the-ground,' outpacing sales into the channel. For example, in Q1 2025, product-on-the-ground volume outpaced channel sales, especially with increased direct sales to cotton growers in Brazil.
FMC Corporation (FMC) - Ansoff Matrix: Market Development
You're looking at how FMC Corporation is pushing existing products into new places, which is the definition of Market Development here. This isn't about inventing new molecules, but maximizing the reach of what's already proven. It's a disciplined way to grow when the core market is facing headwinds, like the 11 percent reported sales increase in EMEA for Q3 2025, which was 7 percent excluding foreign currency effects.
The expansion in EMEA is specifically tied to the recent launch of the Isoflex active herbicide, which received registration in Great Britain in 2024. The next big step is the European Union (EU), where registration is anticipated in 2025, with product launches expected in 2027. That EU market for cereals is estimated to be about $5 billion in addressable size. We project Isoflex sales to hit about $100 million in 2025, climbing toward $250 million by 2027. This molecule is already established in Australia, Brazil, Argentina, and India.
For the rice segment, the focus is on securing registrations for the Dodhylex active. Dossiers have been submitted in eight key rice-growing countries-India, Brazil, the Philippines, the United States, Colombia, South Korea, Peru, and Taiwan-covering approximately 35 percent of the estimated 165 million hectares of planted rice globally. FMC received conditional regulatory approval in the Philippines and expects initial sales there later in 2025, with full product launches anticipated in 2026. This novel chemistry, the first new mode of action in over three decades, is also being researched for sugarcane, wheat, soybean, and corn. Novel crop protection chemistries deployed across multiple crops and regions can potentially generate peak annual sales in the $300-500 million range. For now, Dodhylex is projected to make a small contribution to the overall new active ingredients target of $600 million by 2027.
FMC Corporation is also pushing its biological portfolio into new geographies. The QUARTZO bionematicide, which first launched in Brazil in 2018, is slated for introduction in the U.S. and Canada soon. This aligns with the broader biologicals strategy; since 2013, FMC has built a business with more than 50 biological products operating in 50 countries. Furthermore, FMC Canada became the exclusive distributor for Novonesis' biosolution products for the 2025 growing season.
The push into Brazil is significant, involving a new route to market to capture more of the large corn and soybean grower base. FMC reorganized its marketing regions to give Brazil its own dedicated focus, recognizing its size. For the 2025/26 season, Brazil expects record planted area for both soybeans and corn. Corn acreage is projected to expand by 4 percent to reach 56 million acres, with total production estimated at 5.46 billion bushels. On the soybean side, Brazil is projected to hit a record 3.9 billion bushels in exports by the end of 2025.
The Market Development strategy relies on leveraging established products across these new avenues:
- The Isoflex active herbicide is expanding into new EMEA countries following the 11 percent Q3 2025 revenue growth in the region.
- Commercialization of Dodhylex active targets registrations covering 35 percent of the global rice acreage, with initial sales in the Philippines expected in 2025.
- Existing biologicals like QUARTZO bionematicide, launched in Brazil in 2018, are targeted for introduction in the U.S. and Canada.
- FMC is targeting new, high-value specialty crops with established products, supported by a pipeline of 18 New Active Ingredients in Development.
- The new dedicated sales team in Brazil aims to reach a broader base of large corn and soybean growers, where corn acreage is projected to hit 56 million acres in 2025/26.
| Metric/Product | Region/Scope | Key Number/Amount | Context/Year |
| EMEA Sales Growth | EMEA | 11 percent | Q3 2025 Reported Growth |
| Isoflex EU Addressable Market | European Union Cereals | $5 billion | Estimated Market Size |
| Isoflex Sales Projection | Global | $100 million | Expected Sales in 2025 |
| Dodhylex Coverage | Global Rice Acreage | 35 percent | Acreage Covered by Pending Registrations |
| Dodhylex Hectares Covered | Global Rice Planted Area | 165 million hectares | Estimated Total Planted Rice Area |
| QUARTZO Launch Year | Brazil | 2018 | Commercial Launch Year |
| Biologicals Footprint | Countries with Products | 50 | As of 2022 |
| Brazil Corn Acreage Projection | Brazil 2025/26 Season | 56 million acres | Projected Planted Area |
FMC Canada is distributing Novonesis biosolutions for the 2025 growing season. The company's overall growth portfolio is expected to grow at an annual rate of about 24 percent from 2024 to 2027.
FMC Corporation (FMC) - Ansoff Matrix: Product Development
You're looking at how FMC Corporation is pushing new products through its pipeline to secure future growth, especially as some core products face pricing pressures. This is all about developing what's next to keep the revenue engine running strong.
FMC Corporation is actively working to accelerate the launch of new active ingredients. Take rimisoxafen, for example; it's a dual-mode-of-action herbicide aimed at tough, resistant broadleaf weeds in core corn and soybean markets. While it is currently under regulatory review, FMC anticipates launching a product containing rimisoxafen before the year 2030. This molecule is part of a group of four new active ingredients-dodhylex, fluindapyr, isoflex, and rimisoxafen-that the company expects will generate combined sales approaching $2 billion in revenue by 2033 at maturity.
The commercialization of new-mode-of-action fungicides is also key. Fluindapyr, a novel SDHI fungicide active ingredient, is already seeing market entry. FMC has commercialized products containing fluindapyr in markets like Argentina, Brazil, and the United States. Sales for fluindapyr alone are expected to be more than $150 million in 2025, with a projection to exceed $300 million by 2027. This is important because the broader SDHI fungicide class represented about $3 billion in combined global sales back in 2023. The U.S. corn and soybean markets targeted by fluindapyr represent roughly 95 million and 80 million planted acres, respectively.
Here's a quick look at the expected revenue trajectory for the key pipeline molecules:
| Metric | Value/Projection |
| Expected Peak Revenue for 4 New Actives (Combined) | Substantially larger than total diamides portfolio today |
| Expected Revenue by 2033 (4 New Actives) | Approximately $2 billion |
| Fluindapyr Sales Projection for 2025 | More than $150 million |
| Fluindapyr Sales Projection by 2027 | Exceeding $300 million |
| SDHI Fungicide Global Market Sales (2023) | Around $3 billion |
FMC is also focused on expanding the Plant Health portfolio with new biological solutions for current customers. The company has begun launching products from its proprietary Sofero™ pheromones solutions platform. The overall Plant Health business showed growth, increasing 3 percent in the second quarter of 2025, driven by biologicals. This platform is targeted for significant expansion, expected to grow at an annual rate in the mid-20% range out to 2027. Furthermore, their spore-based microbial products offer a longer shelf life of at least 2 years, which helps with grower convenience.
Integrating new digital tools directly supports the sales of these crop protection products. The Arc™ farm intelligence platform, which helps growers proactively manage pests, was recognized with a 2025 CIO 100 Award. Since its launch in 2020, this platform has expanded from two countries to over 30. It uses predictive modeling to offer reliable insights about pest pressure with up to 90% accuracy. Currently, the platform monitors over 55 insect types using nearly 65 pest predictive models.
Developing new diamide formulations is a strategy to extend the patent life and value of the existing Insecticides segment, which the prompt anchors at $2.28 billion. While the company is working to maximize the value of core products through new formulations, revenue has seen headwinds from contract adjustments. For instance, in the first quarter of 2025, a price decline of 9 percent was noted, with over half attributed to price adjustments in certain 'cost-plus' contracts with specific diamide partners due to lower manufacturing costs. Similarly, in the second quarter of 2025, the 3 percent price decline was over half attributed to these same diamide partner contract adjustments.
The Product Development focus is clearly on leveraging innovation across the portfolio:
- Accelerate the launch of new active ingredients like rimisoxafen, a dual-mode-of-action herbicide for core corn and soybean markets, with expected peak sales from the four new actives being substantially larger than the current diamides portfolio.
- Commercialize new-mode-of-action fungicides like fluindapyr, which is projected to generate over $150 million in sales in 2025.
- Expand the Plant Health portfolio, which grew 3 percent in Q2 2025, targeting a mid-20% annual growth rate through 2027.
- Integrate new digital tools, like Arc farm intelligence, which has expanded to over 30 countries and offers pest pressure insights with up to 90% accuracy.
- Develop new diamide formulations to extend the patent life and value of the existing $2.28 billion Insecticides segment, while managing price adjustments related to these contracts.
Finance: draft 2026 capital allocation plan prioritizing R&D spend by end of Q4.
FMC Corporation (FMC) - Ansoff Matrix: Diversification
You're looking at how FMC Corporation (FMC) plans to move beyond its core crop protection business, which is the definition of diversification in the Ansoff Matrix. This isn't just about new molecules; it's about new markets and new business models entirely. The company is actively managing its portfolio, evidenced by the strategic review and potential sale of its non-crop product line, the Global Specialty Solutions (GSS) business, which helps sharpen the focus on core Ag Sciences growth platforms.
The venture capital arm, FMC Ventures, is the primary vehicle for exploring these adjacent, high-tech areas. This unit targets early-stage companies developing technologies that create a unique competitive advantage for FMC. The focus areas are clear, looking at how to marry synthetic chemistries with digital advancements.
- Invest in early-stage AgTech companies through FMC Ventures, focusing on areas like agrifintech and synthetic biology.
- Develop and launch non-crop products for professional pest and turf management, leveraging the remaining non-GSS portfolio.
- Acquire or partner with companies in the crop nutrition space to accelerate the Plant Health segment toward its $2 billion revenue aspiration by 2033.
- Explore new applications for core chemical expertise outside of traditional crop protection, such as specialty ingredients, a segment that saw 6 percent sales growth in Q1 2025.
- Pilot new business models, like subscription services for precision agriculture tools, in emerging agricultural markets.
The Plant Health segment is a major diversification play within the core agricultural focus. Management has a clear, long-term aspiration for this area. They plan to grow the biologicals platform to approximately $2 billion in revenue by 2033. This ambition requires external acceleration, meaning acquisitions or partnerships in the crop nutrition space are a necessary part of the strategy to hit that 2033 goal.
When looking at the specialty ingredients space, which falls under the broader Nutritional Products segment, the recent performance shows traction. For the first quarter of 2025, the Nutritional Products segment saw sales grow by 6 percent, even with flat volumes, suggesting pricing power or a shift in product mix toward higher-value offerings. This contrasts with the overall Q1 2025 revenue of $791 million, which was down 14 percent year-over-year, showing the importance of these growth segments.
Here's a quick look at the financial context surrounding the 2025 outlook, which frames the urgency for diversification:
| Metric | Full Year 2025 Guidance (Midpoint) | Change vs. Prior Year (Midpoint) |
|---|---|---|
| Revenue (Excluding GSS) | Approximately $4.25 billion (based on $4.15B-$4.35B range) | 3 percent growth |
| Adjusted EBITDA (Excluding GSS) | $910 million (based on $870M-$950M range) | 4 percent growth |
| Free Cash Flow Forecast | $300 million (based on $200M-$400M range) | Reflecting a 51 percent decline from prior year |
The plan to pilot new business models, such as subscription services for precision agriculture tools, is aimed at emerging markets. This is about capturing value from data and service, not just the physical product. For instance, the company is capitalizing on its expanded product portfolio to sell directly to large corn and soybean growers in Brazil, unlocking a multi-hundred-million-dollar growth opportunity by establishing a new direct-to-grower route in Q2 2025.
The focus on FMC Ventures aligns with exploring technologies that help a farmer be more profitable, sustainable, productive, and efficient. This includes looking at robotics, automation, and drones, which are all complementary to precision agriculture tools. The strategic value derived from these investments is learning, access to new knowledge, and influence with select start-ups, even if the intent is not immediate acquisition. The Q1 2025 Adjusted EPS was $0.18, so driving new, high-margin revenue streams through these diversification efforts is defintely critical for future earnings quality.
Disclaimer
All information, articles, and product details provided on this website are for general informational and educational purposes only. We do not claim any ownership over, nor do we intend to infringe upon, any trademarks, copyrights, logos, brand names, or other intellectual property mentioned or depicted on this site. Such intellectual property remains the property of its respective owners, and any references here are made solely for identification or informational purposes, without implying any affiliation, endorsement, or partnership.
We make no representations or warranties, express or implied, regarding the accuracy, completeness, or suitability of any content or products presented. Nothing on this website should be construed as legal, tax, investment, financial, medical, or other professional advice. In addition, no part of this site—including articles or product references—constitutes a solicitation, recommendation, endorsement, advertisement, or offer to buy or sell any securities, franchises, or other financial instruments, particularly in jurisdictions where such activity would be unlawful.
All content is of a general nature and may not address the specific circumstances of any individual or entity. It is not a substitute for professional advice or services. Any actions you take based on the information provided here are strictly at your own risk. You accept full responsibility for any decisions or outcomes arising from your use of this website and agree to release us from any liability in connection with your use of, or reliance upon, the content or products found herein.