
|
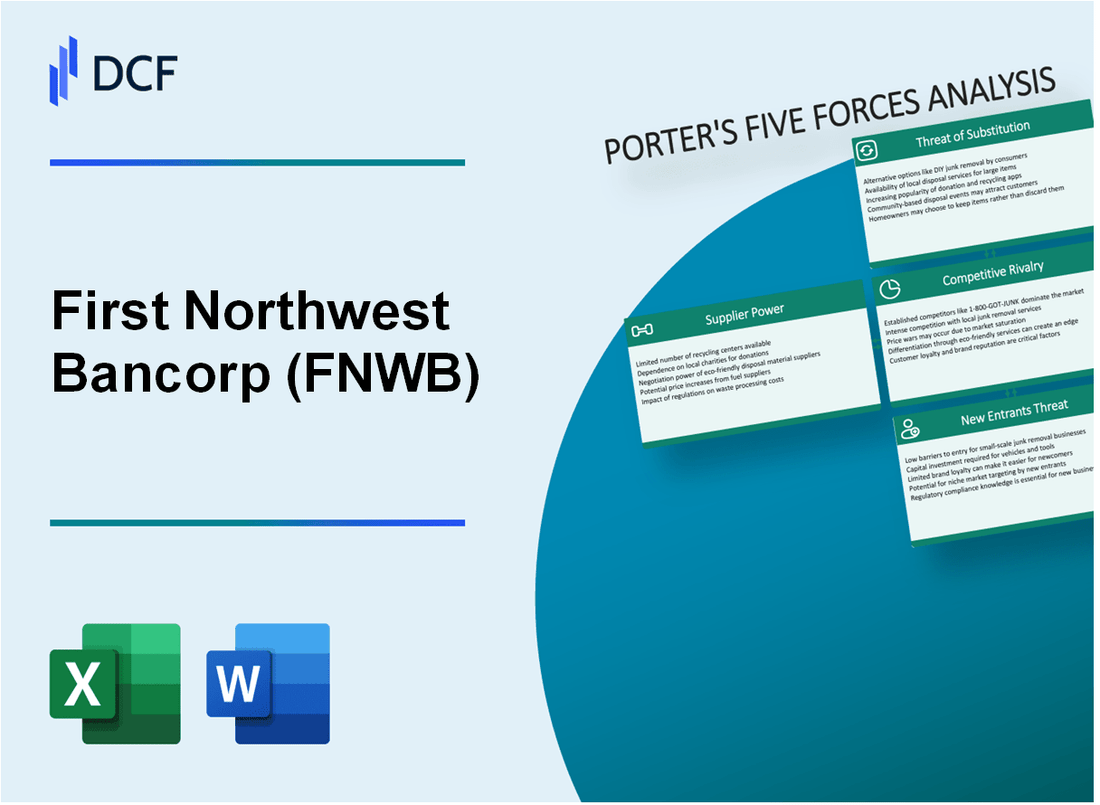
First Northwest Bancorp (FNWB): 5 FORCES Analysis [Nov-2025 Updated] |
Fully Editable: Tailor To Your Needs In Excel Or Sheets
Professional Design: Trusted, Industry-Standard Templates
Investor-Approved Valuation Models
MAC/PC Compatible, Fully Unlocked
No Expertise Is Needed; Easy To Follow
First Northwest Bancorp (FNWB) Bundle
You're trying to size up First Northwest Bancorp's position in the tough Pacific Northwest banking scene as of late 2025, and frankly, the competitive landscape is intense. Our look through Porter's Five Forces shows the bank is squeezed: customers can easily jump ship, rivalry is high against national players, and FinTech substitutes are chipping away at lending and payments, even while their own depositors gain leverage from higher interest rates on their $\text{ \$1.55 billion}$ deposit base. We need to see if that community focus can hold up against the pressure facing a firm with just a $\text{ \$75.24 million}$ market cap; check out the full breakdown below to see where the real risks lie.
First Northwest Bancorp (FNWB) - Porter's Five Forces: Bargaining power of suppliers
When we look at First Northwest Bancorp (FNWB), the power held by its suppliers-primarily depositors and capital providers-is a key dynamic to watch. For a bank, the core suppliers are those providing the raw material: money. You're looking at how much leverage those funding sources have over FNWB's cost structure and strategic flexibility.
Depositor power is definitely moderate right now. The bank has managed to build a stable base of customer deposits, hitting $1.55 billion as of the second quarter of 2025. That's a solid foundation, which generally keeps individual depositor power in check because the overall funding pool is large and sticky. Still, you can't ignore the environment.
High interest rates, even if they are starting to ease, increase the cost of funds, which gives depositors more leverage to demand better rates on their money market accounts and Certificates of Deposit (CDs). Here's the quick math: In the first quarter of 2025, the total cost of funds was 2.67%, down from 2.80% in the prior quarter, but that movement shows how sensitive FNWB is to the market's pricing power. If rates spike again, depositors will definitely shop around for better yields.
We can map out the funding mix to see where the pressure points are:
| Funding Source | Latest Reported Amount/Metric | Period/Date | Implication for Power |
|---|---|---|---|
| Core Customer Deposits | $1.55 billion | Q2 2025 | Moderate/Stable Base |
| Total Cost of Funds | 2.67% | Q1 2025 | Indicates sensitivity to market rates |
| Brokered Deposits (Reduction) | $31.0 million decrease | Q2 2025 | Active management reducing reliance on price-sensitive wholesale |
| Interest Expense on Brokered CDs | Decreased | Q1 2025 | Limited wholesale funding power in that specific segment |
Wholesale funding power, on the other hand, appears limited, which is a positive for FNWB's control over its cost of funds. You saw this play out as interest expense on brokered Certificates of Deposit (CDs) decreased in the first quarter of 2025. Furthermore, management actively reduced reliance on this source, with brokered time deposits seeing a $31.0 million reduction in the second quarter of 2025. This suggests FNWB is successfully shifting toward more stable, lower-cost core deposits, thereby limiting the leverage of the wholesale market.
Equity capital suppliers-the shareholders-are showing caution, and you see that reflected in the bank's recent actions regarding shareholder returns. Honestly, preserving capital is the priority when the outlook is uncertain. This caution is evidenced by the Board of Directors electing not to declare a dividend for the quarter following their Q2 2025 results, as part of a prudent approach to capital management. While a small dividend of $0.07 per share was paid for Q1 2025 results, the decision in July 2025 to hold back signals that equity suppliers' immediate return expectations are being tempered by management's need to maintain a strong balance sheet.
The key takeaways regarding supplier power are:
- Depositor power is moderate; the bank has a stable base of $1.55 billion in customer deposits.
- High interest rates increase the cost of funds, giving depositors more leverage to demand better rates.
- Wholesale funding power is limited; interest expense on brokered CDs decreased in Q1 2025.
- Equity capital suppliers are cautious, evidenced by the decision not to declare a dividend in the quarter after Q2 2025 results to preserve capital.
If onboarding takes 14+ days, churn risk rises, but for FNWB, managing deposit rates is the immediate action item here.
First Northwest Bancorp (FNWB) - Porter's Five Forces: Bargaining power of customers
You're looking at First Northwest Bancorp (FNWB) in the context of customer power, and the reality is that for a community bank of its size, the leverage held by customers is significant, especially in the digital age. The ease of moving money today directly pressures your pricing and service model.
Customer switching costs are low; moving checking accounts or mortgages is relatively easy now. While the average tenure for a checking account at an institution with physical branch locations remains high at 19 years (based on early 2025 survey data), this masks the underlying friction. For customers of online-only institutions, that average tenure drops to just 6 years. This disparity shows that digital convenience is a major factor in customer stickiness, or lack thereof. Furthermore, when asked why they stay put, 9% of checking account holders still cite 'too much of a hassle to switch'. That small percentage represents a significant pool of customers who could be swayed by a better offer, especially given that nearly half of new checking accounts opened in late 2025 were with a different firm.
Digital banking alternatives give retail and small business customers many options beyond the 12 full-service branches First Northwest Bancorp operates, which are part of 16 total locations in Washington state. The industry trend is decidedly digital-first; retail customers now prioritize easy-to-use online banking as a critical loyalty driver. For a bank with a market capitalization of $83.1M as of October 30, 2025, keeping pace with the digital offerings of larger competitors, who invest billions in technology, is a constant challenge.
Large commercial borrowers can dictate terms due to the bank's small size and need for loan growth. First Northwest Bancorp, with a trailing twelve-month revenue of $66M as of September 30, 2025, is a smaller regional player. While core commercial customer growth was reported as positive in Q1 2025, the bank saw loans grow at an annualized rate of 3% in Q2 2025 compared to the prior quarter, suggesting an ongoing need to secure and grow loan volume to drive earnings. This dynamic means that a large, creditworthy commercial client has more leverage to negotiate favorable terms than they would with a much larger, more diversified institution.
The bank's community focus helps retain customers who value personalized, local service. This relationship-based approach is a key countermeasure to digital churn. The CEO, Curt Queyrouze, emphasized a commitment to honoring the bank's legacy and remaining a trusted partner in the communities served [cite: 4 in previous turn]. This focus appears to be working on the deposit side, as total customer deposits grew to $1.55 billion by June 30, 2025 [cite: 5 in previous turn]. For customers who value that local connection, this personalized service acts as a powerful, non-financial switching cost.
Here are the key data points illustrating the customer power dynamics:
| Metric | Value/Data Point | Date/Context |
|---|---|---|
| Average Checking Account Tenure (Brick & Mortar) | 19 years | Early 2025 Survey Data |
| Average Checking Account Tenure (Online-Only) | 6 years | Early 2025 Survey Data |
| Customers Citing 'Hassle to Switch' | 9% | Early 2025 Survey Data |
| FNWB Full-Service Branches | 12 | As of late 2025 |
| FNWB Market Capitalization | $83.1M | October 30, 2025 [cite: 8 in previous turn] |
| Total Customer Deposits | $1.55 billion | June 30, 2025 [cite: 5 in previous turn] |
The competitive environment means that even for community-focused clients, the expectation for a seamless digital experience is now table stakes. You need to ensure your digital platforms are not the reason a customer decides to research alternatives.
First Northwest Bancorp (FNWB) - Porter's Five Forces: Competitive rivalry
You're looking at the competitive rivalry force for First Northwest Bancorp, and honestly, it's a tough spot. The Puget Sound market is packed. We're talking about saturation with large national players and established regional banks all vying for the same deposit and loan dollars.
This environment puts a lot of pressure on a smaller institution like First Northwest Bancorp. As of July 2025, the bank held a modest market cap of $75.24 million. Even looking at later data from late October 2025, the market cap was around $83.1M, or closer to $87.69 million by mid-November 2025, showing it remains firmly in the small-cap category relative to the giants in the region.
Here are the key points defining the rivalry pressure:
- Rivalry is high in the Puget Sound market, saturated with large national and regional banks.
- FNWB is a small player with a modest market cap of $75.24 million as of July 2025.
- The bank's Q2 2025 net income of $3.7 million shows a positive trend but is volatile.
- High nonperforming loans at $20.4 million create internal pressure to compete aggressively on loan pricing.
That high level of nonperforming loans, sitting at $20.4 million at the end of Q2 2025, forces the management team to focus intensely on loan growth and pricing to improve asset quality metrics. You see this internal stress reflected in the need to generate positive earnings, like the $3.7 million net income reported for Q2 2025, which reversed a $9.0 million loss from Q1 2025.
To understand the volatility and the competitive environment First Northwest Bancorp is fighting in, look at how key performance indicators shifted between the first and second quarters of 2025:
| Metric | Q1 2025 Result | Q2 2025 Result | Change Driver |
| Net Income (Millions USD) | -$9.0 million loss | $3.7 million profit | Profitability turnaround |
| Earnings Per Share (USD) | -$1.03 loss | $0.42 | Positive earnings per share |
| Net Interest Margin | 2.76% | 2.83% | Seven basis points expansion |
| Customer Deposits (Billions USD) | Implied lower than $1.55B | $1.55 billion | Deposit growth of $19.6 million |
| Allowance for Credit Losses (Millions USD) | Implied higher than $18.4M | $18.4 million | Reduction during the quarter |
The pressure to compete aggressively on loan pricing is compounded by the fact that the bank is managing significant credit risk. You have $20.4 million in nonperforming loans, while classified loans totaled $30.9 million. To put that in perspective against the bank's size, the net loan charge-offs for Q2 2025 were $1.9 million.
This internal need to aggressively price loans to win business and move assets off the books directly fuels the external competitive rivalry. When you are a smaller entity like First Northwest Bancorp, you can't always match the scale or funding costs of the larger competitors operating in the same King and Snohomish counties.
The competitive landscape demands sharp focus on relationship banking, which is First Northwest Bancorp's stated model. The bank's ability to maintain or expand its customer base, which saw deposits grow to $1.55 billion by June 30, 2025, is a direct measure of how effectively it navigates this high-rivalry environment without sacrificing pricing discipline too much.
Here's what that competitive pressure looks like in terms of operational efficiency:
- Efficiency ratio improved to 78.0% in Q2 2025 from 113.5% in Q1 2025.
- Adjusted Pre-Tax, Pre-Provision Net Revenue (PPNR) reached $2.1 million in Q2 2025.
- The bank is actively searching for a new full-time CEO while managing legal proceedings.
Finance: draft 13-week cash view by Friday.
First Northwest Bancorp (FNWB) - Porter's Five Forces: Threat of substitutes
You're looking at the competitive landscape for First Northwest Bancorp (FNWB) and the substitutes are definitely making their presence felt. These alternatives chip away at the traditional revenue streams for commercial and consumer banking, which is where First Fed Bank, the subsidiary, makes its money. Honestly, the speed and convenience offered by non-bank players are setting a new baseline for customer expectations.
FinTech lenders offer faster, fully digital loan origination, substituting traditional bank lending. The U.S. digital lending market reached a size of $303.07 billion in 2025. Digital lending now accounts for about 63% of personal loan origination in the U.S. in 2025. Furthermore, an estimated 55% of small businesses in developed regions like the U.S. accessed loans via fintech platforms in 2025. Consumer lending specifically held 62.87% of the United States digital lending market share in 2024.
Digital payment platforms (e.g., PayPal, Venmo) substitute for traditional bank transaction services. The total transaction value of digital payments in the U.S. is projected to hit $3.15 trillion by 2025. This massive volume is supported by the fact that nearly every American-about 91%-has a smartphone. First Northwest Bancorp is aware, focusing on strategic partnerships for digital payments.
Direct online lenders for mortgages and consumer loans provide competitive rates and convenience. For the niche segment of Online Mortgage Brokers in the U.S., the market size is estimated at $647.5 million in 2025, though this specific industry segment has seen revenue decline at a compound annual growth rate of 6.6% over the five years leading up to 2025. First Northwest Bancorp's principal lending activities include first lien one- to four-family mortgage loans, directly competing in this space.
Wealth management firms and investment funds substitute for traditional savings and investment products. The broader United States fintech market, which encompasses wealth management, reached $53.0 Billion in 2024 and is projected to grow at a CAGR of 13.9% through 2033. Surveys in 2025 indicated that over 90% of U.S. millennials have interacted with at least one fintech platform, often for investing.
Here's a quick look at the scale of these substitute markets compared to First Northwest Bancorp's recent reported figures:
| Market/Entity | Metric | Value (as of late 2025 data) |
| U.S. Digital Lending Market | Market Size (2025) | $303.07 billion |
| U.S. Digital Payments Volume | Projected Value (2025) | $3.15 trillion |
| U.S. Online Mortgage Brokers Industry | Market Size (2025) | $647.5 million |
| U.S. Fintech Market (incl. Wealth Mgmt) | Market Size (2024) | $53.0 Billion |
| First Northwest Bancorp (FNWB) | Q1 2025 Net Income | $1.5 million |
| First Northwest Bancorp (FNWB) | Market Cap (Oct 30, 2025) | $83.1M |
The pressure points from these substitutes are clear, especially in lending and payments:
- Digital lending accounts for 63% of U.S. personal loan origination.
- 91% of Americans own a smartphone, enabling mobile payment substitutes.
- Fintech platforms serve 55% of U.S. small businesses for loans in 2025.
- 90% of U.S. millennials use a fintech platform for investing/payments.
- FNWB's stock price as of October 30, 2025, was $9.34.
First Northwest Bancorp (FNWB) - Porter's Five Forces: Threat of new entrants
Regulatory and capital requirements create a high barrier for new traditional bank charters. For large banks, the minimum Common Equity Tier 1 capital requirement stands at 4.5 percent, with a Stress Capital Buffer requirement of at least 2.5 percent. First Northwest Bancorp, with a market capitalization around $83.1M as of 30-Oct-2025, is significantly smaller than the $30 billion in assets threshold the OCC uses to define community banks.
FinTechs are the main threat, using technology to bypass traditional branch infrastructure costs. The U.S. fintech market size is likely to be valued at US$95.2 Bn in 2025, projected to reach US$248.5 Bn by 2032. Banks, as end-users, are expected to account for more than 40% share of this market in 2025. The Neobanking segment, a direct digital competitor, is anticipated to experience the fastest growth, with a Compound Annual Growth Rate (CAGR) of 21.67% from 2025 to 2030.
The OCC easing some BSA rules for community banks (under $30 billion in assets) slightly lowers the regulatory hurdle for small entrants. The agency discontinued its annual Money Laundering Risk System data collection for these smaller firms, with the new tailored Bank Secrecy Act/Anti-Money Laundering examination procedures becoming effective for examinations beginning Feb. 1, 2026.
Established brand loyalty in the local community provides a defense against purely digital newcomers. First Fed Bank, the subsidiary of First Northwest Bancorp, has served its customers and communities since 1923. This established presence is physically represented by 16 locations in Washington state, including 12 full-service branches.
Here's a quick look at the scale of the digital competition versus First Northwest Bancorp's current standing:
| Metric | Value | Context/Date |
| U.S. Fintech Market Size | US$95.2 Bn | 2025 Estimate |
| Neobanking CAGR | 21.67% | 2025 to 2030 |
| FNWB Market Cap | $83.1M | As of 30-Oct-2025 |
| FNWB TTM Revenue | $66M | As of 30-Sep-2025 |
| FNWB Branch Count | 12 | Full-service branches in Washington state |
| OCC Community Bank Asset Cap | $30 Billion | Definition for eased BSA rules |
The threat is further detailed by the technology adoption rates:
- Fintech adoption in the U.S. hit approximately 74% in Q1 2025 for using one or more fintech services.
- API technology holds more than 32% market share in the U.S. fintech sector in 2025.
- The Payment service type holds over 35% share of the U.S. fintech market in 2025.
Disclaimer
All information, articles, and product details provided on this website are for general informational and educational purposes only. We do not claim any ownership over, nor do we intend to infringe upon, any trademarks, copyrights, logos, brand names, or other intellectual property mentioned or depicted on this site. Such intellectual property remains the property of its respective owners, and any references here are made solely for identification or informational purposes, without implying any affiliation, endorsement, or partnership.
We make no representations or warranties, express or implied, regarding the accuracy, completeness, or suitability of any content or products presented. Nothing on this website should be construed as legal, tax, investment, financial, medical, or other professional advice. In addition, no part of this site—including articles or product references—constitutes a solicitation, recommendation, endorsement, advertisement, or offer to buy or sell any securities, franchises, or other financial instruments, particularly in jurisdictions where such activity would be unlawful.
All content is of a general nature and may not address the specific circumstances of any individual or entity. It is not a substitute for professional advice or services. Any actions you take based on the information provided here are strictly at your own risk. You accept full responsibility for any decisions or outcomes arising from your use of this website and agree to release us from any liability in connection with your use of, or reliance upon, the content or products found herein.