
|
Friedman Industries, Incorporated (FRD): ANSOFF MATRIX [Dec-2025 Updated] |
Fully Editable: Tailor To Your Needs In Excel Or Sheets
Professional Design: Trusted, Industry-Standard Templates
Investor-Approved Valuation Models
MAC/PC Compatible, Fully Unlocked
No Expertise Is Needed; Easy To Follow
Friedman Industries, Incorporated (FRD) Bundle
You're looking past the noise to find Friedman Industries, Incorporated (FRD)'s clearest path forward, and honestly, the numbers from Q2 2025 give us a roadmap. We see a company that grew Flat-Roll sales by 28% year-over-year but needs to urgently shore up its Tubular segment, which only hit $9.0 million in sales. With $128.2 million in working capital available, the question isn't if you can grow, but how you deploy that capital across the four Ansoff quadrants-from doubling down on existing markets to making calculated leaps into new product lines or even raw material supply chains outside the current $510.45 million TTM revenue base. Below, I've mapped out exactly what actionable steps Friedman Industries, Incorporated (FRD) can take right now, blending low-risk volume discounts with high-potential diversification plays.
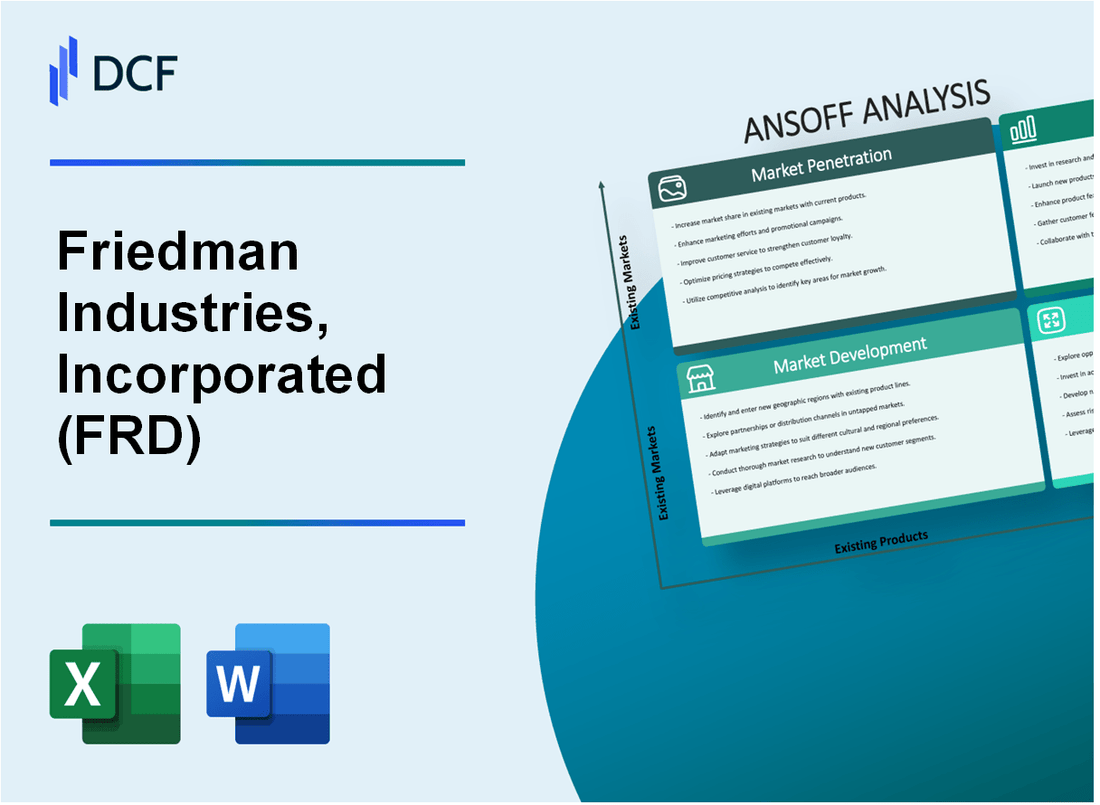
Friedman Industries, Incorporated (FRD) - Ansoff Matrix: Market Penetration
Market Penetration focuses on selling more of your existing products into your existing markets. For Friedman Industries, Incorporated (FRD), this means driving volume and market share within the current Flat-Roll and Tubular segments using current operational assets.
The primary lever here is volume growth, building upon the 28% year-over-year increase in total sales volume achieved in the quarter ended September 30, 2025, which included 154,500 tons of inventory sold plus 24,500 tons of toll processing. The Flat-Roll segment, which posted sales of approximately $143.3 million in Q2 2025, is the engine, having shipped approximately 147,000 inventory tons and 24,500 toll processing tons in that period. To push beyond that 28% growth rate, you need to incentivize current customers or aggressively win share from rivals through pricing strategy.
Targeting competitors' customers in the Southwestern US requires leveraging the established footprint. Friedman Industries, Incorporated (FRD) operates coil processing facilities in Sinton, TX, and has the Tubular Division in Lone Star, TX. The recent acquisition of Century Metals & Supplies on August 29, 2025, further solidifies a presence in the South/Southeast with facilities in Miami, FL, and Orlando, FL, which can support broader regional penetration. Emphasizing the achieved average selling price of $963 per ton for Flat-Roll segment inventory in Q2 2025, coupled with service quality metrics like temper pass and stretcher leveling capabilities, can be a direct competitive comparison point against rivals in that region.
Expanding toll processing services is a direct utilization of existing assets. The Flat Roll Division operates seven coil processing facilities across states like Indiana, Illinois, Arkansas, Alabama, and Texas. These facilities offer services like Temper passing, stretcher levelling, slitting, and cut-to-length. For customer-owned coils, the goal is to increase the 24,500 toll processing tons seen in Q2 2025 by marketing the specific equipment available, such as the Temper Pass mills at East Chicago, Granite City, and Hickman, or the state-of-the-art Stretcher Leveler lines at Decatur and Sinton.
The Tubular segment needs stabilization. Sales for this segment were only approximately $9.0 million in Q2 2025, with tons sold dropping to approximately 7,500 tons from 9,000 tons year-over-year. A loyalty program directly targets these existing customers to lock in volume, aiming to reverse the volume decline and build upon the Q2 2025 operating earnings of approximately $0.9 million achieved through a higher average selling price of $1,185 per ton.
Optimizing inventory management directly impacts the ability to secure quick-turn orders, which is a key differentiator in the metals market. While specific lead time reduction targets aren't public, the action is to streamline internal processes to ensure that the time between order placement and product availability is minimized, making Friedman Industries, Incorporated (FRD) the defintely preferred supplier over competitors who may have longer fulfillment cycles. This optimization supports the overall financial health, which saw total assets of $311.3 million and total liabilities of $172.0 million as of September 30, 2025.
| Metric | Q2 2025 Actual/Target | Comparison/Context |
|---|---|---|
| Overall Sales Volume Growth (YoY) | 28% | Target is to exceed this for Market Penetration success. |
| Flat-Roll ASP (Inventory) | $963 per ton | Used as a value proposition against competitors. |
| Flat-Roll Toll Processing Tons | 24,500 tons | Capacity to expand by targeting more customer-owned coils. |
| Tubular Segment Sales | $9.0 million | Baseline for stabilization via a new loyalty program. |
| Tubular Tons Sold | 7,500 tons | Volume declined from 9,000 tons YoY; target for recovery. |
| Flat-Roll Segment Sales | $143.3 million | Primary revenue driver to be increased via volume discounts. |
The Market Penetration strategy hinges on these quantifiable actions:
- Push Flat-Roll volume past the 28% YoY mark.
- Use the $963 per ton ASP as a service quality benchmark.
- Stabilize Tubular sales from the $9.0 million Q2 2025 level.
- Increase toll processing volume beyond 24,500 tons.
- Reduce lead times to win quick-turn orders.
Friedman Industries, Incorporated (FRD) - Ansoff Matrix: Market Development
The Market Development quadrant for Friedman Industries, Incorporated centers on taking existing products into new geographic territories or customer segments.
The acquisition of Century Metals & Supplies, Incorporated on August 29, 2025, serves as the immediate vehicle for geographic expansion. Century Metals, based in Miami, Florida, with facilities in Orlando and Tampa, brings average annual revenues of $111.0 million over the past three fiscal years into the Friedman Industries portfolio. This transaction is expected to be immediately accretive. The move expands Friedman Industries, Incorporated's presence into the Southeastern United States and Latin American markets. The existing Tubular Products segment, which manufactures electric resistance welded pipe, is now positioned to use these new geographic footholds.
The current revenue base against which this development is measured is the Trailing Twelve Months (TTM) revenue, reported at $510.45 million as of the quarter ended September 30, 2025. The total asset base supporting this operation stood at $311.3 million as of September 30, 2025.
The existing product segments provide the basis for new market penetration:
- The Flat-Roll segment recorded sales of $143.3 million for the quarter ended September 30, 2025.
- The Tubular Product segment recorded sales of $9.0 million for the quarter ended September 30, 2025.
- The Tubular segment shipped approximately 7,500 tons at an average selling price of approximately $1,185 per ton for the quarter ended September 30, 2025.
The expansion strategy involves several distinct geographic and product thrusts:
- Utilize the Century Metals & Supplies acquisition to immediately enter new US geographic markets outside the current Midwest/Southeast/Southwest focus.
- Establish a dedicated sales team to market existing ERW pipe products to Canadian or Mexican structural steel markets.
- Pursue large-scale government infrastructure contracts in the Northeast US, a new region for Friedman Industries, Incorporated's existing Flat-Roll products.
- Partner with international pipe distributors to export specialized oil country tubular goods (OCTG) to South American energy projects.
- Open a new distribution center in a high-growth US industrial corridor to capture a larger share of the $510.45 million TTM revenue.
The scale of the existing operation, prior to full integration of the acquisition, can be benchmarked:
| Metric | Value (TTM/Latest Reported) |
| TTM Revenue | $510.45 million |
| Total Employees | 271 |
| Revenue Per Employee (TTM) | $1,883,579 |
| Flat-Roll Segment Sales (Q2 FY2026) | $143.3 million |
| Tubular Segment Sales (Q2 FY2026) | $9.0 million |
The acquisition itself adds approximately $111.0 million in average annual revenue, which is intended to support enhanced margins and growth as integration progresses. The company anticipates that third quarter fiscal 2026 sales volume will remain consistent with second quarter levels, as the additional volume from the Century Metals & Supplies acquisition is expected to offset the anticipated holiday-related slowdown during the quarter.
Friedman Industries, Incorporated (FRD) - Ansoff Matrix: Product Development
You're looking at how Friedman Industries, Incorporated can push new offerings into its current US customer base. This is about making the existing customer relationships more profitable, so let's look at the numbers supporting these moves.
Introduce higher-margin, pre-painted or galvanized flat-roll steel products for the existing US construction customer base. The flat-roll product segment already generated sales of approximately $143.3 million for the quarter ended September 30, 2025. This segment's sales volume, including inventory and toll processing, reached approximately 171,500 tons in that same quarter.
Develop a new line of high-strength, lightweight steel plate for existing customers in the US automotive or heavy machinery manufacturing sectors. The total sales volume for the flat-roll segment for the quarter ended September 30, 2025, was a mix of inventory sales at 147,000 tons and toll processing at 24,500 tons. The tubular segment, which services some industrial/machinery sectors, moved approximately 7,500 tons in Q2 FY2026.
Offer advanced finishing services like laser cutting or specialized welding to complement existing cut-to-length capabilities. Friedman Industries, Incorporated handled approximately 24,500 tons of toll processing for the flat-roll segment in the quarter ending September 30, 2025. The average per ton selling price for the tubular segment inventory was approximately $1,185 per ton for the same period.
Invest a portion of the $128.1 million working capital into R&D for proprietary corrosion-resistant coatings for tubular products. Friedman Industries, Incorporated reported a working capital balance at the fiscal year-end of March 31, 2025, of approximately $128.1 million. The net earnings for the quarter ending September 30, 2025, were $2.2 million.
Create a digital platform for customers to manage their toll processing orders and inventory in real time. Total sales for Friedman Industries, Incorporated for the quarter ended September 30, 2025, were $152.4 million. The company reported retained earnings of $152.38 million as of September 30, 2025.
Here are some key financial figures from the recent reporting periods for Friedman Industries, Incorporated:
| Metric | Q2 FY2026 (Ended 9/30/2025) | FY2025 (Ended 3/31/2025) |
|---|---|---|
| Net Earnings | $2.2 million | $6.1 million |
| Total Sales | $152.4 million | $444.6 million |
| Flat-Roll Sales | $143.3 million | Not Separately Listed |
| Tubular Sales | $9.0 million | Not Separately Listed |
| Working Capital Balance | Not Reported | $128.1 million |
To focus on service expansion, consider the breakdown of the Q2 FY2026 sales volume:
- Flat-roll inventory volume: 147,000 tons
- Flat-roll toll processing volume: 24,500 tons
- Tubular segment volume: approximately 7,500 tons
The company's fiscal year 2025 sales volume from Company owned inventory was steady at approximately 500,000 tons. Finance: draft a projection for R&D spend as a percentage of Q2 FY2026 net earnings by Wednesday.
Friedman Industries, Incorporated (FRD) - Ansoff Matrix: Diversification
You're looking at growth outside the core steel processing business, which is smart given the volatility. Friedman Industries, Incorporated (FRD) closed fiscal year 2025 (ending March 31, 2025) with sales of $444.6 million and net earnings of $6.1 million. Still, the latest quarter, Q2 FY2026 (ending September 30, 2025), showed sales hitting $152.4 million, up 43% year-over-year, with net earnings at $2.2 million. That quarter also saw the highest sales volume in Company history, up 28% year-over-year. This suggests the core business is strong enough to fund new ventures, so let's map out those diversification moves.
Acquire a small US metals recycling or scrap processing operation, entering the raw material supply chain market.
Entering raw material supply chain management targets a market segment that, in 2025, is valued at $90.76 billion in the United States. The ferrous metals segment, which is FRD's core, represented approximately 60% of that market share in 2024. If FRD acquired a recycler, it would be tapping into a market projected to grow at a compound annual growth rate of 3.25% through 2034. The post-industrial scrap source segment held about 40% of the market in 2024.
Enter the industrial storage and logistics market by leveraging existing warehouse space for non-steel industrial goods.
The US logistics market overall is anticipated to reach $1,997.6 billion in 2025. For a specific entry point, consider third-party logistics (3PL) providers, whose share of bulk industrial leasing activity is expected to remain near 35% in 2025. The warehousing and storage segment itself is estimated at $90.70 billion in North America for 2025. The refrigerated warehousing segment is growing lucratively with an expected CAGR of 9.4% from 2025 to 2033.
Establish a new business unit to manufacture steel components for the rapidly growing US solar panel racking industry.
This move targets the solar component supply chain. The global solar PV mounting systems market size was $44.5 billion in 2024. The US solar energy market, in terms of installed base, is projected at 203.85 gigawatt in 2025. The global solar racking market is forecasted to reach $40.384 billion in 2025. Ground-mounted systems captured 63.9% of the solar PV mounting systems market share in 2024.
Here's a quick look at the market scale for this potential new product line:
| Metric | Value (2025) | Source Context |
|---|---|---|
| Global Solar Racking Market Size | $40.384 billion | Forecasted market value |
| US Solar Energy Installed Base | 203.85 gigawatt | Installed base projection |
| Global Solar PV Mounting Systems CAGR (2025-2034) | 4.4% | Projected growth rate |
| FRD FY2025 Total Sales | $444.6 million | Friedman Industries, Incorporated revenue |
Purchase a minority stake in a US-based industrial equipment leasing company, utilizing FRD's strong balance sheet.
FRD ended fiscal year 2025 with a working capital balance of $128.1 million, which supports a minority stake purchase. The machinery leasing market size in the US is expected to reach $530.31 billion in 2025, growing from $489.25 billion in 2024. Equipment and software investment in the US is projected to grow at an annualized pace of 4.7% in 2025, though another forecast suggests 2.8%. New business volume growth reported in the ELFA's CapEx Finance Index in October was up 11.9% Year/Year.
Develop specialized, non-steel industrial products, such as composite materials, for the existing manufacturing customer base.
This strategy serves the existing customer base, which drove FRD's sales volume to approximately 500,000 tons of Company owned inventory in fiscal year 2025. The latest quarter (Q2 FY2026) saw flat-roll segment operating profits of $5.7 million. Developing composite materials could hedge against the price volatility that saw steel prices increase 35% during FRD's fourth quarter of fiscal 2025.
- FRD FY2025 Net Earnings: $6.1 million
- FRD Q2 FY2026 Sales: $152.4 million
- FRD Q2 FY2026 Net Earnings: $2.2 million
- FRD FY2025 Sales Volume: ~500,000 tons
Disclaimer
All information, articles, and product details provided on this website are for general informational and educational purposes only. We do not claim any ownership over, nor do we intend to infringe upon, any trademarks, copyrights, logos, brand names, or other intellectual property mentioned or depicted on this site. Such intellectual property remains the property of its respective owners, and any references here are made solely for identification or informational purposes, without implying any affiliation, endorsement, or partnership.
We make no representations or warranties, express or implied, regarding the accuracy, completeness, or suitability of any content or products presented. Nothing on this website should be construed as legal, tax, investment, financial, medical, or other professional advice. In addition, no part of this site—including articles or product references—constitutes a solicitation, recommendation, endorsement, advertisement, or offer to buy or sell any securities, franchises, or other financial instruments, particularly in jurisdictions where such activity would be unlawful.
All content is of a general nature and may not address the specific circumstances of any individual or entity. It is not a substitute for professional advice or services. Any actions you take based on the information provided here are strictly at your own risk. You accept full responsibility for any decisions or outcomes arising from your use of this website and agree to release us from any liability in connection with your use of, or reliance upon, the content or products found herein.