
|
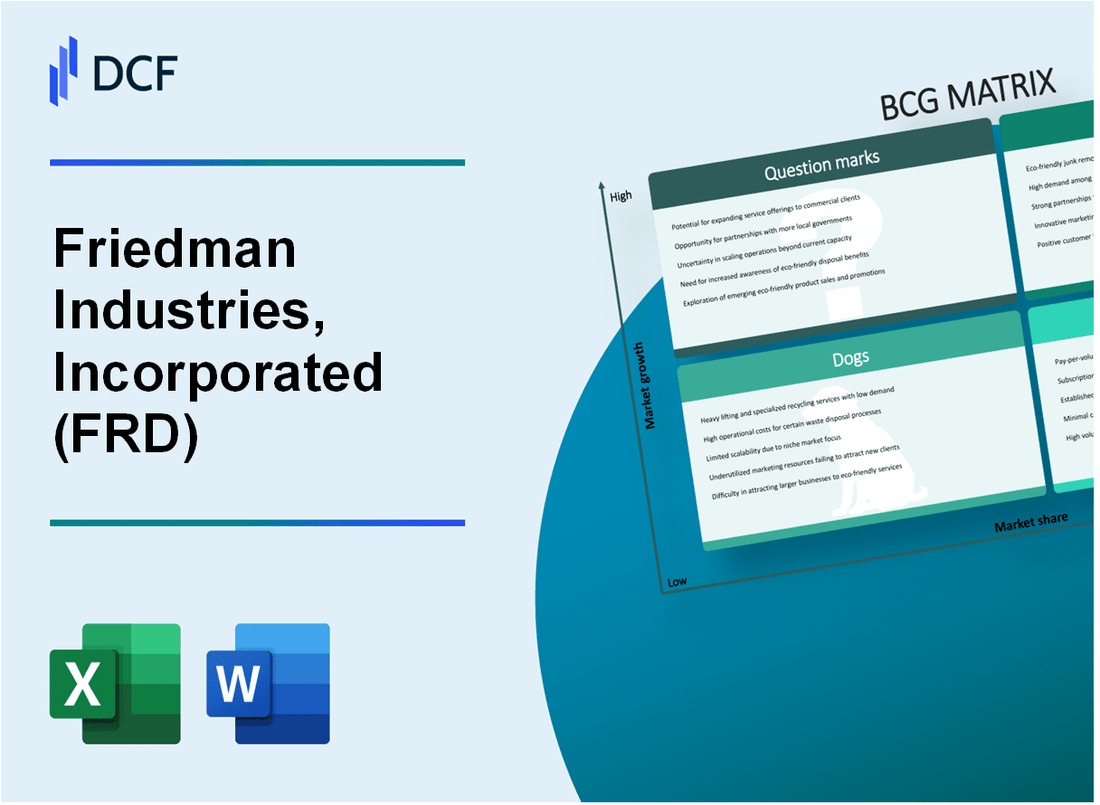
Friedman Industries, Incorporated (FRD): BCG Matrix [Dec-2025 Updated] |
Fully Editable: Tailor To Your Needs In Excel Or Sheets
Professional Design: Trusted, Industry-Standard Templates
Investor-Approved Valuation Models
MAC/PC Compatible, Fully Unlocked
No Expertise Is Needed; Easy To Follow
Friedman Industries, Incorporated (FRD) Bundle
You're looking for a clear, no-nonsense breakdown of where Friedman Industries, Incorporated (FRD) sits right now, using the classic BCG Matrix to map out their business units. Honestly, the steel service center business is cyclical, but their recent moves give us a few clear buckets for their segments: the core flat-roll business is clearly a Star, showing 47.2% sales growth and hitting record volumes, while established operations provide the reliable cash flow of a Cash Cow. Still, you've got the low-volume tubular segment acting as a Dog, and the recent acquisition of Century Metals & Supplies is the classic Question Mark needing capital to justify its integration costs. Let's map out exactly where you should focus your attention below.
Background of Friedman Industries, Incorporated (FRD)
You're looking at Friedman Industries, Incorporated (FRD), which you should know is a diversified metals processing and pipe manufacturing company. They operate across two main areas: the flat-roll and tubular products segments, and they're headquartered right there in Longview, Texas.
For the most recent snapshot, which is the second fiscal quarter ended September 30, 2025, FRD reported some pretty strong top-line numbers. Sales hit $152.4 million, which is a solid 43% increase year-over-year for that quarter. Honestly, they hit a record sales volume in that period, marking a 28% jump compared to the same time last year.
The company's operational focus seems to be shifting, especially after they completed the acquisition of Century Metals & Supplies on August 29, 2025. This move was definitely intended to expand their product portfolio and geographic footprint. The flat-roll segment, in particular, was a powerhouse in that Q2 2026 report, posting operating profits of about $5.7 million.
To give you the full picture for the last completed fiscal year, which ended March 31, 2025, sales were $444.6 million, with net earnings coming in at $6.1 million. That was a step down from fiscal 2024's sales of $516.3 million, but management pointed to their hedging capabilities as key to navigating steel price volatility and still delivering profitable results for the year.
A concrete operational win from that fiscal year was their newest facility in Sinton, Texas; it reached full capacity and actually contributed the highest profit margin among all their facilities. Plus, they actively manage commodity risk, recognizing a total hedging gain of approximately $7.6 million for fiscal 2025.
Looking at their balance sheet strength, as of the end of Q1 fiscal 2026 (June 30, 2025), they had working capital of $117.5 million and a current ratio of 3.9. They also have a $150 million asset-based lending (ABL) facility, which is important for flexibility, though debt under that facility was only $33 million at that point.
So, you've got a company that just made a strategic acquisition, is showing record sales volumes in late 2025, and has a history of using financial tools like hedging to smooth out the rough patches in the cyclical metals market. Finance: draft 13-week cash view by Friday.
Friedman Industries, Incorporated (FRD) - BCG Matrix: Stars
You're looking at the engine room of Friedman Industries, Incorporated (FRD) growth right now, which clearly sits in the Star quadrant. These are the businesses with the best market share in markets that are still expanding rapidly. Honestly, they need cash to keep that growth engine running, but they are the future cash cows if the market growth slows down later.
The flat-roll segment is definitely a Star for Friedman Industries, Incorporated (FRD). Look at the recent sales figures; Q2 2026 saw sales hit $143.3 million, which is a 47.2% jump compared to the same quarter last year. That kind of growth in a core area signals strong market leadership and high demand. Stars are leaders, but they aren't free money yet; they consume cash to maintain that lead.
Here's a quick look at the sheer momentum in that segment for the second quarter of 2026:
| Metric | Value | Year-over-Year Change |
| Flat-Roll Sales | $143.3 million | 47.2% increase |
| Flat-Roll Operating Profit | $5.7 million | 113.5% increase |
| Total Company Volume Growth | Company Record | 28% increase |
The operational improvements are just as telling. The core steel processing operations are actively taking share, which is why the flat-roll operating profit surged by 113.5% to $5.7 million in Q2 2026. That's more than doubling the profit from the prior year in that specific unit. Plus, the new Sinton, Texas facility is now running at full capacity, and it's contributing the highest profit margin across all of Friedman Industries, Incorporated (FRD)'s operations. That facility is a prime example of investing in a Star to secure future dominance.
To keep these Stars shining, Friedman Industries, Incorporated (FRD) must continue to support them heavily. The strategy here is clear: invest to maintain market share until the market matures. Here's what that investment focus looks like:
- Maintain high levels of promotion spending to keep brand visibility.
- Ensure placement and distribution networks are robust and expanding.
- Fund capacity expansions, like the Sinton facility, to meet demand.
- Drive efficiency to convert high revenue into sustainable profit margins.
The high sales volume growth, reaching a company record with total volume up 28% year-over-year in Q2 2026, confirms this unit is operating in a high-growth environment. If Friedman Industries, Incorporated (FRD) keeps this success until the market growth naturally slows, this segment will transition from a Star, which consumes cash to grow, into a Cash Cow, which generates significant net cash flow. Finance: draft the capital expenditure plan for Q3 2026 flat-roll capacity utilization by next Wednesday.
Friedman Industries, Incorporated (FRD) - BCG Matrix: Cash Cows
You're looking at the core engine of Friedman Industries, Incorporated (FRD) here-the business units that generate more cash than they need to maintain their position. For FRD, this quadrant is anchored by the established, non-growth portion of the Flat-roll segment. This segment is the market leader in a mature space, which means it commands high market share and, when managed well, delivers high profit margins and a reliable cash flow stream. For instance, looking at a recent period, the Flat-roll segment recorded operating profits of approximately $5.7 million in the second quarter of fiscal 2026, demonstrating its capacity to generate significant cash.
These Cash Cows are what fund the rest of the company's ambitions, covering overhead, servicing debt, and fueling the development of Question Marks. The financial health supporting this operation is evident in the balance sheet strength achieved by the end of fiscal year 2025. You see this stability reflected in the working capital balance, which stood at $128.1 million at the end of fiscal year 2025. This liquidity is crucial for a mature business, allowing for operational flexibility without constant reliance on external financing.
Effective management of commodity price risk is another hallmark of a successful Cash Cow operation, ensuring that profit margins aren't eroded by steel price volatility. Friedman Industries, Incorporated uses Hot-Rolled Coil (HRC) futures for this purpose. This strategy proved its worth recently, as hedging activities generated a $0.9 million gain in the second quarter of fiscal 2026, partially offsetting compressed physical margins during that period. For the full fiscal year 2025, the total gain from these hedging activities was $7.6 million, showing the consistent benefit of this proactive risk management.
Here's a quick look at the overall financial picture for the fiscal year 2025, which underscores the base-level performance of these cash-generating units:
| Metric | Value (FY 2025) |
|---|---|
| Sales | $444.6 million |
| Net Earnings | $6.1 million |
| Working Capital Balance (Year-End) | $128.1 million |
The strategy here isn't aggressive expansion, but rather maintenance and efficiency improvements to maximize the cash extraction. Investments are focused on supporting infrastructure to improve efficiency and increase that cash flow further, rather than heavy promotion in a slow-growth market. The overall performance of Friedman Industries, Incorporated for the full fiscal year 2025 was net earnings of $6.1 million on sales of $444.6 million.
The key takeaways regarding the Cash Cow status, driven by the Flat-roll segment, are:
- High market share in a mature segment.
- Consistent operating cash flow generation.
- Strong balance sheet support with $128.1 million working capital.
- Effective use of HRC futures to secure gains, like the $0.9 million in Q2 2026.
- Overall fiscal 2025 performance: $6.1 million net earnings on $444.6 million sales.
Finance: review the capital expenditure plan for the Flat-roll segment infrastructure upgrades by next Tuesday.
Friedman Industries, Incorporated (FRD) - BCG Matrix: Dogs
You're looking at the segment of Friedman Industries, Incorporated (FRD) that requires the most scrutiny right now, the Dogs. These are units stuck in low-growth markets, and frankly, they aren't capturing much market share either. Honestly, expensive turn-around plans for these areas rarely pay off; they tend to be cash traps where capital sits doing very little.
For Friedman Industries, Incorporated (FRD), the tubular products segment fits squarely into this Dog quadrant. It's a small player in what is becoming an increasingly fragmented market, and the volume trend is not your friend here. We saw the sales volume for the tubular segment decrease from 9,000 tons to 7,500 tons in Q2 2026. That's a clear signal of market contraction or loss of competitive footing.
The revenue impact mirrors that volume drop. Q2 2026 tubular sales were down to $9.0 million from $9.4 million in the prior year quarter. When you look at the profitability, or lack thereof, this segment has historically struggled. For instance, it recorded a $0.6 million operating loss in Q2 2024. Here's the quick math: the segment is consuming resources while delivering minimal top-line growth, if any.
To give you a clear snapshot of the recent performance metrics for this unit, look at this comparison:
| Metric | Q2 2025 (Prior Year) | Q2 2026 (Latest Reported) |
| Sales Volume (Tons) | 9,000 | 7,500 |
| Sales Revenue (Millions USD) | $9.4 million | $9.0 million |
| Historical Operating Result (Q2 2024) | N/A | -$0.6 million Loss |
These units, by definition, neither earn nor consume a massive amount of cash when they are just breaking even, but the money tied up in inventory, working capital, and fixed assets is the real cost. These business units are prime candidates for divestiture because the capital could be redeployed elsewhere in the Friedman Industries, Incorporated (FRD) portfolio.
The core characteristics defining this segment as a Dog are straightforward:
- Low market share in a fragmented market.
- Markets showing low or declining growth rates.
- Volume trend showing a drop to 7,500 tons.
- Revenue decline to $9.0 million in Q2 2026.
- Historical negative operating performance, like the $0.6 million loss in Q2 2024.
- Units that should generally be avoided or minimized.
What this estimate hides is the potential severance or write-down costs associated with a sale, but the ongoing drag on management focus is a definite cost you need to factor in. Finance: draft 13-week cash view by Friday, specifically modeling the exit scenario for this division.
Friedman Industries, Incorporated (FRD) - BCG Matrix: Question Marks
You're looking at the newest, riskiest bet Friedman Industries, Incorporated (FRD) has made, which clearly lands in the Question Marks quadrant: the acquisition of Century Metals & Supplies, Incorporated. This was a high-growth, low-share bet, closed on August 29, 2025. This move brings in new product lines and geographic exposure, but its long-term market share and profitability within the FRD structure are still completely unproven. It's a classic cash consumer right now, needing significant capital to integrate and realize the promised synergies.
This new venture immediately required capital investment for integration and synergy realization to justify the purchase price. To be fair, these integration efforts hit near-term earnings; Friedman Industries, Incorporated incurred integration costs of approximately $0.9 million in Q2 2026, which was the quarter ending September 30, 2025. That $0.9 million hit to Selling, general and administrative expenses is the cash burn you expect from a Question Mark needing to prove its worth quickly.
Here's a quick look at the scale and immediate impact of this new business unit as of the latest reporting period:
| Metric | Value | Context |
| Acquisition Date | August 29, 2025 | The start of its life as an FRD Question Mark. |
| Reported Integration Cost (Q2 2026) | $0.9 million | Non-recurring expense impacting near-term earnings. |
| Century Metals Avg. Annual Revenue (Pre-Acquisition) | $111.0 million | Historical revenue base over the prior three fiscal years. |
| FRD Q2 2026 Net Sales (Actual) | $152.4 million | Total reported sales for the quarter ending September 30, 2025. |
| Pro Forma Q2 2026 Net Sales (Estimated) | ~$173.5 million | Sales including Century Metals, showing incremental scale. |
The acquisition expands Friedman Industries, Incorporated's product portfolio and geographic reach significantly, but this potential is currently theoretical until market adoption solidifies. It adds coil slitting capabilities and broadens the product mix to include cold-rolled, coated, stainless steels, and non-ferrous materials like aluminum and copper. The geographic expansion targets the southeastern U.S., Puerto Rico, and Latin America, tapping into growing residential and corrosion-resistant markets.
These products have high growth prospects because they enter new, dynamic markets, but their low market share within the overall FRD structure means they consume cash without delivering proportional returns yet. The strategy here is clear: you need to get markets to adopt these new offerings quickly. If the investment in integration and market penetration works, this unit could transition into a Star; if it fails to gain traction, it defintely risks becoming a Dog.
The key areas of high-growth market access achieved are:
- Expands product portfolio to include non-ferrous materials.
- Adds coil slitting and cut-to-length capabilities.
- Broadens reach into the southeastern U.S. and Latin America.
- Access to the growing residential market segment.
The best way to handle this Question Mark for Friedman Industries, Incorporated is to invest heavily now to secure that market share, or, if the integration proves too costly or the market response is weak, divest. Finance: draft the 13-week cash view incorporating the expected capital needs for the Century integration by Friday.
Disclaimer
All information, articles, and product details provided on this website are for general informational and educational purposes only. We do not claim any ownership over, nor do we intend to infringe upon, any trademarks, copyrights, logos, brand names, or other intellectual property mentioned or depicted on this site. Such intellectual property remains the property of its respective owners, and any references here are made solely for identification or informational purposes, without implying any affiliation, endorsement, or partnership.
We make no representations or warranties, express or implied, regarding the accuracy, completeness, or suitability of any content or products presented. Nothing on this website should be construed as legal, tax, investment, financial, medical, or other professional advice. In addition, no part of this site—including articles or product references—constitutes a solicitation, recommendation, endorsement, advertisement, or offer to buy or sell any securities, franchises, or other financial instruments, particularly in jurisdictions where such activity would be unlawful.
All content is of a general nature and may not address the specific circumstances of any individual or entity. It is not a substitute for professional advice or services. Any actions you take based on the information provided here are strictly at your own risk. You accept full responsibility for any decisions or outcomes arising from your use of this website and agree to release us from any liability in connection with your use of, or reliance upon, the content or products found herein.