
|
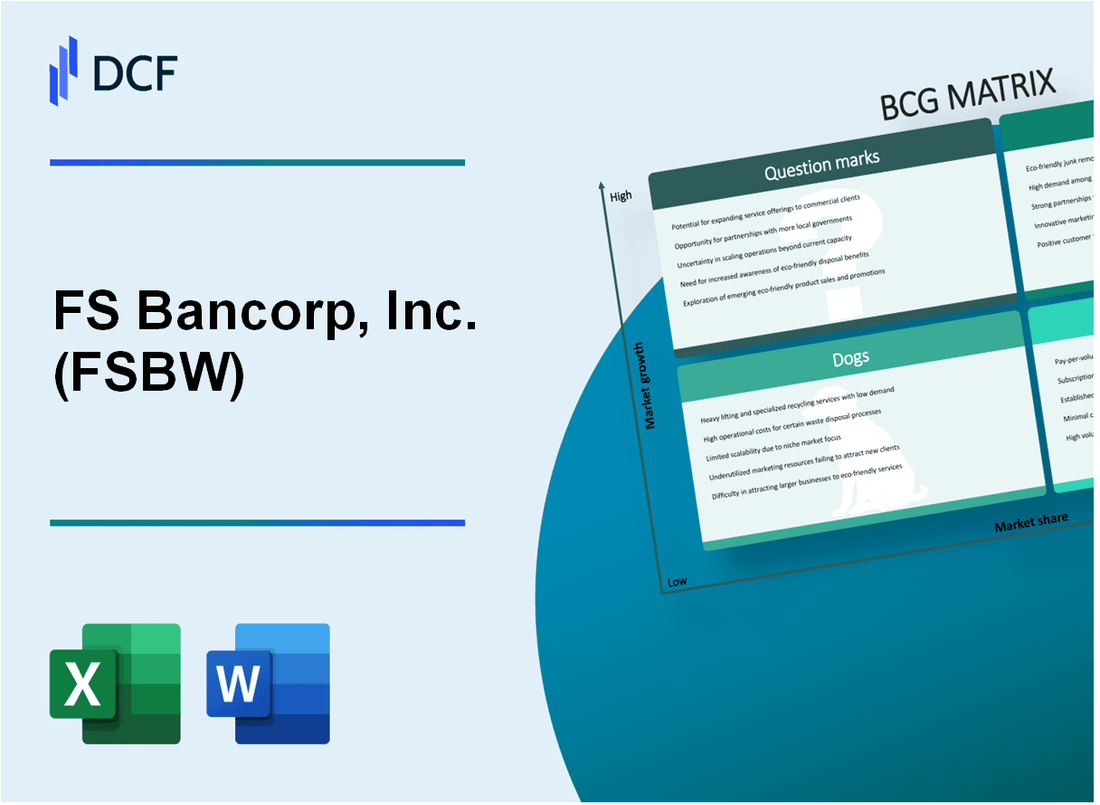
FS Bancorp, Inc. (FSBW): BCG Matrix [Dec-2025 Updated] |
Fully Editable: Tailor To Your Needs In Excel Or Sheets
Professional Design: Trusted, Industry-Standard Templates
Investor-Approved Valuation Models
MAC/PC Compatible, Fully Unlocked
No Expertise Is Needed; Easy To Follow
FS Bancorp, Inc. (FSBW) Bundle
You're digging into FS Bancorp, Inc. (FSBW)'s portfolio health as of late 2025, wanting to know precisely where the bank's capital should be flowing. Honestly, a quick look through the Boston Consulting Group lens reveals a classic banking structure: high-potential 'Stars' in Puget Sound lending need fuel, while the dependable 'Cash Cows'-like that low-cost deposit base-keep the lights on. The critical decision point, though, rests on how aggressively you back the unproven 'Question Marks' while deciding the fate of those underperforming 'Dogs.' Keep reading; we break down the exact segments demanding your immediate strategic focus.
Background of FS Bancorp, Inc. (FSBW)
You're looking to map out the strategic position of FS Bancorp, Inc. (FSBW), so let's start with the basics of the company as of late 2025. FS Bancorp, Inc. operates as the holding company for 1st Security Bank of Washington, which you know as the Bank. This organization is deeply rooted in community banking, focusing its services on small- and middle-market businesses and individuals across Washington and Oregon. The Bank emphasizes a personal approach, which is evident in its network of twenty seven neighborhood branches across the Northwest.
Financially speaking, things were active through the third quarter of 2025. FS Bancorp, Inc. reported a net income of $9.2 Million for the third quarter of 2025, translating to $1.18 per diluted share. This followed a second quarter where net income was $7.7 Million, or $0.99 per diluted share. The commitment to shareholders remains strong; in October 2025, the Board declared its 51st consecutive quarterly cash dividend, and they also authorized an additional share repurchase program of up to $5.0 million.
The balance sheet as of September 30, 2025, showed total assets reaching approximately $3.21 billion, with total net loans standing at $2,599,601 (in thousands, or about $2.60 billion). The lending focus is quite specific, covering commercial real estate, 1-4 family mortgages, consumer credit, and commercial & industrial loans. For instance, looking at Q1 2025 loan detail, Commercial Real Estate (CRE) loans were $873 million, while consumer loans were $609 million.
Operationally, there was a significant leadership transition announced in August 2025. Joe Adams, the retiring Chief Executive Officer of FS Bancorp, Inc., will remain in that role until May 2026. Concurrently, Matt Mullet was named President and CEO of the subsidiary, 1st Security Bank, while also continuing as President of the holding company, FS Bancorp, Inc. This structure supports their ongoing strategy of relationship banking and local decision-making in their core markets.
FS Bancorp, Inc. (FSBW) - BCG Matrix: Stars
The Star quadrant for FS Bancorp, Inc. (FSBW) is characterized by business units operating in high-growth markets where the company maintains a strong relative market share. These areas require significant investment to maintain growth momentum but are positioned to become future Cash Cows.
Focused Commercial and Industrial (C&I) lending in high-growth Puget Sound sub-markets represents a key Star area, evidenced by recent portfolio expansion within the bank's primary operating region, which includes the greater Puget Sound area and parts of Oregon. At the end of the third quarter of 2025, Commercial and Industrial loans grew by $16.6 million quarter-over-quarter. Looking at earlier in the year, the C&I portfolio stood at $275 million as of the first quarter of 2025, reflecting a year-over-year increase of $19 million from the first quarter of 2024 level of $260.06 million.
The strategic expansion of digital banking services supports the overall deposit base growth, which is critical for funding high-growth lending activities. Total deposits reached $2.69 billion at September 30, 2025, marking a 10.7% increase year-over-year from $2.43 billion. Earlier in 2025, deposits surged by $276 million quarter-over-quarter in the first quarter, reaching $2.62 billion. FS Bancorp, Inc. supports its customer base through branch offices complemented by digital and mobile banking channels.
High-performing, specialized loan portfolios show strong year-over-year expansion, indicating leadership in these segments. The overall Loans receivable, net balance at the end of the third quarter of 2025 was $2.60 billion, representing a 5.5% increase from one year prior. Growth in the third quarter of 2025 was specifically driven by commercial and speculative construction and development loans.
Here are the key financial metrics supporting the positioning of these growth-oriented segments as of the latest reported periods in 2025:
| Metric | Value (As of Sept 30, 2025) | Change/Context |
| Total Net Loans | $2.599601 billion | Up 5.5% Year-over-Year (as of Q3 2025) |
| Total Deposits | $2.69 billion | Up 10.7% Year-over-Year (as of Q3 2025) |
| Commercial and Industrial Loans | Not specified for Q3 2025 total | Grew $16.6 million Quarter-over-Quarter (Q3 2025) |
| C&I Loan Balance (Q1 2025) | $275 million | Up $19 million Year-over-Year (from Q1 2024) |
| Net Interest Margin (Q3 2025) | 4.37% | Up from 4.35% in Q3 2024 |
The continued investment in these areas is essential, as Stars consume significant cash to maintain their high market share in growing segments. The bank's focus on relationship banking and local decision-making supports these localized lending strengths.
- Net Income (Q3 2025): $9.2 million
- Diluted EPS (Q3 2025): $1.18
- Total Assets (Sept 30, 2025): $3.208825 billion
- Quarterly Cash Dividend Declared: $0.28 per share
- P/E Ratio (as of Q3 2025): 9.3x
If FS Bancorp, Inc. sustains this success while the high-growth market eventually slows, these units are positioned to transition into Cash Cows, providing stable returns.
FS Bancorp, Inc. (FSBW) - BCG Matrix: Cash Cows
You're looking at the core engine of FS Bancorp, Inc. (FSBW) here-the business units that generate more cash than they consume, allowing the company to fund growth elsewhere. These Cash Cows thrive on high market share in mature segments, which translates directly into the financial results we see in the latest filings.
Established, Long-Term Loan Portfolio Generating Stable Income
The established loan portfolio, particularly the Commercial Real Estate (CRE) segment, acts as a primary cash generator. While the overall loan book saw modest sequential growth, the stability of the net interest margin (NIM) demonstrates effective asset management in a mature lending environment. For the third quarter of 2025, FS Bancorp, Inc. reported a net interest margin of 4.37%. This solid margin, combined with net interest income of $33.7 million for the quarter, shows this portfolio is reliably converting its assets into cash flow. To give you a sense of the CRE focus, as of December 31, 2024, CRE loans stood at $590.5 million, representing 23.3% of the gross loan portfolio. Also, commercial business loans were $299.9 million at that time. This is the kind of predictable, high-margin business that defines a Cash Cow.
Core, Low-Cost Deposit Base
A key component supporting the stable NIM is the underlying funding structure. While we don't have the exact breakdown of non-interest-bearing deposits for Q3 2025, the overall deposit base is clearly sticky and growing, which helps keep funding costs disciplined. Total deposits reached $2.69 billion as of September 30, 2025, marking a 5.2% increase from the previous quarter. The management explicitly noted they are maintaining a stable, well-positioned mix of funding liabilities. Furthermore, the company actively reduced higher-cost funding, with borrowings falling by $105.0 million (or 44.8%) sequentially to $129.3 million, which directly supports the strong NIM performance. That reduction in borrowings is the operational efficiency you want to see from a Cash Cow.
Retail Branch Network in Mature Markets
The physical presence of 1st Security Bank of Washington in mature Washington State markets provides the high market penetration necessary for a high market share. The bank serves customers through a network focused on the Puget Sound, Tri-Cities, and Vancouver areas. As of late 2024, the company operated 27 full-service bank branches across Washington and Oregon. This established footprint requires minimal new growth investment but continues to draw in the core deposits mentioned above, helping to keep the overall efficiency ratio in check, which improved to 64.63% in Q3 2025. It's a classic 'milk the asset' scenario; you don't need to build new stores when the existing ones are performing well.
Consistent Fee Income from Treasury Management
Fee income, though it saw a slight year-over-year dip in Q3 2025, is another steady stream generated by servicing the existing small and mid-sized business customer base with treasury management solutions. For the third quarter of 2025, total noninterest income was $5.6 million. Treasury management and cash management services are specifically designed to help these businesses manage liquidity and payment processes, creating a relationship that supports both deposit gathering and fee generation. The company's ability to consistently generate this income, even with fluctuations, supports shareholder returns, as evidenced by the declaration of the 51st consecutive quarterly cash dividend of $0.28 per share.
Here's a quick look at the key financial metrics supporting the Cash Cow status as of the end of Q3 2025:
| Metric | Value (Q3 2025) | Context |
| Net Interest Income | $33.7 million | Stable income from the loan portfolio. |
| Net Interest Margin (NIM) | 4.37% | Indicates strong yield management on earning assets. |
| Total Deposits | $2.69 billion | Growing funding base as of September 30, 2025. |
| Efficiency Ratio | 64.63% | Demonstrates operating discipline. |
| Quarterly Dividend | $0.28 per share | Consistent return of cash to shareholders. |
The focus for these units, as you'd expect, is on maintaining productivity and efficiency, not massive expansion. The recent share repurchase authorization of up to $5.0 million is a perfect example of returning excess cash generated by these reliable segments back to shareholders. If onboarding takes 14+ days, churn risk rises, but for these established units, the risk is lower, and the cash generation is higher.
FS Bancorp, Inc. (FSBW) - BCG Matrix: Dogs
You're looking at the parts of FS Bancorp, Inc. that aren't pulling their weight-the Dogs. These are business lines or asset classes stuck in low-growth markets with a small slice of that market, meaning they tie up capital without generating much return. Honestly, the goal here isn't to spend a fortune trying to fix them; it's usually about minimizing exposure or, frankly, selling them off.
The data from the first three quarters of 2025 clearly points to a few areas fitting this profile, primarily in areas sensitive to market rates and operational drag. For instance, the Home Lending segment's contribution to overall profitability is minimal when you stack it against the core Commercial and Consumer Banking engine. Here's the quick math on segment performance from Q1 2025 to show the disparity:
| Segment | Net Income (Q1 2025) | Strategic Implication |
|---|---|---|
| Commercial & Consumer Banking | $7.78M | Core Cash Generator |
| Home Lending | $0.24M | Low Return/Dog Candidate |
That $\mathbf{\$0.24\text{M}}$ in Net Income for Home Lending in Q1 2025, which was only slightly lower than the $\mathbf{\$0.246\text{M}}$ seen in Q1 2024, suggests a business line that is barely breaking even, especially considering the capital required to support origination and servicing infrastructure. This low-margin origination business is highly sensitive to interest rate volatility and intense competition, exactly what we expect from a Dog.
We see this theme reflected in the specific asset classes that require disproportionate management attention relative to their yield or growth prospects. These are the areas where expensive turn-around plans are unlikely to pay off:
- Legacy, low-margin residential mortgage origination volume, which is constrained by market conditions.
- Certain non-strategic, underperforming branch locations with high occupancy expense relative to deposit growth.
- Run-off portfolios of older, lower-yielding consumer loans that show signs of credit stress, such as the indirect home improvement loans.
- Residential mortgage loans held at fair value, which stood at $\mathbf{\$13.2\text{M}}$ as of June 30, 2025, indicating assets that may have been originated in a different rate environment and are now less strategic.
The broader operational drag is also visible in the efficiency ratio. While management improved it sequentially to $\mathbf{64.63\%}$ in Q3 2025 from $\mathbf{68.40\%}$ in Q2 2025, the Q1 2025 ratio was $\mathbf{69.39\%}$. This fluctuation suggests that managing the overhead across the entire network, including the $\mathbf{27}$ full-service branches operating at the end of 2024, is a constant drain. Furthermore, the consumer loan book, which includes these older assets, is actively shrinking, falling to $\mathbf{\$609\text{M}}$ in Q1 2025 from $\mathbf{\$646\text{M}}$ year-over-year. This contraction, coupled with rising net charge-offs in that category, makes these run-off portfolios cash traps that need active divestiture planning.
FS Bancorp, Inc. (FSBW) - BCG Matrix: Question Marks
These Question Marks represent FS Bancorp, Inc.'s strategic bets in high-growth areas where market share is still being established. These units are consuming capital to fuel expansion, hoping to transition into Stars. The challenge is converting this high-growth potential into profitable market dominance quickly.
Recent investment in a new FinTech partnership aimed at expanding lending outside the core geographic area is a classic Question Mark play. While the specific investment dollar amount for the FinTech partnership is not publicly itemized in the Q3 2025 filings, the overall growth trajectory suggests capital is being deployed for future scale. The bank is clearly focused on expanding its reach beyond its established footprint.
Expansion into new, less-established geographic markets outside of Washington State is evidenced by the bank's stated operational footprint. FS Bancorp, Inc. operates branches and loan production offices in Oregon, in addition to its presence in the greater Puget Sound area and the Tri-Cities metropolitan area of Washington State. This geographical diversification is a high-growth market strategy, but the associated market share gains and associated returns are not yet mature enough to categorize these regions as Cash Cows.
Development of a specialized wealth management division, requiring significant upfront capital and talent acquisition, is an area where investment is necessary to capture a larger share of high-net-worth client assets. The bank's focus on relationship banking suggests this division is intended to deepen customer relationships, which typically requires initial cash burn before fee income scales. The Board's decision to authorize an additional share repurchase program of up to $5.0 million on October 27, 2025, shows management is actively balancing capital deployment between growth initiatives and returning capital to shareholders.
New commercial lending product lines with high potential but currently low market share and unproven profitability are visible in the loan growth figures from the third quarter of 2025. The growth in specific loan categories shows where the bank is actively pushing new or expanded products:
- Commercial and speculative construction and development loans increased by $26.0 million in Q3 2025.
- Commercial and industrial loans grew by $16.6 million in the same quarter.
These lending segments represent the high-growth market where FS Bancorp, Inc. is trying to gain traction. The overall loan portfolio, Total Net Loans, stood at $2,599,601 (in thousands) as of September 30, 2025.
To frame the current financial context for these growth areas, here are key metrics from the third quarter of 2025:
| Metric | Value (Q3 2025) | Context |
| Diluted Earnings Per Share (EPS) | $1.18 | Beat consensus estimate of $1.08 |
| Quarterly Revenue | $39.28 million | Above analyst estimates of $38.15 million |
| Net Interest Margin (NIM) | 4.37% | Expanded from 4.30% in Q2 2025 |
| Total Deposits | $2.69 billion | Increased 5.2% Quarter-over-Quarter |
| Total Assets | $3,208,825 (in thousands) | As of September 30, 2025 |
| Net Income | $9.2 million | Down from $10.3 million in Q3 2024 |
The growth in deposits, surging 5.2% Quarter-over-Quarter to $2.69 billion, shows strong market reception to the bank's funding strategies, which is critical for funding these high-growth lending Question Marks. However, the net income of $9.2 million for Q3 2025, down from the prior year's $10.3 million, reflects the cost of capital deployment and elevated credit costs, which is typical for Question Marks that are currently losing money or showing lower returns relative to investment.
The bank is actively managing its capital structure to support these ventures. Key capital deployment actions observed in late 2025 include:
- Authorized a new share repurchase program of up to $5.0 million.
- Reduced FHLB borrowings by $105.0 million (-44.8%) QoQ to $129.3 million in Q3 2025, improving the funding profile.
- In Q1 2025, FHLB advances were paid down by $239 million QoQ due to deposit surges.
If these new ventures do not rapidly improve profitability, the capital consumed will continue to pressure net income, making the decision to invest heavily or divest an immediate strategic concern. Finance: draft 13-week cash view by Friday.
Disclaimer
All information, articles, and product details provided on this website are for general informational and educational purposes only. We do not claim any ownership over, nor do we intend to infringe upon, any trademarks, copyrights, logos, brand names, or other intellectual property mentioned or depicted on this site. Such intellectual property remains the property of its respective owners, and any references here are made solely for identification or informational purposes, without implying any affiliation, endorsement, or partnership.
We make no representations or warranties, express or implied, regarding the accuracy, completeness, or suitability of any content or products presented. Nothing on this website should be construed as legal, tax, investment, financial, medical, or other professional advice. In addition, no part of this site—including articles or product references—constitutes a solicitation, recommendation, endorsement, advertisement, or offer to buy or sell any securities, franchises, or other financial instruments, particularly in jurisdictions where such activity would be unlawful.
All content is of a general nature and may not address the specific circumstances of any individual or entity. It is not a substitute for professional advice or services. Any actions you take based on the information provided here are strictly at your own risk. You accept full responsibility for any decisions or outcomes arising from your use of this website and agree to release us from any liability in connection with your use of, or reliance upon, the content or products found herein.