
|
Franklin Street Properties Corp. (FSP) DCF Valuation |
Fully Editable: Tailor To Your Needs In Excel Or Sheets
Professional Design: Trusted, Industry-Standard Templates
Investor-Approved Valuation Models
MAC/PC Compatible, Fully Unlocked
No Expertise Is Needed; Easy To Follow
Franklin Street Properties Corp. (FSP) Bundle
Simplify Franklin Street Properties Corp. (FSP) valuation with this customizable DCF Calculator! Featuring real Franklin Street Properties Corp. (FSP) financials and adjustable forecast inputs, you can test scenarios and uncover Franklin Street Properties Corp. (FSP) fair value in minutes.
What You Will Receive
- Adjustable Forecast Inputs: Modify key assumptions (growth %, margins, WACC) effortlessly to explore various scenarios.
- Real-World Data: Franklin Street Properties Corp. (FSP) financial data pre-loaded to kickstart your analysis.
- Automated DCF Outputs: The template computes Net Present Value (NPV) and intrinsic value automatically for you.
- Customizable and Professional: A sleek Excel model designed to meet your valuation requirements.
- Designed for Analysts and Investors: Perfect for evaluating projections, confirming strategies, and enhancing efficiency.
Key Features
- Customizable Investment Metrics: Adjust essential parameters such as occupancy rates, rental income growth, and operating expenses.
- Instant Property Valuation: Automatically computes market value, cap rates, and other key financial indicators.
- High-Precision Analytics: Leverages Franklin Street Properties' real estate data for accurate investment assessments.
- Comprehensive Scenario Planning: Easily evaluate various market conditions and their potential impacts on performance.
- Efficiency Booster: Streamlines the valuation process, removing the need for intricate financial models.
How It Works
- Download: Get the pre-prepared Excel file containing Franklin Street Properties Corp.'s (FSP) financial data.
- Customize: Modify projections, including revenue growth, EBITDA %, and WACC.
- Update Automatically: The intrinsic value and NPV calculations refresh in real-time.
- Test Scenarios: Develop various forecasts and analyze results immediately.
- Make Decisions: Leverage the valuation findings to inform your investment approach.
Why Choose This Calculator for Franklin Street Properties Corp. (FSP)?
- Designed for Real Estate Experts: A specialized tool tailored for analysts, investors, and property managers.
- Comprehensive Data: Franklin Street Properties’ historical and projected financials included for precision.
- Flexible Scenario Analysis: Easily test various investment scenarios and assumptions.
- Insightful Outputs: Automatically calculates intrinsic value, NPV, and essential real estate metrics.
- User-Friendly Interface: Step-by-step guidance ensures a smooth calculation process.
Who Should Use This Product?
- Investors: Evaluate Franklin Street Properties Corp. (FSP)'s performance before making investment decisions.
- CFOs and Financial Analysts: Enhance valuation methodologies and assess financial forecasts.
- Real Estate Developers: Understand how publicly traded real estate companies like Franklin Street Properties Corp. (FSP) are valued.
- Consultants: Provide expert valuation analyses for clients in the real estate sector.
- Students and Educators: Utilize current market data to practice and teach real estate valuation principles.
What the Template Contains
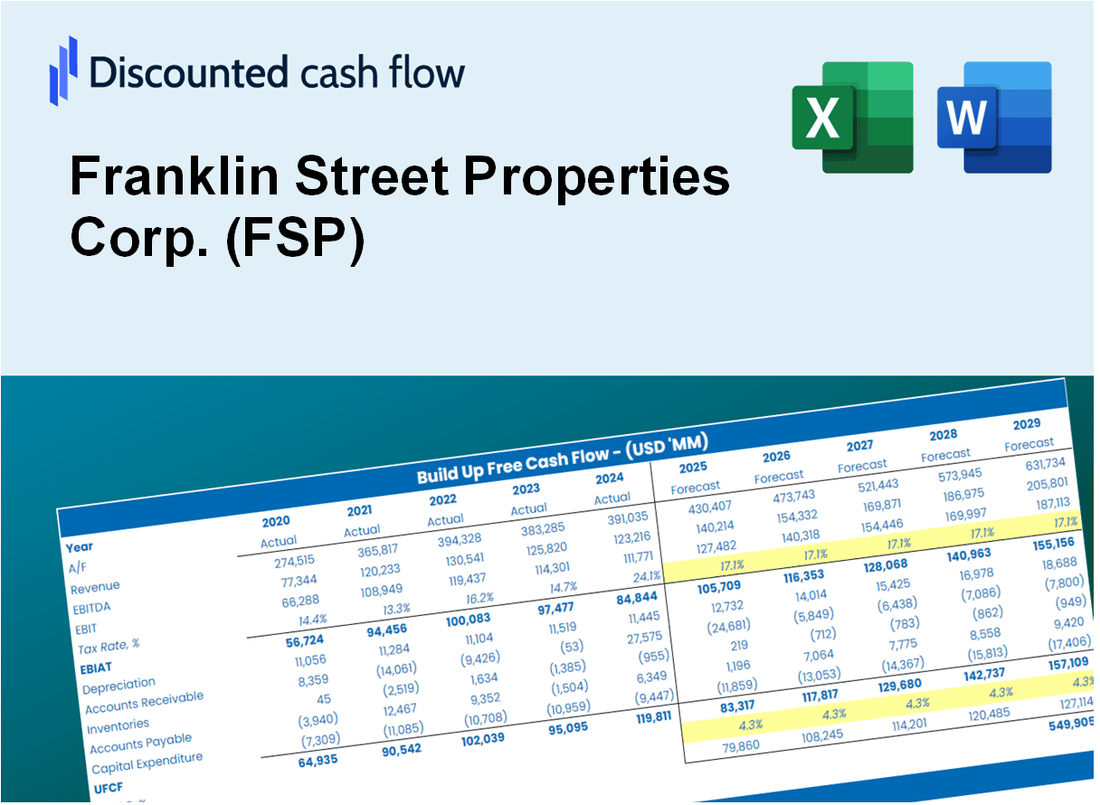
- Preloaded FSP Data: Historical and projected financial data, including revenue, EBIT, and capital expenditures.
- DCF and WACC Models: Professional-grade sheets for calculating intrinsic value and Weighted Average Cost of Capital.
- Editable Inputs: Yellow-highlighted cells for adjusting revenue growth, tax rates, and discount rates.
- Financial Statements: Comprehensive annual and quarterly financials for deeper analysis.
- Key Ratios: Profitability, leverage, and efficiency ratios to evaluate performance.
- Dashboard and Charts: Visual summaries of valuation outcomes and assumptions.
Disclaimer
All information, articles, and product details provided on this website are for general informational and educational purposes only. We do not claim any ownership over, nor do we intend to infringe upon, any trademarks, copyrights, logos, brand names, or other intellectual property mentioned or depicted on this site. Such intellectual property remains the property of its respective owners, and any references here are made solely for identification or informational purposes, without implying any affiliation, endorsement, or partnership.
We make no representations or warranties, express or implied, regarding the accuracy, completeness, or suitability of any content or products presented. Nothing on this website should be construed as legal, tax, investment, financial, medical, or other professional advice. In addition, no part of this site—including articles or product references—constitutes a solicitation, recommendation, endorsement, advertisement, or offer to buy or sell any securities, franchises, or other financial instruments, particularly in jurisdictions where such activity would be unlawful.
All content is of a general nature and may not address the specific circumstances of any individual or entity. It is not a substitute for professional advice or services. Any actions you take based on the information provided here are strictly at your own risk. You accept full responsibility for any decisions or outcomes arising from your use of this website and agree to release us from any liability in connection with your use of, or reliance upon, the content or products found herein.