
|
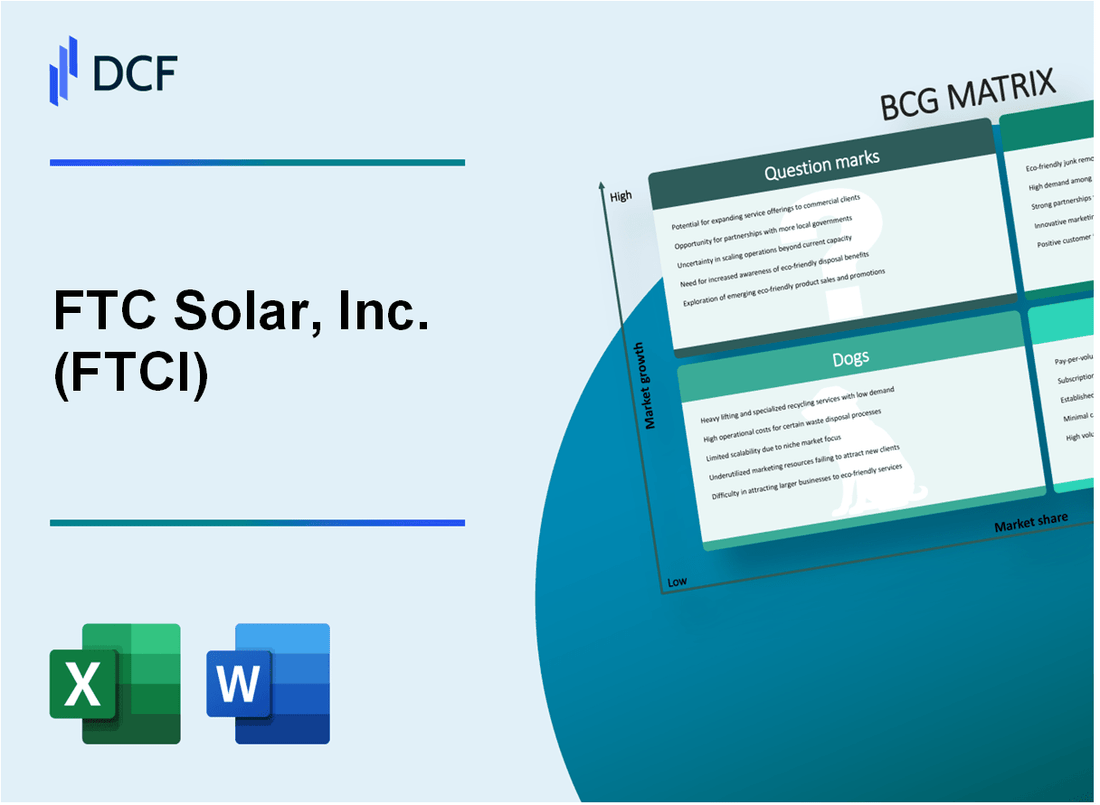
FTC Solar, Inc. (FTCI): BCG Matrix [Dec-2025 Updated] |
Fully Editable: Tailor To Your Needs In Excel Or Sheets
Professional Design: Trusted, Industry-Standard Templates
Investor-Approved Valuation Models
MAC/PC Compatible, Fully Unlocked
No Expertise Is Needed; Easy To Follow
FTC Solar, Inc. (FTCI) Bundle
You're looking at FTC Solar, Inc. right now, and honestly, this is a classic turnaround story where the lines on the Boston Consulting Group Matrix are a bit fuzzy, but the core strategy is sharp. We're seeing explosive growth, with revenue jumping 156.8% year-over-year in Q3 2025 thanks to products like the 1P Pioneer Tracker, which clearly lands in the 'Star' quadrant. However, the company is still capital-intensive, evidenced by the $4.0 million Adjusted EBITDA loss, meaning much of the portfolio-especially new tech and expansion efforts-sits squarely in 'Question Marks' while legacy financial drags act as 'Dogs.' Read on to see the precise breakdown of where FTC Solar, Inc. must invest or divest to convert this massive market momentum into real, lasting profit.
Background of FTC Solar, Inc. (FTCI)
You're looking at FTC Solar, Inc. (FTCI) right now, and the story is one of a significant revenue rebound battling persistent losses. FTC Solar, Inc. is fundamentally a provider of solar tracker systems, which are the mechanical structures that move solar panels to follow the sun, maximizing energy capture at large solar installations. They also sell proprietary software and offer engineering services alongside their main product lines.
The company's investment narrative centers on scaling up revenue while trying to get its margins right. For the third quarter of 2025, which ended September 30, FTC Solar, Inc. reported revenue of $26.03 million. That's a massive jump, representing a 156.8% increase year-over-year and a 30.2% sequential gain over the prior quarter. Management is projecting this momentum to continue, guiding for fourth-quarter 2025 revenue between $30.0 million and $35.0 million.
Here's the quick math on the cost side: while sales are surging, the GAAP net loss for Q3 2025 widened to $23.94 million from $15.36 million the year before. Still, there's a bright spot: the company achieved a positive Non-GAAP gross profit of $2.0 million, or 7.7% margin, in Q3 2025. Honestly, that was their first positive gross margin since late 2023, signaling real operational progress.
Strategically, FTC Solar, Inc. is pushing product innovation to secure market share. They introduced key products like the Pioneer+ Terrain Following Tracker and the Pioneer+ High Wind tracker to handle complex sites and extreme weather. Plus, they recently moved to take sole ownership of Alpha Steel, acquiring the remaining 55% interest for about $2.7 million, which they expect will lower their cost of goods sold and boost gross margins going forward.
Financially, they bolstered liquidity by closing $37.5 million of an approved $75 million strategic financing facility during 2025. As of late 2025, the company's contracted backlog-the work they have locked in but not yet fully recognized as revenue-stands at approximately $462 million. To be fair, the stock performance reflects this turnaround sentiment; as of October 31, 2025, the market capitalization was $131M.
FTC Solar, Inc. (FTCI) - BCG Matrix: Stars
You're looking at the core growth engine of FTC Solar, Inc. (FTCI) right now, the segment that defines high market share in a market that's still expanding rapidly. These are the units that demand significant capital to maintain their lead but are essential for the company's future Cash Cow status. Honestly, the Q3 2025 results definitely show this dynamic in action.
The Pioneer 1P tracker platform is clearly leading this charge. This product line is tied directly to the company's massive top-line expansion, driving a year-over-year revenue growth of 156.8% in the third quarter of 2025. This level of growth signals strong product acceptance in a market that hasn't slowed down yet, meaning FTC Solar, Inc. is investing heavily to keep that momentum going.
Here's a quick look at the Q3 2025 operational snapshot that supports this high-growth positioning:
| Metric | Value (Q3 2025) | Context |
| Revenue | $26.0 million | Up 30.2% sequentially |
| Year-over-Year Revenue Growth | 156.8% | Highest level in eight quarters |
| Non-GAAP Gross Margin | 7.7% | Return to positive margin for the first time since late 2023 |
| Adjusted EBITDA Loss | $4.0 million loss | Best result since 2020 |
The contracted backlog provides the necessary revenue visibility to justify the capital consumption required for this growth. As of the Q3 2025 announcement, this backlog stood at approximately $462 million. That figure represents secured future revenue, but it's important to note this amount excludes the very large, recently announced Levona agreement, which adds even more to the forward pipeline.
Vertical integration is a key strategic action FTC Solar, Inc. is taking to improve the economics of these Star products. Following the quarter end, the company entered an agreement to acquire the remaining 55% interest in Alpha Steel for approximately $2.7 million in cash. Full ownership of this Houston, Texas-based steel component manufacturer is expected to directly result in lower Cost of Goods Sold (COGS) and an improved gross margin, plus it secures domestic content compliance.
Major customer commitment is further evidenced by the 1GW Levona Agreement. This significant supply deal, announced in August 2025, signals massive customer confidence in the product line. The total commitment is for one gigawatt of trackers and software, with the initial project, CT Solar One, being a 140-megawatt utility-scale facility in Snyder, Texas, slated for construction start in early 2026. This deal will utilize the Pioneer 1P trackers along with the SunPath performance-enhancing software.
These are the core elements fueling the Star quadrant investment thesis for FTC Solar, Inc.:
- 156.8% Y/Y revenue growth in Q3 2025.
- $462 million in contracted backlog providing revenue visibility.
- Acquisition of 55% of Alpha Steel for $2.7 million to lower COGS.
- Secured a 1GW tracker and software supply agreement with Levona Renewables.
FTC Solar, Inc. (FTCI) - BCG Matrix: Cash Cows
You're looking at the Cash Cow quadrant, expecting to see a stable, profit-printing machine, but for FTC Solar, Inc., the reality is different as of late 2025. Honestly, the company isn't generating free cash flow; it's still deep in a capital-intensive turnaround phase. The market recognizes this, which is why it's not categorized as a true Cash Cow yet, despite some operational wins.
The key metric here is the Adjusted EBITDA loss of $4.0 million for the third quarter of 2025. While this loss is the best the company has posted since the third quarter of 2020, and materially better than the Q2 loss of $10.4 million, it still represents a cash burn, not a cash surplus. This unit is consuming capital to support its growth trajectory, not funding the rest of the business.
The closest thing to a Cash Cow characteristic is the return to positive gross margins, which signals improving unit economics. The Non-GAAP gross margin hit 7.7% in Q3 2025, marking the first positive margin since late 2023. This is a significant operational inflection point, showing that cost actions and higher-margin revenue pull-forward are working. To be fair, the GAAP gross margin was slightly lower at 6.1% for the same period.
Here's a quick look at the Q3 2025 operational snapshot:
- Non-GAAP Gross Margin: 7.7%
- GAAP Gross Margin: 6.1%
- Adjusted EBITDA Loss: $4.0 million
- Total Revenue: $26.0 million
The product mix shows where the legacy, more established offerings sit. The Legacy Voyager 2P System, the dual-panel tracker, is certainly contributing, but it isn't the primary driver of the current growth surge. It is part of the overall product revenue stream that totaled $20.06 million in Q3 2025. The service revenue made up the rest at $5.97 million.
You can see the core financial picture below:
| Metric | Value (Q3 2025) | Context |
| Total Revenue | $26.0 million | Up 157% year-over-year. |
| Product Revenue | $20.06 million | Includes established systems like the Voyager 2P. |
| Non-GAAP Gross Margin | 7.7% | First positive margin since late 2023. |
| Adjusted EBITDA | Loss of $4.0 million | Best result in five years. |
| GAAP Net Loss | $23.9 million | Impacted by non-cash warrant liability adjustments. |
The strategy for these established products is to maintain efficiency, not pour in heavy promotion dollars. Investments are focused on infrastructure supporting the whole operation, like the full ownership of Alpha Steel, which management expects will lower Cost of Goods Sold (COGS) and improve margins further. The goal is to 'milk' the gains from improved operational discipline to fund the higher-growth, higher-risk Question Marks in the portfolio.
The Voyager 2P system represents the established base that provides necessary, albeit currently insufficient, cash flow support. Its lower-risk profile contrasts with newer, more differentiated products like the 1P line or the 80-degree high-angle hail stow feature.
- Legacy Voyager 2P System: Established, lower-risk offering.
- Contribution: Part of the $20.06 million product revenue.
- Role: Provides baseline revenue while new products scale.
Finance: draft Q4 2025 cash flow projection incorporating the Q4 Adjusted EBITDA guidance range of a loss between $5.4 million and breakeven by Friday.
FTC Solar, Inc. (FTCI) - BCG Matrix: Dogs
You're looking at the units here that are tying up capital without delivering meaningful returns, the classic Dogs in the portfolio. These are the areas where FTC Solar, Inc. has historically struggled with market position and growth, and the financials from Q3 2025 definitely show the lingering effects of that history.
Historical Operating Losses: The GAAP Net Loss for the third quarter of 2025 landed at $23.9 million. That figure, $1.61 per diluted share, represents a significant financial drag, honestly, stemming from past operational issues and non-cash charges that are still working their way through the books. It's the legacy cost of doing business in markets or with contracts that weren't set up for success.
High Operating Expense (Opex): Even as the company works to improve margins, the overhead required to maintain these units or manage the wind-down is substantial. On a Non-GAAP basis for Q3 2025, operating expenses were $8.0 million. To put that in perspective against the gross profit, the GAAP operating expenses were $9.3 million. This level of spending, while necessary for scaling other parts of the business, historically consumed all the gross profit generated by these lower-tier segments.
Older, Low-Margin Projects: The struggle with older contracts is clear when you look at the gross margin trajectory. The projects executed before the strategic shift in late 2023 were often at negative gross margins. While FTC Solar, Inc. is phasing these out, the impact is visible in the recent past. For example, the GAAP gross loss in the prior quarter was $3.9 million, representing a negative 19.6% of revenue. By Q3 2025, this had flipped to a GAAP gross profit of $1.6 million, or 6.1% of revenue, showing progress, but the prior period loss is the financial ghost of those older, low-margin deals.
Here's a quick look at how the Q3 2025 performance compares to the drag these units represent, focusing on the GAAP figures that capture the full cost:
| Metric | Q3 2025 Value | Prior Quarter Value |
| GAAP Net Loss | $23.9 million | $15.4 million |
| GAAP Gross Profit/(Loss) | $1.6 million | ($3.9 million) |
| GAAP Operating Expenses | $9.3 million | Not explicitly stated, but Non-GAAP was $8.1 million year-ago quarter |
Dogs are units or products with a low market share and low growth rates. They frequently break even, neither earning nor consuming much cash, but in FTC Solar, Inc.'s case, they have been net consumers due to the historical margin issues. These business units are prime candidates for divestiture because expensive turn-around plans usually don't help when the underlying market dynamics are weak.
The key indicators suggesting these assets fit the Dog category are:
- Historical execution at negative gross margins.
- The need for ongoing Opex to manage or exit the contracts.
- The GAAP Net Loss of $23.9 million in Q3 2025 reflecting legacy burdens.
If onboarding takes 14+ days, churn risk rises, and for these legacy contracts, the risk is that they continue to consume management attention without delivering the required return. Finance: draft 13-week cash view by Friday, specifically modeling the run-off of any remaining negative-margin backlog.
FTC Solar, Inc. (FTCI) - BCG Matrix: Question Marks
You're looking at a business unit that's clearly in a high-growth phase, but it hasn't yet secured the market share to turn a profit. That's the classic setup for a Question Mark in the Boston Consulting Group Matrix for FTC Solar, Inc. (FTCI) as of late 2025.
Overall Company Financial Profile
The growth story is certainly there; third-quarter revenue hit $26.0 million, marking an increase of 156.8% year-over-year (Y/Y). That's a massive jump, showing the market for solar tracking is expanding rapidly. However, this growth is cash-intensive, as the company is still operating at a loss. For the third quarter of 2025, the GAAP net loss was $23.9 million. The non-GAAP gross margin did turn positive at 7.7%, which is a good sign, but the overall operating expenses mean the business unit is consuming cash while fighting for position against established leaders.
Here's the quick math on the Q3 2025 performance:
| Metric | Value (Q3 2025) |
| Revenue | $26.0 million |
| Y/Y Revenue Growth | 156.8% |
| GAAP Net Loss | $23.9 million |
| Adjusted EBITDA Loss | $4.0 million |
| Contracted Backlog | ~$462 million |
2,000V Extra-Long Tracker
This product line represents a bet on the future of utility-scale solar. FTC Solar, Inc. announced the launch of an "extra-long tracker" specifically designed for use with 2,000V systems. This is definitely a move toward next-generation technology, as industry experts see 2,000V as the logical next step for PV systems. Right now, these systems aren't in widespread use, so this product is a pure Question Mark: high potential in a growing technological segment, but the market share and revenue contribution for 2025 are still unproven. It requires significant R&D cash to push adoption, and if buyers don't discover it quickly, it risks becoming a Dog.
Digital Services (SunPath/SunOps)
The software offerings, like SUNPATH for optimizing energy capture and SUNOPS for monitoring performance, are crucial for differentiation. These specialized software tools are designed to enhance system efficiency, which helps drive sales of the core tracker product. While the overall revenue growth is strong, the software component itself is a smaller piece of the revenue pie, reflecting its status as a newer offering fighting for mindshare. The company is focused on increasing traction with its 'more compelling and complete product offering' to drive future revenue.
- SUNPATH optimizes backtracking using sophisticated algorithms.
- SUNOPS monitors PV plant underperformance with digital insights.
- The goal is to amplify energy output and protect solar assets.
- The company is working to convert its pipeline using product differentiation.
International Expansion
To gain the market share needed to turn these Question Marks into Stars, FTC Solar, Inc. is actively pursuing expansion in key global markets, including Asia, Europe, and North Africa. This kind of geographic push demands significant upfront capital for establishing supply chains, sales channels, and local support, which contributes to the current operating losses. To fund this growth trajectory and provide comfort to global customers, the company secured a $75 million strategic financing facility, closing on an initial $37.5 million tranche during the third quarter. This investment is intended to provide ample runway to achieve profitability.
The challenge here is intense, established competition in these regions. The strategy must be to invest heavily now to quickly secure a foothold, or face divestment later. You need to watch how that new financing is deployed to see if it translates into meaningful market share gains abroad, especially against competitors who might already have local manufacturing advantages, like the one gained by acquiring the remaining 55% of Alpha Steel. Finance: draft 13-week cash view by Friday.
Disclaimer
All information, articles, and product details provided on this website are for general informational and educational purposes only. We do not claim any ownership over, nor do we intend to infringe upon, any trademarks, copyrights, logos, brand names, or other intellectual property mentioned or depicted on this site. Such intellectual property remains the property of its respective owners, and any references here are made solely for identification or informational purposes, without implying any affiliation, endorsement, or partnership.
We make no representations or warranties, express or implied, regarding the accuracy, completeness, or suitability of any content or products presented. Nothing on this website should be construed as legal, tax, investment, financial, medical, or other professional advice. In addition, no part of this site—including articles or product references—constitutes a solicitation, recommendation, endorsement, advertisement, or offer to buy or sell any securities, franchises, or other financial instruments, particularly in jurisdictions where such activity would be unlawful.
All content is of a general nature and may not address the specific circumstances of any individual or entity. It is not a substitute for professional advice or services. Any actions you take based on the information provided here are strictly at your own risk. You accept full responsibility for any decisions or outcomes arising from your use of this website and agree to release us from any liability in connection with your use of, or reliance upon, the content or products found herein.