
|
FTC Solar, Inc. (FTCI): 5 FORCES Analysis [Nov-2025 Updated] |
Fully Editable: Tailor To Your Needs In Excel Or Sheets
Professional Design: Trusted, Industry-Standard Templates
Investor-Approved Valuation Models
MAC/PC Compatible, Fully Unlocked
No Expertise Is Needed; Easy To Follow
FTC Solar, Inc. (FTCI) Bundle
You're looking at FTC Solar, Inc. (FTCI) at a pivotal time, where Q3 2025 revenue surged a massive 156.8% year-over-year to $26.0 million, signaling a real operational turnaround. Honestly, this growth is happening while the company makes bold, strategic bets, like spending $2.7 million to take sole ownership of Alpha Steel to secure domestic supply and those crucial Section 45X tax credits. But even with that momentum, they're still competing in a market dominated by players whose backlogs are measured in the billions. So, how do these internal actions actually buffer the five core competitive forces-from supplier leverage to the threat of new entrants-that are defining the solar tracker landscape right now? Dive into the forces analysis below to see the precise pressures shaping FTCI's strategy.
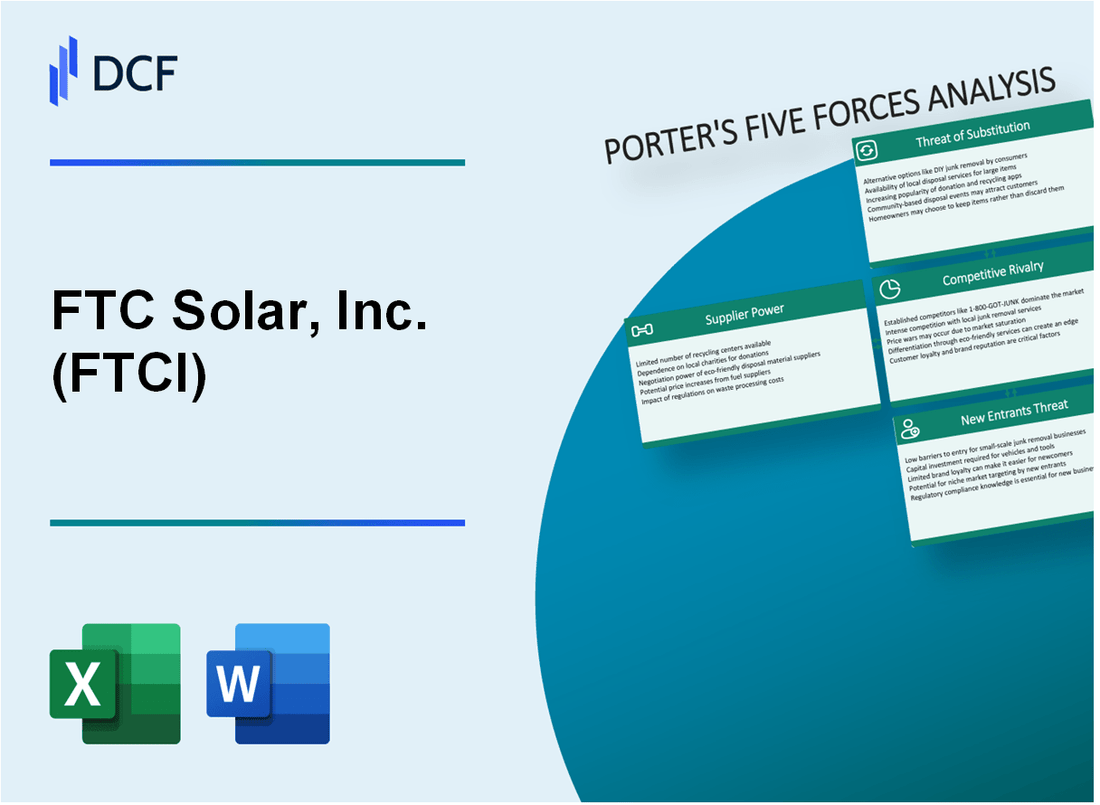
FTC Solar, Inc. (FTCI) - Porter's Five Forces: Bargaining power of suppliers
When you look at FTC Solar, Inc. (FTCI)'s cost structure, the power held by their suppliers is a major lever that management has been actively trying to pull back. For a company that just posted Q3 2025 revenue of $\mathbf{\$26.0}$ million, every dollar saved on components directly impacts the bottom line, especially as they work toward sustained profitability after returning to a positive Non-GAAP Gross Profit of $\mathbf{7.7\%}$ of revenue in that quarter.
Vertical integration via acquiring Alpha Steel (sole owner) lowers steel component leverage.
FTC Solar, Inc. (FTCI) made a definitive move to neutralize one of its largest material suppliers by acquiring the remaining $\mathbf{55\%}$ stake in Alpha Steel, LLC for $\mathbf{\$2.7}$ million in cash in November 2025. This transaction, which represented $\mathbf{2.25\%}$ of the company's market capitalization at the time, means FTC Solar, Inc. (FTCI) now has sole ownership of a domestic producer of core steel components like torque tubes and rails. This level of control is critical because components from Alpha Steel qualify for the Section $\mathbf{45X}$ Advanced Manufacturing Production Credit under the Inflation Reduction Act, which is a direct pathway to future cost optimization and margin enhancement.
Here's a quick look at the strategic investment in supply control:
| Metric | Value/Detail |
| Acquisition Cost (Cash) | $\mathbf{\$2,700,000}$ |
| Stake Acquired | Remaining $\mathbf{55\%}$ (to reach $\mathbf{100\%}$ ownership) |
| Strategic Component | Torque Tubes and Rails |
| Relevant U.S. Incentive | Section $\mathbf{45X}$ Credit Qualification |
| Transaction Size vs. Market Cap (Nov 2025) | $\mathbf{2.25\%}$ |
Raw material price volatility, especially steel, keeps supplier power moderate to high.
Even with the Alpha Steel acquisition, the broader market for raw materials remains a source of pressure. While FTC Solar, Inc. (FTCI) now controls its domestic steel fabrication, the input costs for that fabrication are subject to global commodity swings. To be fair, the industry is dealing with persistent volatility; for example, global polysilicon spot prices rose $\mathbf{12\%}$ in Q1 2025 alone. This underlying commodity risk means that while the fabricator's leverage is reduced, the material provider's leverage remains a concern for the overall cost of goods sold.
- Industry headwinds include policy uncertainty and rising costs due to tariffs.
- Solar tracker manufacturers face persistent margin pressure.
- Domestic capacity relies on imported wafers and cells.
- Global supply chain risks persist, demanding diversified manufacturing partnerships.
Reliance on specialized electronic components for tracker drives limits sourcing flexibility.
The bargaining power of suppliers for the highly specialized electronic components-the brains of the tracker drives-remains a significant factor. Unlike steel, where FTC Solar, Inc. (FTCI) has taken direct ownership, the sourcing for microcontrollers, sensors, and other proprietary electronics is still external. The electronics industry in late 2025 continues to navigate geopolitical risks and evolving demand patterns, which can cause sudden shortages or price spikes for specific integrated circuits. If onboarding for new electronic suppliers takes $\mathbf{14+}$ days, churn risk rises due to project delays.
Global supply chain risks persist, demanding diversified manufacturing partnerships.
The strategic move to fully own Alpha Steel was a direct response to geopolitical supply chain risks, specifically mitigating exposure to AD/CVD investigations targeting component manufacturers in regions like Laos, India, and Indonesia. This domestic focus helps secure compliance with U.S. content guidelines, but it doesn't eliminate all external supplier risk. The company's $\mathbf{1}$ GW tracker supply agreement with Levona Renewables, announced in Q3 2025, underscores the need for reliable, scalable supply across all tiers, not just steel.
You need to watch the lead times and pricing on the custom motor controllers and sensors closely. Finance: draft $\mathbf{13}$-week cash view by Friday.
FTC Solar, Inc. (FTCI) - Porter's Five Forces: Bargaining power of customers
You're looking at the power buyers have over FTC Solar, Inc. (FTCI), and honestly, it's a mixed bag. Since FTC Solar serves the utility-scale solar market, its customers-the large developers and Engineering, Procurement, and Construction (EPC) firms-command serious volume. This sector is booming; the U.S. utility-scale solar market was valued at over $21.7 billion in 2024, and solar is forecast to be more than half of the 64GW of new electric generating capacity coming online in 2025. That scale means these buyers can push hard on price and terms.
Still, the near-term commitment from these large players is quite strong, which tempers their immediate leverage. FTC Solar, Inc. reported a contracted backlog of $470 million as of Q2 2025. That number represents significant future revenue that is already locked in, giving FTC Solar, Inc. some near-term stability against aggressive negotiation.
Here's a quick look at the scale of the customer base and recent commitments:
| Metric | Value | Context/Date |
|---|---|---|
| Contracted Backlog | $470 million | Q2 2025 |
| Major Supply Agreement Volume | 1 GW | With Levona Renewables, deliveries starting early 2026 |
| First Project Under Agreement | 140 MW | CT Solar One in Snyder, Texas |
| Additional Capacity in Agreement | Approx. 650 MW | CT Solar Two and Three |
| U.S. Utility-Scale Solar Installed | 32.5 GW | 2024 |
Now, let's talk about switching costs. Usually, for a major component supplier like this, switching can be a headache involving re-qualifying new hardware and retraining crews. However, FTC Solar, Inc. actively works to lower that barrier. They emphasize a design that is uniquely constructible, which helps customers avoid civil costs and speed up deployment.
The ease of installation is a key counter-force to buyer power. The company's trackers can be installed with just two workers and no specialized tools. This focus on faster, easier installation directly attacks one of the main reasons a customer might stick with an incumbent supplier, effectively reducing the perceived switching cost.
To be fair, while the backlog is solid, major deals do point to customer concentration risk. The 1GW tracker and software supply agreement with Levona Renewables, announced in August 2025, is a prime example. That single agreement represents a significant portion of potential future volume, meaning the loss of a customer like Levona Renewables would definitely hit hard.
- The 1GW deal with Levona Renewables begins deliveries in early 2026.
- The agreement integrates Pioneer 1P trackers and SunPath software.
- The total capacity under the agreement is 1,000 MW.
Finance: draft 13-week cash view by Friday.
FTC Solar, Inc. (FTCI) - Porter's Five Forces: Competitive rivalry
You're looking at a market where scale matters, and FTC Solar, Inc. is definitely fighting against some giants. The competitive rivalry here is intense because the industry structure leans toward high concentration with dominant rivals. We see Nextracker, Array Technologies, and Arctech Solar as the major forces you need to watch.
Honestly, the sheer size difference between FTC Solar, Inc. and the market leaders is stark. For instance, Nextracker reported a massive backlog exceeding $4.5 billion as of its fiscal year 2025 filings. That backlog provides a substantial revenue runway. To put FTC Solar, Inc.'s recent scale in perspective, its Q3 2025 revenue came in at $26.0 million. That's a significant gap when you compare it to the market leaders' scale, even though FTC Solar, Inc. did post a revenue surge of 156.8% year-over-year for that quarter.
Still, FTC Solar, Inc. is making moves to carve out its space, and product innovation is the key differentiator you should be tracking. They are pushing their independent row 1P architecture, which management claims is the fastest and easiest to install in the marketplace. This focus on installation efficiency is a direct shot at reducing customer project costs, which is critical in this capital-intensive sector.
Here's a quick look at the recent scale indicators for the two most clearly quantified players in this rivalry:
| Metric | FTC Solar, Inc. (FTCI) | Nextracker (NXT) |
|---|---|---|
| Latest Reported Quarterly Revenue (Q3 2025) | $26.0 million | $924 million (Q4 FY2025) |
| Latest Reported Full-Year Revenue (FY2025) | N/A (Q3 YTD Bookings: $600 million) | Surpassed $3 billion |
| Reported Backlog (as of FY2025 reporting) | Approximately $462 million (Contracted) | Exceeding $4.5 billion |
| Latest Reported Gross Margin (Non-GAAP Q3 2025) | 7.7% | 33.4% (Q4 FY2025 Adjusted) |
The rivalry isn't just about current revenue; it's about future execution and product superiority. FTC Solar, Inc. is trying to win share by offering tangible installation advantages, which translates directly into customer value propositions.
You can see the focus on innovation in their recent product developments:
- Independent row 1P architecture.
- Washerless tracker design, reducing part count by 15% or more.
- Extra-long tracker for 2,000-volt systems, potentially increasing capacity by 33%.
- Slide & Glide Method for faster installations.
- Secured a 1 GW tracker supply agreement with Levona Renewables.
To be fair, FTC Solar, Inc.'s recent bookings success, hitting $290 million in Q3 2025, signals strong demand for their specific offerings, even against the backdrop of larger competitors. Finance: draft 13-week cash view by Friday.
FTC Solar, Inc. (FTCI) - Porter's Five Forces: Threat of substitutes
You're analyzing the competitive landscape for FTC Solar, Inc. (FTCI) as of late 2025, and the threat of substitutes is a major factor. This force looks at what else a customer could use instead of a solar tracking system, or even solar energy itself. For FTC Solar, Inc., whose core business is single-axis solar trackers, the substitutes range from simpler mounting hardware to entirely different power generation methods.
Fixed-Tilt Mounting Systems
Fixed-tilt mounting systems represent the most direct, lower-tech substitute for FTC Solar, Inc.'s offerings, especially for smaller projects where the capital expenditure premium for tracking might not be immediately justifiable. Fixed-tilt systems are inherently cheaper upfront because they lack the mechanical complexity of trackers. For instance, in 2024, a Lawrence Berkeley National Laboratory report indicated that fixed-tilt projects had overall costs of approximately $1.90/WAC (Watts AC) or $1.35/WDC (Watts DC). Fixed-tilt is now primarily deployed at sites with lower insolation or at particularly challenging sites, such as those in windy regions like Florida. In a specific analysis of new 2024 projects, only 2 out of 13 utilized fixed-tilt, showing the market dominance of trackers in utility-scale deployments.
Single-Axis Trackers vs. Fixed-Tilt Energy Yield
FTC Solar, Inc. focuses heavily on single-axis trackers, such as their 1P and 2P product lines. The primary advantage over fixed-tilt is the energy yield boost. Single-axis trackers typically increase energy production by 25% compared to fixed-tilt systems. Industry reports suggest the improvement ranges from 15-25% or an average of 20-30%. This efficiency gain is critical for lowering the Levelized Cost of Energy (LCOE) for utility-scale projects, which is why over 70% of new utility-scale solar projects now use trackers. FTC Solar, Inc.'s year-to-date bookings reached $600 million by Q3 2025, signaling strong demand for this technology over fixed solutions.
Dual-Axis Trackers
Dual-axis trackers are a higher-performance substitute within the tracking category. They offer superior energy capture by adjusting panels both horizontally and vertically. While single-axis trackers generally provide a 25% to 35% boost over fixed systems, dual-axis systems can increase energy production by 40% or more compared to fixed panels. However, this comes with a significant cost penalty. The typical capital expenditure for dual-axis tracker systems is cited as 20-30% more than fixed-tilt structures. For a standard 4-kilowatt ground-mounted system costing about $13,000 as a fixed array, adding a dual-axis system could increase the total cost to around $26,000. The complexity also leads to higher installation costs, cited around $0.20 to $0.30 per watt.
Here is a quick comparison of the relative performance and cost structure:
| System Type | Energy Production Increase vs. Fixed-Tilt (Typical Range) | Relative Upfront Cost vs. Fixed-Tilt | Primary Application/Trade-off |
|---|---|---|---|
| Fixed-Tilt | Baseline (0%) | Lowest | Cheaper for smaller projects or challenging sites |
| Single-Axis Tracker (FTCI Focus) | 15% to 35% | Moderate Premium | Utility-scale projects; balance of cost and efficiency |
| Dual-Axis Tracker | 40% or more | Significantly Higher (20-30% more than fixed) | Maximum output where land/cost is secondary; higher complexity |
Macro-Level Substitutes: Energy Storage and Alternative Generation
At a macro level, the threat of substitution comes from alternative ways to generate or store power. Energy storage, primarily large batteries, substitutes for the need for solar to provide power on demand. In 2025, the U.S. power grid is expected to add 63 GW of new utility-scale capacity, with solar and storage accounting for 81% of that addition. Specifically, over 31 GW of new storage capacity is expected to be built in 2025, with projections around 18.2 GW to 18.3 GW for the full year. This growth means that stored solar energy directly competes with the need for solar generation capacity alone. Furthermore, alternative generation sources like wind power compete for utility investment dollars.
The competitive landscape for new capacity in 2025 shows this dynamic clearly:
- New utility-scale solar capacity expected in 2025: 32.5 GW to 33.3 GW.
- New battery storage capacity expected in 2025: 18.2 GW to 18.3 GW.
- New natural gas capacity expected in 2025: 4.4 GW.
- New wind capacity expected in 2025: 7.7 GW.
FTC Solar, Inc.'s Q3 2025 results showed $26.0 million in revenue, with $290 million in new project bookings for that quarter alone. This pipeline suggests that despite the competition from storage and wind, the overall demand for solar tracking solutions remains high, especially given that solar is projected to account for more than half of all planned new power capacity in 2025.
FTC Solar, Inc. (FTCI) - Porter's Five Forces: Threat of new entrants
You're looking at the barriers to entry in the utility-scale solar tracking space, and honestly, the deck is stacked against newcomers. It takes serious money and proven technology to even get a seat at the table with established players like FTC Solar, Inc. (FTCI) and Nextracker (now Nextpower).
High capital expenditure and R&D investment are required for utility-scale product entry.
To compete in utility-scale, a new entrant needs capital for manufacturing scale-up and continuous product refinement. Consider FTC Solar, Inc. (FTCI): they recently secured a $75 million credit facility specifically for R&D and working capital, which hints at the funding runway required just to maintain pace. Contrast this with the incumbent scale; Nextracker reported full Fiscal Year 2025 revenues of $3 billion and operates three global research and development innovation centers. A new firm must match this investment level to be taken seriously by large-scale developers.
Existing players hold extensive intellectual property; Nextracker has over 530 patents.
Intellectual property (IP) is a massive moat. Nextracker, for example, defends a portfolio stated to be over 530 patents, covering everything from staged stowage methods to drive apparatuses. FTC Solar, Inc. (FTCI) also invests heavily in its proprietary designs, like its terrain-friendly trackers, but the sheer volume of IP held by the market leader creates significant design and infringement risk for any new entrant trying to offer a functionally similar product.
The landscape of required investment versus incumbent scale is stark:
| Metric | FTC Solar, Inc. (FTCI) Context | Nextracker (NXT) Context (FY2025) |
|---|---|---|
| Recent Financing/Capital Access | Secured $75 million credit facility | Ended FY2025 with over $766 million in cash |
| Scale of Operations (Revenue) | Q3 2025 Revenue: $26 million | Full FY2025 Revenue: $3 billion |
| R&D Footprint | Funding allocated for R&D | Three global R&D innovation centers |
Favorable U.S. incentives (IRA) encourage domestic manufacturing, potentially lowering some barriers.
The Inflation Reduction Act (IRA) is a double-edged sword here. While it incentivizes domestic production, which could theoretically lower supply chain risk for a new domestic player, it also means a new entrant must immediately commit to the scale necessary to capture those benefits. The domestic content threshold for relevant tax credits was set at 60% for 2025. Furthermore, U.S. solar module manufacturing capacity already exceeded 31 GW as of early 2025, driven by the IRA, showing that incumbents and fast-followers have already made massive, subsidized capital commitments. You're not just entering a market; you're trying to break into a market that has already seen a nearly four-fold capacity increase since 2022.
Need for Tier 1 EPC approvals and a proven track record creates high initial credibility hurdles.
Developers building multi-gigawatt projects rely on Engineering, Procurement, and Construction (EPC) firms to vet all suppliers. These EPCs, especially those managing Tier 1 projects, demand a history of successful, large-scale deployments. A new entrant must overcome this initial credibility gap, which often means years of successful project execution before securing a major contract. This vetting process is non-negotiable for de-risking multi-million dollar solar farm investments. The path to securing these approvals involves demonstrating:
- Proven performance metrics in diverse climates.
- Robust warranty and long-term service support.
- Compliance with stringent quality management certifications.
- Successful integration across multiple gigawatts of deployed capacity.
If onboarding takes 14+ days, churn risk rises.
Disclaimer
All information, articles, and product details provided on this website are for general informational and educational purposes only. We do not claim any ownership over, nor do we intend to infringe upon, any trademarks, copyrights, logos, brand names, or other intellectual property mentioned or depicted on this site. Such intellectual property remains the property of its respective owners, and any references here are made solely for identification or informational purposes, without implying any affiliation, endorsement, or partnership.
We make no representations or warranties, express or implied, regarding the accuracy, completeness, or suitability of any content or products presented. Nothing on this website should be construed as legal, tax, investment, financial, medical, or other professional advice. In addition, no part of this site—including articles or product references—constitutes a solicitation, recommendation, endorsement, advertisement, or offer to buy or sell any securities, franchises, or other financial instruments, particularly in jurisdictions where such activity would be unlawful.
All content is of a general nature and may not address the specific circumstances of any individual or entity. It is not a substitute for professional advice or services. Any actions you take based on the information provided here are strictly at your own risk. You accept full responsibility for any decisions or outcomes arising from your use of this website and agree to release us from any liability in connection with your use of, or reliance upon, the content or products found herein.