
|
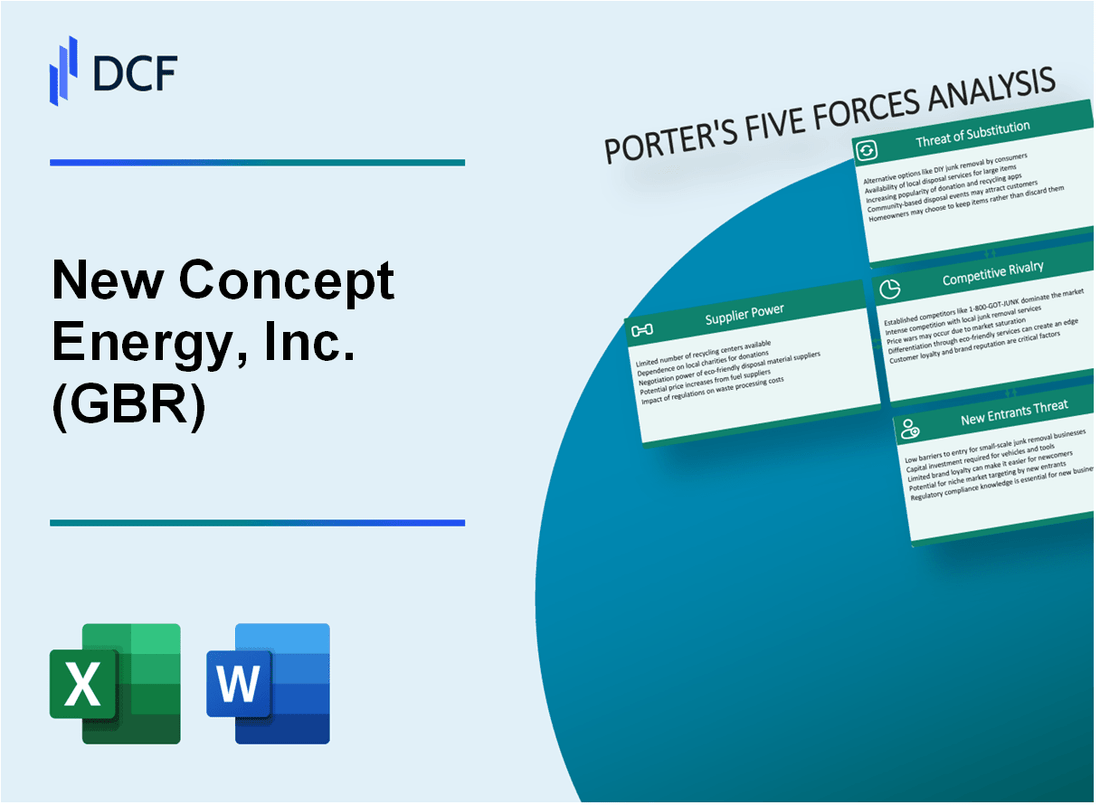
New Concept Energy, Inc. (GBR): 5 FORCES Analysis [Nov-2025 Updated] |
Fully Editable: Tailor To Your Needs In Excel Or Sheets
Professional Design: Trusted, Industry-Standard Templates
Investor-Approved Valuation Models
MAC/PC Compatible, Fully Unlocked
No Expertise Is Needed; Easy To Follow
New Concept Energy, Inc. (GBR) Bundle
You're digging into a company whose entire market position is defined by its micro-scale, operating on razor-thin margins-think about it, New Concept Energy, Inc.'s total revenue in Q3 2025 was just $39,000, split between local real estate and a single oil/gas management client. As a seasoned analyst, I can tell you that when revenue is this small, the standard competitive playbook gets flipped; we're not worried about the big energy sector rivals, but about that one third-party client who holds extreme bargaining power, plus the low barriers to entry for both their tiny segments. Below, I map out exactly how Porter's Five Forces frames this near-term risk profile for New Concept Energy, Inc., especially considering their $18,000 net loss in 2024, so you can see where the real pressure points are.
New Concept Energy, Inc. (GBR) - Porter's Five Forces: Bargaining power of suppliers
You're analyzing New Concept Energy, Inc. (GBR)'s supplier landscape, and honestly, the power dynamics here are heavily influenced by the company's dual-focus business model-owning real estate and managing O&G assets for someone else. This structure creates distinct supplier groups, each with different leverage points.
Suppliers of specialized O&G field services hold power due to limited alternatives for the managed asset. New Concept Energy, Inc. (GBR) provides management services for a single third-party oil and gas company, whose operations are concentrated in areas like the Appalachian Basin and Utica Basin. While the search results confirm the management fee structure is 10% of oil and gas revenue, the actual revenue generated from this service line is relatively small compared to the overall corporate structure. For the second quarter ended June 30, 2025, management fees were \$14,000, and for the first quarter ended March 31, 2025, they were \$12,000. This low revenue base suggests that while specialized O&G service providers might be few, the total potential revenue they can extract from New Concept Energy, Inc. (GBR) is capped by the scale of the managed asset, limiting their overall bargaining strength against the parent company.
The company's low operating expenses limit supplier revenue potential. Consider the fixed and semi-fixed costs associated with the real estate segment, which is the more stable revenue stream. For the full year ended December 31, 2024, operating expenses for the real estate property were \$48,000. General and administrative expenses, which cover many corporate overhead suppliers, were \$335,000 for the full year 2024, though they rose to \$89,000 for the first quarter of 2025 alone. These relatively contained expense figures mean that even if a specific supplier demands a higher rate, the absolute dollar impact on New Concept Energy, Inc. (GBR)'s bottom line is manageable, especially since the company is debt-free with total liabilities at \$63.00k as of the latest available metrics.
Real estate suppliers (utilities, maintenance) are local but not highly concentrated. New Concept Energy, Inc. (GBR) owns 191 acres of land in Parkersburg, West Virginia, which houses four structures totaling approximately 53,000 square feet. This physical location dictates that utility and maintenance suppliers are geographically constrained to that region. However, the company's overall scale-with total assets around \$4.54 million-suggests it is not a massive consumer of these local services, which typically keeps any single local supplier from gaining significant pricing power. Furthermore, the company has related-party obligations, such as an Advisory Agreement with Pillar based on Gross Asset Value, which is a form of internalizing some advisory functions.
The O&G management business relies on a single third party's supply chain. This is a critical structural point. New Concept Energy, Inc. (GBR) provides advisory and management services specifically for one independent oil and gas company. This means the entire O&G-related service revenue stream-which was \$45,000 in FY 2024-is dependent on the continuation of this single contract. While the third party is a client, the supply chain for the services New Concept Energy, Inc. (GBR) provides to that client is inherently tied to that one relationship. Any supplier critical to executing the O&G management contract is effectively insulated from competition from other New Concept Energy, Inc. (GBR) contracts, as there are none.
Here's a quick look at the expense structure that informs supplier negotiations:
| Expense/Revenue Category (USD) | FY 2024 | Q1 2025 | Q2 2025 |
|---|---|---|---|
| Real Estate Operating Expenses | 48,000 | N/A | N/A |
| Corporate General & Administrative Expenses | 335,000 | 89,000 | N/A |
| O&G Management Fee Revenue | 45,000 | 12,000 | 14,000 |
| Total Auditor Fees (2024) | 51,750 | N/A | N/A |
The reliance on a single client for the O&G segment means that the power dynamic shifts to the client itself, which in turn dictates the scale and type of specialized field services needed. For professional services, the auditor fees were \$51,750 in 2024, split between audit (\$48,000) and tax (\$3,750).
You should watch for any changes in the related-party payables, which stood at \$8 thousand due to related parties as of March 31, 2025.
- O&G management fee revenue was \$14,000 for Q2 2025.
- Rental revenue was \$26,000 for Q2 2025.
- Total assets were \$4,565 thousand (or \$4.565 million) as of March 31, 2025.
- The company has no long-term liabilities.
Finance: draft 13-week cash view by Friday.
New Concept Energy, Inc. (GBR) - Porter's Five Forces: Bargaining power of customers
You're analyzing New Concept Energy, Inc. (GBR) and the customer power dynamic is a key area to watch, especially given the company's dual, small-scale revenue streams. The power customers wield over New Concept Energy, Inc. (GBR) is segmented, with extreme power concentrated in one area and moderate power in the other.
For the Oil & Gas (O&G) management services segment, customer power is at its peak. This is driven by extreme customer concentration. For the three months ended September 30, 2025, the management fees component of revenue was $13,000 out of total revenue of $39,000. Since New Concept Energy, Inc. (GBR) provides management services for a single third-party oil and gas company, that one client effectively controls 100% of this specific revenue stream. If that client decides to walk, that $13,000 quarterly income disappears instantly.
The switching costs for this single O&G client appear low. The management agreement is structured such that New Concept Energy, Inc. (GBR) receives a management fee equal to 10% of oil and gas revenue. This fee-for-service model suggests the service is likely standardized, meaning the client could potentially internalize the function or hire another specialized firm with relative ease. The financial impact of this concentration is clear when you see the total revenue composition:
| Revenue Source (Q3 2025) | Amount (USD) | Percentage of Total Revenue |
|---|---|---|
| Management Fees (O&G) | $13,000 | 33.33% |
| Rental Revenue | $26,000 | 66.67% |
| Total Revenue | $39,000 | 100% |
Turning to the real estate segment, customer power is more balanced, landing in the moderate range. New Concept Energy, Inc. (GBR) owns approximately 190 acres of land in Parkersburg, West Virginia, which includes four structures totaling approximately 53,000 square feet. The power here stems from the nature of the asset itself, which is largely undifferentiated.
The real estate holdings are treated as a commodity by the market, which elevates customer leverage. Specifically, as of December 31, 2024, approximately 16,000 square feet of the main industrial/office building was leased. When you are leasing generic commercial space in a local market, substitutes are plentiful. The power of these rental customers is moderate because:
- The real estate is a commodity, meaning the physical space is not highly specialized.
- There are many local substitutes available for similar square footage in the West Virginia commercial property market.
- The annual rental revenue in 2024 was $101,000, which, while steady, is not large enough to give New Concept Energy, Inc. (GBR) significant pricing power against a determined tenant looking to negotiate renewal terms.
So, while the O&G client has the power to eliminate a third of a specific revenue stream, the rental customers have the power to pressure the pricing on the larger, more stable two-thirds of the business, though this power is tempered by the local market dynamics.
New Concept Energy, Inc. (GBR) - Porter's Five Forces: Competitive rivalry
You're looking at New Concept Energy, Inc. (GBR) and wondering how it stacks up against the giants. Honestly, the competitive rivalry force is almost entirely muted because the company operates on such a micro-scale, you can barely see it on the broader energy sector map.
The company's total revenue for the third quarter ended September 30, 2025, was just $39,000. That number alone tells you New Concept Energy, Inc. isn't fighting for market share in the massive, capital-intensive energy production space. It's a clear signal that it avoids direct, head-to-head competition with major players.
Here's a quick look at where that $39,000 came from in Q3 2025:
| Revenue Source | Q3 2025 Amount (USD) |
| Rental Revenue | $26,000 |
| Management Fees | $13,000 |
The rivalry is certainly higher, though, in the local Parkersburg, WV industrial real estate market. New Concept Energy, Inc. owns approximately 190 acres of land there, including four structures totaling about 53,000 square feet. That local market has its own set of competitors for tenants and property utilization.
When you look at the balance sheet as of September 30, 2025, the scale becomes even clearer. New Concept Energy, Inc. has no significant market share to defend against larger, defintely more capitalized firms. It simply doesn't have the scale to be noticed by them.
Consider these key financial metrics from the latest report:
- Total Assets: $4.54 million
- Total Shareholder Equity: $4.48 million
- Total Liabilities: $63,000
- Cash and Cash Equivalents: $307,000
- Q3 2025 Net Loss: ($20,000)
The rivalry force is low because the company's operational footprint is primarily asset-holding and fee-based management, not large-scale energy sales where rivalry is fierce. Its Q3 2025 revenue of $39,000 is dwarfed by its own Q3 2025 General & Administrative Expenses of $88,000.
Finance: draft a comparison of Q3 2025 G&A to Q3 2024 G&A by Monday.
New Concept Energy, Inc. (GBR) - Porter's Five Forces: Threat of substitutes
When we look at New Concept Energy, Inc. (GBR)'s business model, the threat of substitutes is quite pronounced because the company operates in two distinct, service-oriented areas where alternatives are readily available. You have to remember that New Concept Energy, Inc. (GBR) is not selling a unique, proprietary product; it's providing management services and leasing physical space.
Consider the management services side. New Concept Energy, Inc. (GBR) provides advisory and management services for an independent oil and gas company. In the third quarter of 2025, management fees accounted for $13,000 of the total $39,000 in revenue. This is a significant portion of their operational income. If that single O&G client decides that an in-house team or a different specialized consultancy can perform the advisory and management functions more effectively or at a lower cost, substitution is a real, near-term risk. The barrier to switching for the client is likely the administrative hassle, not a proprietary technology lock-in.
The other, larger component of their revenue stream is even more exposed. The company's primary revenue source is rental income, which totaled $26,000 in Q3 2025. That figure represents 66.67% of the $39,000 total revenue for the quarter, making it the core of their current operations. Rental income is, by its very nature, a highly substitutable asset. If a tenant is leasing space, they are primarily looking for square footage, location, and price; they are not typically locked into a unique service provided by New Concept Energy, Inc. (GBR) itself.
Here's the quick math on that revenue split for Q3 2025, which clearly shows where the substitution risk is concentrated:
| Revenue Stream | Q3 2025 Amount (USD) | Percentage of Total Revenue |
|---|---|---|
| Rental Income | $26,000 | 66.67% |
| Management Fees | $13,000 | 33.33% |
| Total Revenue | $39,000 | 100.00% |
This concentration in rental income means that commercial tenants leasing New Concept Energy, Inc. (GBR)'s property-land located in Parkersburg, West Virginia-can easily substitute that space. They can look at other local industrial spaces, perhaps those owned by larger, more diversified real estate operators, or even alternative energy-related sites in the Appalachian Basin or Utica Basin areas where New Concept Energy, Inc. (GBR) has its oil and gas interests. If a competitor offers a lower lease rate or superior infrastructure, the tenant has a clear, actionable alternative.
The threat of substitutes manifests through several key channels for New Concept Energy, Inc. (GBR):
- Management service client can switch providers easily.
- Rental income is the main revenue driver at $26,000.
- Industrial property is replaceable by local competitors.
- The business model relies on assets that are not proprietary.
- Management fees are only $13,000 of the total.
Honestly, for a company this small, any single client loss from either segment-the O&G management or the property rental-would have a material impact on the $39,000 quarterly top line. Finance: draft a sensitivity analysis on a 25% loss of rental revenue by Friday.
New Concept Energy, Inc. (GBR) - Porter's Five Forces: Threat of new entrants
You're looking at the barriers for someone else to jump into the business New Concept Energy, Inc. (GBR) is in. Honestly, for the specific niche they occupy, the hurdles aren't that high, which is a risk factor to keep in mind.
The threat of new entrants is amplified because the core services don't require massive, specialized infrastructure. New Concept Energy, Inc. operates in two main areas: real estate rental and third-party oil and gas management services. The management service side, where they earn a fee based on oil and gas revenue, is particularly accessible.
Consider the scale of the existing operation. For the full year 2024, total revenue was relatively small, composed of:
- Rental Revenue: $101,000
- Management Fee Revenue: $45,000
This low revenue base suggests that a new entrant could potentially carve out a similar small-scale operation without needing to match the scale of a major player. The barrier to entry for a third-party, small-scale O&G management service is therefore very low.
When it comes to the real estate component, which includes owning 191 acres of land with four structures totaling approximately 53,000 square feet in Parkersburg, West Virginia, the capital barrier for a new entrant to acquire similar small-scale real estate is also low. The company's total assets stood at $4.54M as of December 31, 2024. Acquiring a comparable, smaller parcel of income-producing real estate is certainly achievable for a well-funded new entity.
There is no indication that New Concept Energy, Inc.'s business model is protected by significant intellectual property. The services offered-real estate leasing and management fee-based O&G administration-are standard industry practices. You won't find proprietary technology or patents locking down their operations; the business relies on asset ownership and contractual agreements, not unique, defensible technology.
Still, the company's current financial performance acts as a deterrent, even if the structural barriers are low. New Concept Energy, Inc.'s small size and recent performance make it an unattractive target for most serious new entrants looking for immediate, substantial returns. Here's the quick math on why:
| Financial Metric (As of Dec 31, 2024) | Amount (USD) | Source Reference |
| Full Year 2024 Net Loss | ($18,000) | |
| Total Assets | $4,540,000 | |
| Total Liabilities | $63,000 | |
| Total Shareholder Equity | $4,480,000 | |
| Debt to Equity Ratio | 0% | |
| Cash and Cash Equivalents | $363,000 |
What this estimate hides is the recent operational trend. For instance, the net loss from continuing operations in Q1 2025 was ($20,000), and in Q2 2025 it was ($18,000). A consistent, albeit small, loss profile signals operational challenges that might dissuade a competitor focused on immediate profitability.
The low profitability, evidenced by the ($18,000) net loss in 2024, combined with the minimal scale of revenue-for example, Q3 2025 revenue was only $39,000-suggests that any new entrant would have to build market share from scratch against a company that is already struggling to achieve a profit, which isn't an appealing entry point for many. Finance: draft 13-week cash view by Friday.
Disclaimer
All information, articles, and product details provided on this website are for general informational and educational purposes only. We do not claim any ownership over, nor do we intend to infringe upon, any trademarks, copyrights, logos, brand names, or other intellectual property mentioned or depicted on this site. Such intellectual property remains the property of its respective owners, and any references here are made solely for identification or informational purposes, without implying any affiliation, endorsement, or partnership.
We make no representations or warranties, express or implied, regarding the accuracy, completeness, or suitability of any content or products presented. Nothing on this website should be construed as legal, tax, investment, financial, medical, or other professional advice. In addition, no part of this site—including articles or product references—constitutes a solicitation, recommendation, endorsement, advertisement, or offer to buy or sell any securities, franchises, or other financial instruments, particularly in jurisdictions where such activity would be unlawful.
All content is of a general nature and may not address the specific circumstances of any individual or entity. It is not a substitute for professional advice or services. Any actions you take based on the information provided here are strictly at your own risk. You accept full responsibility for any decisions or outcomes arising from your use of this website and agree to release us from any liability in connection with your use of, or reliance upon, the content or products found herein.