
|
Gerdau S.A. (GGB): PESTLE Analysis [Nov-2025 Updated] |
Fully Editable: Tailor To Your Needs In Excel Or Sheets
Professional Design: Trusted, Industry-Standard Templates
Investor-Approved Valuation Models
MAC/PC Compatible, Fully Unlocked
No Expertise Is Needed; Easy To Follow
Gerdau S.A. (GGB) Bundle
You're looking for a clear, no-nonsense breakdown of the forces shaping Gerdau S.A. (GGB) right now, and honestly, the picture is a tale of two markets: a robust North America offsetting a challenging Brazil. The company's Q3 2025 Adjusted EBITDA of R$2.7 billion shows resilience, but the record 26% steel import penetration in Brazil is a huge headwind they're fighting politically. Their near-term focus is defintely on leveraging the 25% US import tariffs that bolstered North American revenue to $3.2 billion in Q3 2025, plus they're pouring R$6 billion into digitalization and their cleaner, scrap-based Electric Arc Furnace (EAF) technology. It's a tightrope walk between trade defense and a green tech advantage, and we need to see how the PESTLE factors map out this strategy.
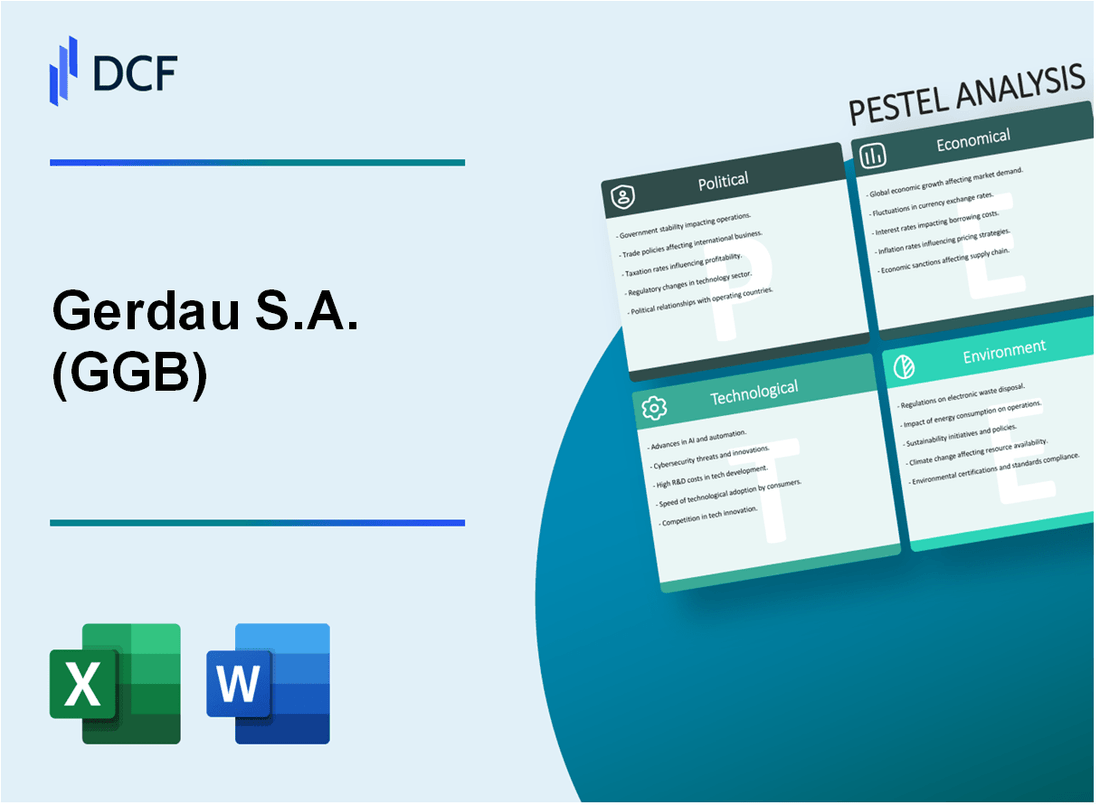
Gerdau S.A. (GGB) - PESTLE Analysis: Political factors
Brazilian government urged for stronger trade defense against imports
The political pressure from domestic steelmakers on the Brazilian government to curb cheap imports is intense and has become a central issue for Gerdau's South American profitability. In 2025, the government responded by renewing and expanding its tariff-rate quota system. This mechanism applies a standard tariff, typically between 9% and 16%, up to a certain volume, but slaps a substantial 25% safeguard duty on imports that exceed the established quota. This is a defensive move, but honestly, it hasn't been enough.
The import penetration rate in Brazil's domestic market hit a critical 26.0% in the second quarter of 2025, which is a jump of 3.9 percentage points from the prior year. This record level of foreign steel, largely from China, is crushing domestic pricing and margins. Gerdau's management has defintely been vocal, calling for a simpler, higher duty-some industry representatives are pushing for a 25% duty on all steel imports to truly stabilize the market.
- Imports rose 21% in April 2025 despite existing quotas.
- The tariff-quota system now covers 23 distinct steel product categories.
- Gerdau's Brazilian profitability dropped by 50.5% year-over-year in Q3 2025, largely due to import pressure.
US import tariffs of 25% continue to bolster North American revenues
For Gerdau, the US political landscape is a massive tailwind. While the previous Section 232 tariffs were 25%, the political environment shifted dramatically in 2025. The US government escalated its trade protectionism, raising the Section 232 tariffs on many steel and aluminum imports to a punitive 50% by mid-year, with Brazil's steel exports facing this higher rate by August 2025. This move, while politically charged, has effectively created a protected, high-margin market for domestic producers like Gerdau.
Here's the quick math: when foreign competition faces a 50% barrier, your domestic pricing power skyrockets. This is why Gerdau's North American operations have become the engine of its consolidated earnings. The segment's contribution to consolidated adjusted EBITDA reached a historical high of 61.4% in Q1 2025, and North American revenue grew by a robust 11% in Q3 2025. The tariffs are a strategic gift.
Geopolitical nearshoring trends favor US domestic production capacity
The political push for supply chain security and domestic manufacturing, often called nearshoring, is directly translating into capital expenditure for Gerdau. The US government's focus on infrastructure and domestic sourcing has made North America a strategic imperative, not just a growth opportunity.
Gerdau is responding by accelerating its North American investments. A major part of its 2025 global capital expenditure plan is aimed at expanding capacity in the US. For example, the Phase 1 expansion at the Midlothian, Texas, mill is 85% physically complete as of Q3 2025. This project, which has a total expected disbursement of R$1.2 billion, will add 150,000 tonnes of annual melt shop capacity and is projected to generate roughly R$275 million in annual EBITDA once fully operational. The company's North American order backlog of around 70 days is well above the historical average of 60 days, confirming this strong domestic demand signal.
Political stability in Brazil remains a key factor impacting investor confidence
The political environment in Brazil remains a significant headwind, primarily due to fiscal instability. The expansive fiscal policies of the current administration, coupled with a challenging global backdrop, have rattled investor confidence. The country's debt-to-GDP ratio, which was 76.1% in 2024, is projected to rise to around 81% by the end of 2025.
This fiscal strain contributed to a sharp 27% depreciation of the Brazilian Real (BRL) in 2024. To counter inflationary pressures, the Central Bank is projected to maintain a hawkish stance, with the interest rate potentially reaching 15% by the end of 2025. This high-interest-rate environment suppresses domestic construction and consumption, which are key drivers for Gerdau's Brazilian segment. What this estimate hides is the political risk premium: the US even cited political tensions in Brazil as a factor when imposing the 50% tariff in July 2025, linking domestic Brazilian politics to international trade policy.
| Political Factor | Impact on Gerdau S.A. (GGB) | 2025 Key Metric (Q3 2025 Data) |
|---|---|---|
| US Section 232 Tariffs (50%) | Shields North American operations from foreign competition, boosting margins. | North America contributed 61.4% of consolidated adjusted EBITDA in Q1 2025. |
| Brazilian Trade Defense (25% Safeguard) | Mitigates import pressure but is insufficient to prevent record import penetration. | Import penetration reached 26.0% in Brazil in Q2 2025. |
| Nearshoring/Domestic Investment Push (US) | Justifies and supports significant capital reallocation to the US. | Midlothian, TX expansion (Phase 1) is 85% complete, with R$275 million expected annual EBITDA. |
| Brazilian Fiscal Instability | Creates currency volatility and high-interest rates, suppressing domestic steel demand. | Brazilian Real (BRL) depreciated 27% in 2024; debt-to-GDP projected near 81% in 2025. |
To be fair, the company is managing this regional disparity by strategically pivoting. Finance: monitor the US political climate for any shifts in the 50% tariff policy, as this is the single largest driver of current profitability.
Gerdau S.A. (GGB) - PESTLE Analysis: Economic factors
The economic landscape for Gerdau S.A. in 2025 is a classic tale of two markets: a strong, stabilizing North America offsetting a highly competitive, import-pressured Brazil. You need to focus on where the cash is coming from and where the capital is being deployed, because that's the real story.
Q3 2025 Adjusted EBITDA hit R$2.7 billion, showing a 7% quarterly rise.
Gerdau S.A.'s overall financial health remains solid, primarily driven by its geographical diversification. The company's Adjusted Earnings Before Interest, Taxes, Depreciation, and Amortization (EBITDA) for the third quarter of 2025 reached R$2.7 billion, marking a respectable 7% rise compared to the second quarter of 2025. This performance is a testament to operational efficiency, but it masks the underlying disparity between its core markets. Honestly, the North American division is carrying the weight, accounting for a record 65% of the consolidated EBITDA in Q3 2025. That's a massive concentration of earnings power.
North American revenue grew 11% year-over-year to $3.2 billion in Q3 2025.
The North American division is the clear economic engine. While the overall consolidated net sales for the company were R$18.0 billion in Q3 2025, the North American segment remains robust. Specifically, the North American net sales totaled R$9.185 billion (approximately US$1.7 billion) in Q3 2025. This segment's adjusted EBITDA saw a strong 11.3% increase year-over-year to R$1.820 billion (US$345.8 million), reflecting consistent demand in non-residential construction and renewable energy sectors, plus a decline in imports due to existing Section 232 steel tariffs. The resilience of the U.S. market is defintely a key buffer against Brazilian volatility.
Brazilian steel import penetration reached a record 26% in Q2 2025.
The domestic Brazilian market is facing a severe economic headwind due to a surge in cheap imported steel, primarily from China. This is the single biggest near-term risk. The penetration of imported steel into the Brazilian market has become a critical issue, averaging 25% in the first nine months of 2025. Some industry reports even cite import penetration reaching as high as 30% of domestic sales. This excessive influx depresses local prices and margins for domestic producers like Gerdau S.A., forcing them to focus on cost competitiveness and operational optimization to maintain profitability in their home market. The high benchmark interest rate (Selic) in Brazil, which stood at 15% in September 2025, further paralyzes investment in steel-intensive sectors like construction, compounding the weak domestic demand.
Total assets increased slightly to R$87.26 billion as of September 2025.
Gerdau S.A.'s balance sheet remains stable. As of September 30, 2025, the company's total consolidated assets stood at R$87.26 billion, a slight increase from R$86.81 billion at the end of 2024. This modest growth, coupled with a reduction in the Net Debt/EBITDA ratio to 0.81x in Q3 2025, shows a solid capital structure. The company is managing its debt load effectively, even announcing the early repayment of its US$500 million 2030 Bond, scheduled for December 2, 2025. Here's the quick math: low leverage gives them dry powder for strategic moves or weathering a downturn.
| Key Financial Metric (Q3 2025) | Amount/Value | Context/Comparison |
|---|---|---|
| Adjusted EBITDA (Consolidated) | R$2.7 billion | Up 7% from Q2 2025 |
| Total Assets (Sep 2025) | R$87.26 billion | Slight increase from R$86.81 billion (Dec 2024) |
| North America EBITDA Share | 65% | Record share of consolidated EBITDA |
| Brazilian Import Penetration (9M 2025 Avg) | 25% | Highest quarterly figures reached 30% |
| Net Debt/EBITDA Ratio (Q3 2025) | 0.81x | Reflects strong balance sheet |
2025 CapEx guidance was reduced to R$5.8 billion for strategic focus.
Capital expenditure (CapEx) is a clear signal of management's forward-looking economic outlook. Gerdau S.A. revised its 2025 CapEx guidance downward from an earlier forecast of R$6.3 billion to R$5.8 billion. This reduction reflects a strategic focus on optimizing existing assets and a more cautious approach to new investments in certain regions, particularly in Brazil, due to the weak local demand caused by imports. The company is prioritizing high-return projects, such as the Miguel Burnier mining project, which is expected to deliver significant EBITDA gains upon full ramp-up. The planned CapEx for 2026 is even lower at R$4.7 billion, a 22% reduction from the 2025 forecast, which underscores a continued commitment to capital discipline.
- Investments in Q3 2025 totaled R$1.7 billion.
- 60% of Q3 CapEx was allocated to enhancing asset competitiveness.
- The 2026 CapEx guidance of R$4.7 billion is a clear move toward capital efficiency.
Finance: Track the North American EBITDA margin closely, as it's the primary source of cash flow supporting the entire enterprise.
Gerdau S.A. (GGB) - PESTLE Analysis: Social factors
You're looking at Gerdau S.A.'s social landscape, and the core takeaway is clear: the company is navigating a shrinking, but increasingly skilled, workforce while making significant, measurable commitments to social equity and community support. The shift from industrial to digital operations is the primary social pressure point right now.
Operations support over 10,000 jobs across key operating regions
Gerdau's global operations are a major employment driver, supporting a substantial workforce across the Americas and other key operating regions. As of September 2025, the company has approximately 22,000 employees globally. This is a slight contraction from the 25,557 employees reported at the end of the 2024 fiscal year, reflecting ongoing operational efficiency and automation efforts. Still, the company is actively creating new, long-term jobs through strategic capital expenditure (CAPEX) projects.
For example, the new sustainable mining platform in Minas Gerais, Brazil, is expected to generate over 5,000 jobs during its implementation phase alone, demonstrating a direct socioeconomic impact in local communities. This dual trend-efficiency-driven workforce reduction in some areas and new job creation in high-tech, sustainable projects-is a key social dynamic.
Community investment of approximately $50 million was made in 2024
Gerdau's commitment to its operating communities is substantial, focusing on immediate relief and long-term development. In 2024, the company made a significant, specific donation of R$ 51.4 million (approximately $9.53 million, using the 2024 average exchange rate of 5.3937 BRL/USD) for reconstruction projects in regions impacted by a natural disaster. The Helda Gerdau Institute, an associated entity, contributed an additional R$ 20 million.
Here's the quick math: that's a direct corporate and affiliated contribution of over R$ 71 million in a single year to support housing, infrastructure, and entrepreneurship. This kind of targeted, non-CAPEX social investment builds crucial social capital, which you defintely need when operating large industrial facilities.
Strategic pillar focuses on Diversity, Equity, and Inclusion (DE&I) progress
Diversity, Equity, and Inclusion (DE&I) is a formal strategic pillar, not just a human resources footnote. The company has set clear, quantifiable targets for 2025, which are tied directly to senior executive compensation-a strong governance signal. Around 20% of the long-term bonus for senior management is conditioned on meeting these ESG targets, including the percentage of women in leadership positions.
The company is making steady progress toward its 2025 goals, as detailed below:
| DE&I Metric | Target by 2025 | Achieved in 2023 | Progress to Target |
|---|---|---|---|
| Women in Leadership Positions (Global) | 30% | 26.1% | 3.9 percentage points remaining |
| Black People in Leadership Positions (Brazil) | 30% | 27.6% | 2.4 percentage points remaining |
| People with Disabilities (PwD) in Workforce (Brazil) | 5% | N/A (Target set) | Ongoing recruitment focus |
They are within striking distance of their two main leadership targets, which shows the incentive structure is working. This focus on inclusion is critical for attracting talent in competitive markets like the U.S. and Canada.
Labor market trends impact skilled workforce availability for digital transformation
The steel industry's shift toward Industry 4.0-integrating technologies like Artificial Intelligence (AI) and automation-is creating a significant skills gap. Labor market trends for 2025 show that 86% of employers globally expect AI and information processing technologies to transform their business by 2030. For a heavy industry like steel, this means the demand for traditional operational roles is declining, while the need for specialized technical skills is soaring.
This is a major risk: the company needs to reskill its existing workforce and compete for a small pool of new talent. Gerdau is addressing this through its innovation arm, Gerdau Next, which focuses on strategic clusters like technology. The immediate actions required are massive upskilling programs to prevent a bottleneck in digital adoption. Automation will displace an estimated 85 million jobs globally by 2025, but it simultaneously creates 97 million new roles in areas like data analysis and machine learning. Gerdau must capture those new roles internally.
- Prioritize reskilling for automation-resistant roles.
- Recruit AI specialists and data analysts aggressively.
- Integrate digital literacy into all operational training.
Gerdau S.A. (GGB) - PESTLE Analysis: Technological factors
Gerdau's technological strategy is defintely a core competitive advantage, centering on a high-efficiency, low-carbon production model and aggressive digitalization. The company is mapping its near-term future with a major investment cycle that focuses on Industry 4.0 concepts like Artificial Intelligence (AI) and advanced connectivity, which is a clear action to mitigate future operational risks and seize efficiency gains.
R$6 billion investment cycle (2025-2027) targets digitalization and AI.
You need to see the technology spend as a strategic pivot, not just maintenance. Gerdau announced a new investment cycle of R$6 billion in February 2024, with a significant portion of the execution scheduled for the 2025 fiscal year. This capital is not just for keeping the lights on; it is specifically earmarked for asset maintenance, expansion of energy efficiency, and critically, the digitalization of operations and the application of artificial intelligence (AI) across its plants in Brazil and the United States.
Here's the quick math: a chunk of this R$6 billion is funding the shift to a smarter, more automated production chain. This investment is designed to drive operational efficiency, which is a non-negotiable in a cyclical industry like steel.
Expansion of dedicated 4G and 5G networks at the Ouro Branco plant.
The foundation for this AI and digitalization push is connectivity. Gerdau completed the implementation of a private, dedicated 4G and 5G network at its massive Ouro Branco plant in Minas Gerais in 2024, making it a pioneer as the first company to have a large-scale private network in the Latin American steel sector. This is a big deal.
The combined capacity of this private network now reaches 4.8 Gbps, which is the pipe needed to run real-time data analytics, remote-controlled vehicles, and digital twins (virtual models of physical assets). This high-speed, secure network allows for the deployment of thousands of Internet of Things (IoT) sensors, translating raw operational data into actionable insights for production planning and predictive maintenance.
High reliance on Electric Arc Furnace (EAF) technology for scrap-based production.
Gerdau's core technology is its Electric Arc Furnace (EAF) model, which is fundamentally a cleaner, more flexible, and more sustainable way to make steel than the traditional blast furnace route. This is a crucial technological differentiator in the 2025 market, where environmental, social, and governance (ESG) metrics are paramount.
The company reports that 71% of the steel it produces already comes from recycled material (scrap), a rate significantly above the global average. To secure this low-carbon feedstock, Gerdau invested US$60 million in November 2024 to acquire Dale's Recycling, adding five units in Tennessee and one in Kentucky to reinforce the scrap supply chain for its North American EAF mills.
What this EAF reliance hides is the risk of scrap price volatility, but the technological advantage of lower carbon emissions is a clear long-term opportunity.
| Technological Metric | 2025 Fiscal Year Data / Status |
|---|---|
| Total Investment Cycle (R$) | R$6 billion (Execution in 2025, announced Feb 2024) |
| Scrap-Based Steel Production Share | 71% (From recycled material) |
| New HRC Line Investment (R$) | R$1.5 billion (Ouro Branco, commissioned March 2025) |
| Ouro Branco Private Network Capacity | 4.8 Gbps (Combined 4G/5G) |
| Scrap Chain Acquisition (US$) | US$60 million (Dale's Recycling, Nov 2024) |
New hot-rolled coil (HRC) line commissioned in Brazil in March 2025.
A concrete example of the capital expenditure (CapEx) is the new hot-rolled coil (HRC) production line commissioned in March 2025 at the Ouro Branco plant in Minas Gerais. This investment amounted to approximately R$1.5 billion (or $260 million).
This expansion increases the plant's HRC annual capacity by 250,000 tons, bringing the total HRC production capacity at the site to 1.1 million tons per year. This capacity is primarily aimed at supplying the high-specification steel needs of the automotive industry and machinery and equipment manufacturers in Brazil, a clear move to capture higher-value market segments.
- Commissioned new HRC line in March 2025.
- Increased HRC capacity by 250,000 tons annually.
- Total HRC capacity now 1.1 million tons per year.
Gerdau S.A. (GGB) - PESTLE Analysis: Legal factors
Company calls for urgent government action on anti-dumping claims.
You can't talk about the steel industry's legal landscape without starting with trade defense. Gerdau is fighting a two-front war against cheap imports. In its home market of Brazil, the company is pushing hard for the government to take immediate, effective action against what it calls unfair competition, mainly from Asian imports. The import penetration rate in Brazil hit a critical high of 26.0% in Q2 2025, which is putting immense pressure on domestic pricing and margins.
Honestly, the government's response has been slow, citing inflationary risks for other industrial sectors. So, Gerdau's management is skeptical that broad measures like a short-term import tax increase to 25% will be applied quickly. This forced the company to take legal control: it is preparing an anti-dumping investigation request against Chinese and other Asian long and flat steel importers. A specific decision on such a claim takes an average of 18 months, which is defintely a long time to wait for relief.
In the U.S., the company is part of a collective effort, the Rebar Trade Action Coalition (RTAC), seeking the imposition of anti-dumping (AD) and countervailing duties (CVD) on rebar imports from countries like Algeria, Bulgaria, Egypt, and Vietnam. The trade case investigations began in June, with preliminary AD/CVD rates expected to be set in November 2025.
US trade policies, like Section 232 tariffs, directly affect North American margins.
The U.S. trade policy environment has been a massive legal tailwind for Gerdau's North American operations, but it creates a complex geopolitical risk. By April and June 2025, U.S. Section 232 tariffs on steel and aluminum imports for many countries were lifted to 50%, effectively shielding domestic producers. This is a huge advantage.
The tariffs directly translated into financial performance. In Q1 and Q2 2025, Gerdau's U.S. and Canadian operations contributed a historic high of 61.4% of its consolidated adjusted EBITDA. That's the engine of the company's profitability right now. The disparity is stark; while U.S. steel prices have risen, Brazilian steel prices fell by 8% year-to-date in 2025. This legal protection in North America is why the company has funneled BRL 1.6 billion in capital expenditures into the region in 2025.
Environmental regulations (like carbon pricing) are tightening globally.
The legal risk around climate change is rapidly shifting from voluntary commitments to mandatory financial liabilities. The European Union's Carbon Border Adjustment Mechanism (CBAM) is the most immediate legal threat to Gerdau's export strategy, especially for products shipped from Brazil.
Here's the quick math: a survey indicates that CBAM will add a tariff of 10.76% for every dollar in iron and steel products shipped from Brazil to the EU. While the financial charge is scheduled for January 1, 2026, the obligation is accumulating now. To mitigate this, Gerdau is accelerating its green steel projects and relying on its North American operations, where all units use scrap-based electric arc furnace technology, a route exempt from CBAM.
Gerdau's legal and strategic response is clear:
- Reduce GHG emissions to 0.82 t/CO2e per tonne of steel by 2031.
- Invest BRL 3.2 billion by 2026 in low-carbon technology in Brazil.
- Monitor the potential impact of a mandatory carbon pricing system currently being analyzed in Brazil.
Compliance risk rises with operations spanning multiple jurisdictions (Brazil, US, etc.).
Operating across multiple jurisdictions-Brazil, the U.S., Canada, and other South American countries-means Gerdau is subject to a complex and overlapping web of anti-corruption, antitrust, and environmental laws. Non-compliance risks include fines, criminal penalties, and prohibitions on participating in public biddings.
Key legal frameworks creating compliance risk include the U.S. Foreign Corrupt Practices Act (FCPA) and the Brazilian Anti-Corruption Law (Law 12,846/2013). Moreover, new air quality and atmospheric emissions regulations in Brazil became effective in 2025, requiring changes in management, monitoring, and reporting practices. To address this, Gerdau has recently updated several critical internal legal documents.
The following table shows the recent updates to key legal and compliance policies in 2025:
| Policy | Last Update Date | Jurisdictional Relevance |
|---|---|---|
| Compliance Policy | April 3, 2025 | Global (Brazil, US, Canada, etc.) |
| Anti-Corruption Policy | April 3, 2025 | Global (FCPA, Brazilian Law 12,846/2013) |
| Tax Policy | April 3, 2025 | Global |
| Bylaws | May 30, 2025 | Brazil (Primary Listing) |
This level of policy overhaul shows the company is taking the rising complexity of cross-border legal risk seriously. You have to. One clean compliance breach can wipe out months of margin gains.
Gerdau S.A. (GGB) - PESTLE Analysis: Environmental factors
Goal to achieve carbon neutrality for operations by 2050
You're looking at a steel company, so the first thing you need to assess is their decarbonization roadmap. Gerdau S.A. has a clear, long-term commitment to achieve carbon neutrality for its entire operations by the year 2050. This isn't just a distant promise; it drives their capital expenditure (CAPEX) decisions right now.
This goal is particularly significant because steel production is historically one of the most carbon-intensive industries. The company's strategy leans heavily on its existing low-carbon production model-Electric Arc Furnaces (EAFs)-and massive investments in renewable energy to offset the remaining emissions.
Target to reduce greenhouse gas emissions to 0.82 t/CO2e per tonne by 2031
The near-term, actionable target is what matters most to an analyst, and Gerdau S.A. has a precise one. They aim to reduce their greenhouse gas (GHG) emissions intensity to 0.82 t/CO2e per tonne of steel produced by 2031. Here's the quick math on their current position:
The company's current average GHG emission intensity is already low for the global sector, sitting around 0.91 tCO2e/tons of steel produced. This is a competitive advantage they are working to expand. Hitting the 2031 target means a further reduction of over 9% from the current level, which defintely requires continuous technological upgrades and energy matrix diversification.
| Metric | Current Value (Approx. 2025) | Target | Target Date |
|---|---|---|---|
| GHG Emissions Intensity | 0.91 tCO2e/tons of steel | 0.82 t/CO2e/tons of steel | 2031 |
| Carbon Footprint Goal | Low for global industry average | Carbon Neutrality | 2050 |
Largest scrap recycler in Latin America; 70% of steel is scrap-based
Gerdau S.A.'s core business model is a major environmental differentiator. They are the largest recycler of ferrous scrap in Latin America, which is a powerful structural advantage in the market. Recycling scrap metal requires significantly less energy and produces far fewer emissions than using virgin iron ore.
Currently, 71% of the steel the company produces uses scrap metal as its main raw material. This high percentage of scrap-based steel production is the primary reason their GHG emissions intensity is already below the global industry average. They remove obsolete materials from cities, which is a key circular economy benefit, plus they save on raw material costs, which helps the bottom line.
Their commitment to the circular economy extends beyond scrap, too:
- Achieve a water recirculation rate of 97.6% in operations.
- Maintain a forestry base of over 254,000 hectares in Minas Gerais, Brazil.
- Designate 91,000 hectares of this base for biodiversity conservation.
- Commit to expanding the forestry base by 20% over the next five years.
R$1.5 billion clean energy push for solar and biomass projects
The company is putting serious money behind its environmental goals. A cornerstone of their current strategy is a R$1.5 billion clean energy push. This investment is specifically targeting a shift in their energy matrix, moving away from fossil fuels and toward renewable sources.
These investments include solar parks, biomass-powered facilities, and the continued use of Electric Arc Furnaces (EAFs), which are inherently less carbon-intensive. For the 2025 fiscal year alone, approximately R$1.6 billion of their total revised CAPEX of R$5.8 billion is earmarked for projects that deliver environmental returns, which includes the expansion of their forest assets and improvements to environmental controls. That's a significant portion of their capital budget focused on sustainability.
What this estimate hides is the long-term operational savings. By generating their own renewable power, they are hedging against volatile energy prices, securing a competitive cost structure for decades to come. It's a smart financial move disguised as an environmental one.
Disclaimer
All information, articles, and product details provided on this website are for general informational and educational purposes only. We do not claim any ownership over, nor do we intend to infringe upon, any trademarks, copyrights, logos, brand names, or other intellectual property mentioned or depicted on this site. Such intellectual property remains the property of its respective owners, and any references here are made solely for identification or informational purposes, without implying any affiliation, endorsement, or partnership.
We make no representations or warranties, express or implied, regarding the accuracy, completeness, or suitability of any content or products presented. Nothing on this website should be construed as legal, tax, investment, financial, medical, or other professional advice. In addition, no part of this site—including articles or product references—constitutes a solicitation, recommendation, endorsement, advertisement, or offer to buy or sell any securities, franchises, or other financial instruments, particularly in jurisdictions where such activity would be unlawful.
All content is of a general nature and may not address the specific circumstances of any individual or entity. It is not a substitute for professional advice or services. Any actions you take based on the information provided here are strictly at your own risk. You accept full responsibility for any decisions or outcomes arising from your use of this website and agree to release us from any liability in connection with your use of, or reliance upon, the content or products found herein.