
|
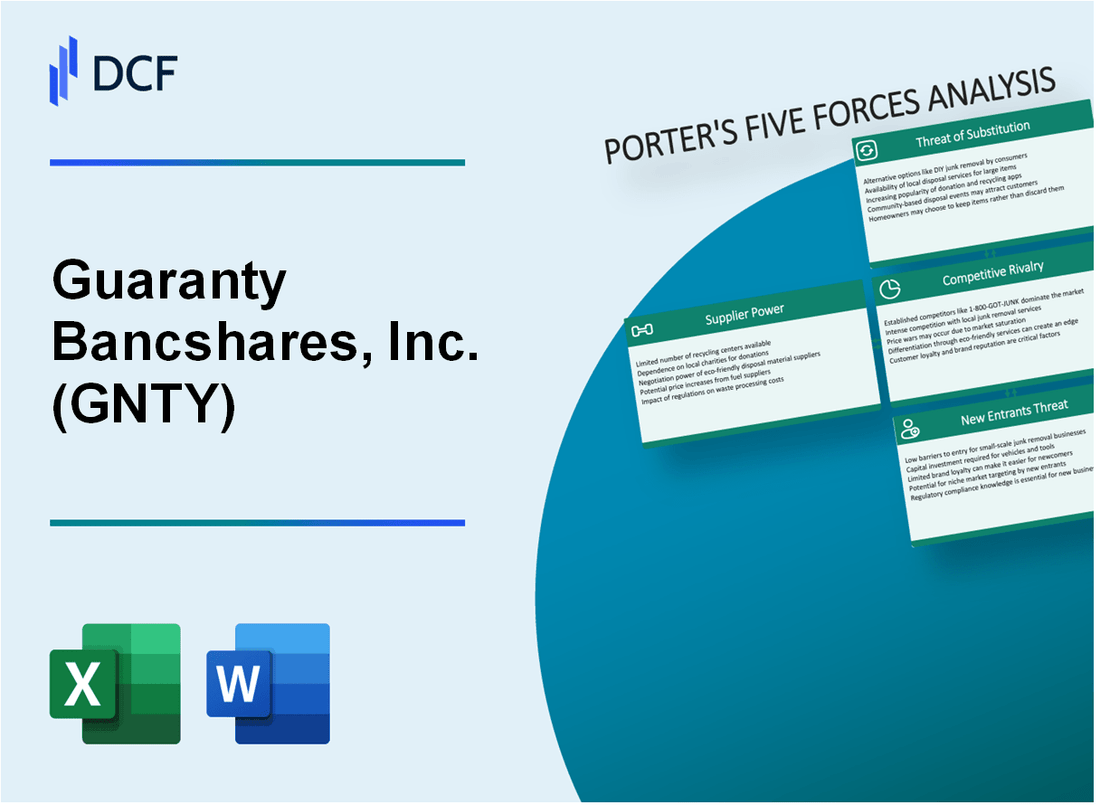
Guaranty Bancshares, Inc. (GNTY): 5 FORCES Analysis [Nov-2025 Updated] |
Fully Editable: Tailor To Your Needs In Excel Or Sheets
Professional Design: Trusted, Industry-Standard Templates
Investor-Approved Valuation Models
MAC/PC Compatible, Fully Unlocked
No Expertise Is Needed; Easy To Follow
Guaranty Bancshares, Inc. (GNTY) Bundle
You're looking at Guaranty Bancshares, Inc. right now, trying to figure out if its Texas community bank model can outrun the rising tide of competition, and honestly, the landscape is intense as of late 2025. We see core deposit funding costs climbing while rivalry heats up against bigger players in that booming Texas market-a place where the bank's 3.70% Net Interest Margin (Q2 2025) is constantly under pressure from both customers demanding better rates and FinTech substitutes chipping away at transaction business. With 27.0% of deposits uninsured (June 30, 2025) and suppliers like core processors holding significant power due to high switching costs, understanding the exact pressure points is crucial for your next move. Below, I break down exactly how Michael Porter's Five Forces map onto Guaranty Bancshares, Inc.'s current risk and reward profile, giving you the clear picture you need.
Guaranty Bancshares, Inc. (GNTY) - Porter's Five Forces: Bargaining power of suppliers
You're analyzing the supplier side of Guaranty Bancshares, Inc. (GNTY)'s business, and honestly, the power held by key resource providers is a significant factor in managing profitability and operational resilience. We need to look at where the money goes for deposits, technology, and people.
Core Deposit Funding Costs
Intense deposit competition puts direct pressure on the cost of funds, which is essentially the price Guaranty Bancshares, Inc. (GNTY) pays its primary funding suppliers-its depositors. While management reported that the cost of interest-bearing deposits actually fell to 2.83% in the first quarter of 2025 from 3.07% the prior quarter, this dip doesn't negate the underlying competitive tension. The overall net interest margin (NIM) for Guaranty Bancshares, Inc. (GNTY) improved to 3.70% in Q1 2025, up from 3.16% a year prior, showing some success in asset/liability management, but the market for deposits remains fierce. As of December 31, 2024, total deposits stood at $2.7 billion, meaning even small basis point changes in funding costs have a material impact on the bottom line. For context, in Q2 2025, total deposits reached $2.71 billion. The pressure from depositors demanding higher rates to keep pace with market alternatives is a constant supplier negotiation.
Technology and Core Processing Vendors
Technology vendors, especially those providing core processing and essential infrastructure, wield considerable power over Guaranty Bancshares, Inc. (GNTY). This power stems largely from the massive hurdle of switching systems. Many regional banks, including Guaranty Bancshares, Inc. (GNTY), still operate on legacy core banking systems, and modernization projects can easily require 18-36 months for completion. Furthermore, the non-negotiable need for 24/7 cybersecurity defense means that reliance on these specialized vendors for uptime and security patching is absolute. Any disruption or price hike from these suppliers directly impacts the bank's ability to operate and maintain customer trust. The financial services industry saw the average cost of a data breach rise to $6.08 million in 2024, underscoring the high stakes involved with vendor performance.
Specialized FinTech Implementation Costs
The push for efficiency and better customer experience forces Guaranty Bancshares, Inc. (GNTY) to adopt new technologies, which introduces another powerful supplier group: specialized FinTech firms. These vendors, offering solutions for things like Artificial Intelligence (AI) integration and real-time fraud detection, command premium pricing for their specialized, often proprietary, platforms. While these tools can reduce future breach costs-AI-driven security can save an average of $2.22 million per breach according to IBM data-the initial implementation and licensing costs are substantial. For community banks generally, technology expenses already account for 8-12% of non-interest expenses, and these cutting-edge FinTech integrations add a new layer of necessary, high-cost procurement.
Highly Skilled Labor Compensation
The talent market acts as a supplier of essential human capital, and for Guaranty Bancshares, Inc. (GNTY), the most powerful segment is specialized technical labor. The demand for experts in cybersecurity and data analytics is driving compensation upward significantly. For example, the average salary for a Cybersecurity Analyst in banking is reported around $120,000 per year, with Risk Managers earning about $123,000 annually. This is a tight market; 39% of banking leaders cited retaining top talent as their primary hiring challenge in 2025. You can see this pressure reflected in Guaranty Bancshares, Inc. (GNTY)'s own results, as the efficiency ratio slightly deteriorated to 66.78% in Q1 2025, which management attributed in part to increased employee compensation. The bank needs these skills, and the market dictates the premium price. Here's the quick math on the talent cost pressure:
| Supplier Category | Metric/Role | Associated Cost/Value | GNTY Context/Benchmark (2025 Data) |
|---|---|---|---|
| Funding (Deposits) | Cost of Interest-Bearing Deposits (Q1 2025) | 2.83% | Down from 3.07% previous quarter, but competition remains high. |
| Technology (General) | Technology Expenses (% of Non-Interest Expenses) | 8-12% | Industry benchmark for community banks. |
| Technology (Cybersecurity) | Average Cost of Data Breach (2024) | $6.08 million | Drives need for 24/7 vendor support and high-cost solutions. |
| Labor (Cybersecurity Analyst) | Average Annual Salary | $120,000 | High demand role driving up compensation costs. |
| Labor (Risk Manager) | Average Annual Salary | $123,000 | High demand role driving up compensation costs. |
| Labor (Talent Retention Challenge) | Banking Leaders Citing Retention as Primary Challenge (2025) | 39% | Indicates intense competition for skilled personnel. |
The reliance on these specific suppliers-be it for deposits, core software, or specialized analysts-means Guaranty Bancshares, Inc. (GNTY) has limited leverage in price negotiations. The need for 24/7 operational integrity and the high cost of failure (like a data breach) solidify the supplier's position. What this estimate hides is the specific contract terms for GNTY's core processor, but the industry trend toward high switching costs is definitely in play.
- Core system replacement time: 18-36 months for modernization projects.
- AI/Automation breach savings potential: $2.22 million per incident.
- Q1 2025 Non-interest-bearing deposits percentage: 31.3% of total deposits.
- Q2 2025 Return on Average Assets (ROA): 1.28%.
- Q2 2025 Return on Average Equity (ROE): 12.19%.
Finance: draft Q3 2025 supplier cost variance analysis by Friday.
Guaranty Bancshares, Inc. (GNTY) - Porter's Five Forces: Bargaining power of customers
You're analyzing the customer power for Guaranty Bancshares, Inc. (GNTY) right as it completes its transition into Glacier Bancorp, Inc. in late 2025. Understanding this force is key because, in Texas, customers have plenty of places to take their business.
The bargaining power of customers is definitely elevated by the sheer number of options available in the Texas market. Guaranty Bank & Trust, N.A., before the merger, operated in a crowded space. As of the end of 2024, Texas had 212 state-chartered banks, and even within specific metro areas like DFW, businesses face a choice of more than 150 financial institutions for loans and deposits. Plus, Texas historically leads the nation in community bank presence, with around 370 such institutions as of 2024.
For basic banking services, like standard checking or simple term loans, the cost for a customer to switch away from Guaranty Bancshares, Inc. was low. When the value proposition is similar across many providers, customers gain leverage to push for better pricing. This is a constant pressure point for regional banks like Guaranty Bancshares, Inc. was.
However, the customer base itself provides a counterbalance to this power. Guaranty Bancshares, Inc. maintained a granular deposit base, which is a real strength in limiting single-customer influence. As of June 30, 2025, the bank reported 91,436 total deposit accounts, resulting in a relatively small average account balance of $29,622. This structure means no single depositor holds an outsized portion of the funding base, which helps stabilize funding costs.
To be fair, the largest commercial borrowers and depositors absolutely retain significant power. These clients can negotiate rates and terms directly, which immediately pressures the bank's profitability metrics. For instance, Guaranty Bancshares, Inc.'s Net Interest Margin (NIM) was reported at 3.70% in Q1 2025, showing the direct impact of pricing competition on the spread between what the bank earns on assets and pays on liabilities. By Q2 2025, the NIM had slightly improved to 3.71%, but large clients demanding better rates remain a constant factor that management must address.
Here is a quick look at the key customer-related metrics from the Q1 and Q2 2025 reporting periods:
| Metric | Value | Reporting Period | Source Context |
|---|---|---|---|
| Net Interest Margin (NIM) | 3.70% | Q1 2025 | Used as requested in outline, data point exists for Q1 2025 |
| Net Interest Margin (NIM) | 3.71% | Q2 2025 | Latest reported NIM |
| Average Deposit Account Balance | $29,622 | Q2 2025 (as of June 30, 2025) | Based on 91,436 total accounts |
| Total Deposit Accounts | 91,436 | Q2 2025 (as of June 30, 2025) | Indicates granularity |
The granular nature of the deposit base is a structural defense against customer power, but the competitive Texas landscape means Guaranty Bancshares, Inc. had to constantly prove its value proposition beyond just rates for its most important commercial relationships.
- High choice due to 212 state-chartered banks in Texas (as of year-end 2024).
- DFW businesses have >150 financial institutions to choose from.
- Low switching costs for commodity products increase leverage.
- Large borrowers can pressure NIM, which was near 3.70% in early 2025.
- Deposit base is granular, with an average balance of $29,622.
Finance: draft a sensitivity analysis on NIM impact if the average deposit balance were to drop by 10% by year-end 2025.
Guaranty Bancshares, Inc. (GNTY) - Porter's Five Forces: Competitive rivalry
You're looking at the competitive landscape Guaranty Bancshares, Inc. faced right up to its merger in late 2025. The rivalry intensity in the 'Banks - Southwest' industry, particularly within Texas, is definitely high. This is a market where scale and deposit gathering are everything, and the big players are consolidating fast.
Guaranty Bancshares, Inc. operated within the highly attractive, high-growth Texas market. As of its last standalone reporting, the company maintained a physical presence with 33 banking locations spread across 26 Texas communities. This footprint covers key regions like East Texas, Dallas/Fort Worth, Houston, and Central Texas.
The surge in bank M&A activity in Texas during 2025 created larger, more formidable competitors. For instance, the announced Fifth Third/Comerica deal, valued at $10.9 billion, is set to create the ninth-largest U.S.-based retail bank with roughly $288 billion in assets. Fifth Third plans to significantly bolster its presence by adding 150 branches in Texas to Comerica's existing 108 branches there. This consolidation trend, which saw 52 bank deals announced in Q3 2025 alone, means Guaranty Bancshares, Inc. was competing against an increasingly concentrated set of larger rivals.
Competition for core deposits is fierce, which directly impacts funding costs. Guaranty Bancshares, Inc.'s total deposits reached $2.71 billion as of June 30, 2025. However, the cost to hold those deposits is a key metric in this rivalry. Here's a quick look at the funding profile just before the acquisition:
| Metric | Value (as of June 30, 2025) |
|---|---|
| Total Deposits | $2.71 billion |
| Noninterest-Bearing Deposits (% of Total) | 31.6% |
| Average Cost of Total Deposits (Q2 2025) | 1.90% |
| Total Deposit Accounts | 91,436 |
| Average Account Balance | $29,622 |
The elevated funding costs in the competitive environment put pressure on margins. To be fair, Guaranty Bancshares, Inc. managed its Net Interest Margin (NIM) well, reporting 3.71% (FTE basis) for Q2 2025, up from 3.26% the prior year. Still, the need to attract and retain deposits against larger, better-capitalized acquirers like Fifth Third, which is aggressively expanding its Texas footprint, defines the rivalry.
The competitive pressures manifest in several ways for a regional player like Guaranty Bancshares, Inc. was:
- Pressure to maintain or grow loan pipeline against larger banks.
- Need to match competitive deposit rates to prevent outflow.
- Competition for talent in key Texas metro markets.
- The necessity of technology upgrades, which favor scale.
- Rivalry with other regional players like Prosperity Bancshares, which also made an acquisition in Texas.
It's important to note that Guaranty Bancshares, Inc. completed its merger with Glacier Bancorp, Inc. on October 1, 2025, meaning the competitive dynamics for the remainder of late 2025 shifted as Guaranty Bank & Trust became a division of Glacier Bank. The Q2 2025 data, showing $10.0 million in net income for the quarter, represents the last full snapshot of the standalone entity's performance before this significant competitive shift.
Guaranty Bancshares, Inc. (GNTY) - Porter's Five Forces: Threat of substitutes
You're looking at how external options could pull funds away from Guaranty Bancshares, Inc. (GNTY) or its loan business. This threat is significant because many non-bank entities offer services that look, feel, and sometimes function better than traditional banking products, especially for customers with large balances.
FinTech companies offer frictionless, specialized services like payment processing and direct lending, bypassing traditional banks. The sheer scale of this sector shows the competitive pressure. The U.S. fintech market size is projected to be valued at US$95.2 Bn in 2025. This market is expected to grow at a Compound Annual Growth Rate (CAGR) of 14.7% through 2032. For Guaranty Bancshares, Inc., the threat is concentrated in areas where FinTech excels, such as payments, where the segment held over 35% of the market share in 2024. Furthermore, neobanking, which represents the digital-only bank segment, is anticipated to experience the fastest growth in the U.S. fintech market, with a CAGR of 21.67% projected from 2025 to 2030.
Money market funds and U.S. Treasuries are attractive substitutes for deposits, especially for the 27.0% of uninsured deposits Guaranty Bancshares, Inc. held as of June 30, 2025. These uninsured funds are the most susceptible to flight to safety or yield-seeking behavior outside the traditional banking system. To give you context on the deposit base facing this substitution risk, as of June 30, 2025, Guaranty Bancshares, Inc. had 91,436 total deposit accounts with an average account balance of $29,622. The industry trend shows that uninsured deposits are still a major factor in deposit flows; in the third quarter of 2025, the U.S. banking industry saw an increase of $88.6 billion in additional uninsured deposits, representing a 1.1% jump from the prior quarter.
Here's a quick look at the deposit structure at Guaranty Bancshares, Inc. as of mid-2025, which highlights the portion exposed to these substitutes:
| Metric | Value for Guaranty Bancshares, Inc. (as of 6/30/2025) | Contextual Data Point |
|---|---|---|
| Uninsured Deposits (% of Total Deposits) | 27.0% | Industry domestic deposits grew 0.5% in Q3 2025. |
| Total Deposit Accounts | 91,436 | Average account balance was $29,622. |
| Noninterest-Bearing Deposits (% of Total Deposits) | 31.6% | DDA balances increased by $7.9 million in Q2 2025. |
Credit unions and non-bank lenders provide loan alternatives with lower regulatory burdens, which can translate to more competitive pricing or faster underwriting for borrowers. While I don't have specific market share data for credit union loan origination versus Guaranty Bancshares, Inc. for late 2025, the overall loan growth environment is relevant. The U.S. banking industry's annual rate of loan growth in Q3 2025 was 4.7%, which is below the pre-pandemic average of 4.9%. This slower growth suggests that non-bank alternatives are capturing a meaningful share of new credit demand.
Digital-only banks and third-party payment platforms offer lower-cost, faster transaction services. This is directly reflected in the dominance of digital payments within the broader FinTech ecosystem. In 2024, digital payments accounted for 47.43% of the U.S. FinTech market share, and the Payments & Transfers segment held 56.3% share in 2024. The expectation for immediacy in transactions puts pressure on traditional banks to match speed and cost efficiency. For instance, Guaranty Bank & Trust, N.A. notes that funds from electronic direct deposits are available on the day they receive the deposit, but check deposits can take longer, up to the ninth business day for some types. This difference in transaction speed is a key area where substitutes compete effectively.
- FinTech companies are projected to drive the U.S. market to US$248.5 Bn by 2032.
- Neobanks, a key digital substitute, are expected to grow at a CAGR of 21.67% through 2030.
- Guaranty Bancshares, Inc.'s uninsured deposits were 27.0% as of June 30, 2025.
- The overall U.S. banking industry saw a 1.1% quarter-over-quarter uptick in uninsured deposits in Q3 2025.
Guaranty Bancshares, Inc. (GNTY) - Porter's Five Forces: Threat of new entrants
You're assessing the competitive landscape for Guaranty Bancshares, Inc., and the threat of new entrants is definitely a mixed bag. Honestly, the barriers to entry are substantial, but the magnetic pull of the Texas market is strong enough to attract determined players.
The threat is best characterized as moderate. On one hand, the regulatory hurdles and capital demands act as a significant moat. Starting a new bank from scratch-a de novo charter-is a long, expensive proposition. For instance, the Texas Department of Banking noted that between 2019 and 2023, only two de novo bank charters were issued in the state, with just one application in process for 2024. Even with a recent conditional approval for a de novo national bank charter in October 2025, the new entity faces enhanced scrutiny for its first three years of operation, including maintaining a minimum 12% Tier 1 leverage ratio.
To give you a sense of the capital environment, while regulators proposed lowering the community bank leverage ratio requirement to 8% from the current 9% in late 2025, the baseline for sound operation remains high. For context on the larger regulatory environment, the enhanced supplementary leverage ratio (eSLR) for bank holding companies was recently finalized at 3%, down from 5%, showing that capital expectations, even when adjusted, are a core focus.
The primary factor pulling new entrants in is the strong Texas economic growth. This growth makes the market highly attractive for both de novo banks and out-of-state institutions looking to establish a beachhead. The state's banking system saw total assets of $452.3 billion across its 212 state-chartered banks as of December 31, 2024. This robust environment has fueled significant M&A activity, which is an alternative, and often faster, form of entry.
The softening federal regulatory view on M&A is actively facilitating entry by acquisition, bypassing the de novo process entirely. Through early November 2025, acquisitions proposed or completed in Texas led the nation, accounting for 21 deals. This activity contrasts sharply with previous years; the U.S. banking M&A market accelerated significantly in Q3 2025 with 46 deals totaling $17.4 billion. This regulatory shift, which has shortened average deal closing times by more than two months compared to 2024, is seen as a finite window by some strategists.
Here's a quick look at how recent Texas-focused deals illustrate this acquisition-based entry:
| Acquirer | Target (Texas Presence) | Deal Value (Approximate) | Entry Type |
|---|---|---|---|
| Fifth Third Bancorp | Comerica Inc. (Dallas-based) | $10.85 billion | Out-of-State Acquisition |
| Huntington Bancshares Inc. | Cadence Bank (Houston presence) | $7.59 billion | Out-of-State Acquisition |
| Prosperity Bancshares | Southwest Bancshares (San Antonio) | $268.9 million in stock | In-State Acquisition |
Finally, any new entrant must be prepared for a high initial investment, particularly in technology and brand building, to effectively challenge an established player like Guaranty Bancshares, Inc. Competing against an institution with total assets of $3.12 billion as of December 31, 2024, requires significant upfront capital deployment. You can't just open a branch and expect traction; you need a modern operational backbone.
Key barriers to consider for a potential new entrant include:
- Regulatory approval timeline for a de novo charter.
- The high cost of technology infrastructure build-out.
- The need for significant initial capital reserves.
- Establishing brand trust against incumbent community banks.
Finance: draft a sensitivity analysis on the impact of a $50 million new entrant's initial capital raise on GNTY's tangible common equity ratio by next Tuesday.
Disclaimer
All information, articles, and product details provided on this website are for general informational and educational purposes only. We do not claim any ownership over, nor do we intend to infringe upon, any trademarks, copyrights, logos, brand names, or other intellectual property mentioned or depicted on this site. Such intellectual property remains the property of its respective owners, and any references here are made solely for identification or informational purposes, without implying any affiliation, endorsement, or partnership.
We make no representations or warranties, express or implied, regarding the accuracy, completeness, or suitability of any content or products presented. Nothing on this website should be construed as legal, tax, investment, financial, medical, or other professional advice. In addition, no part of this site—including articles or product references—constitutes a solicitation, recommendation, endorsement, advertisement, or offer to buy or sell any securities, franchises, or other financial instruments, particularly in jurisdictions where such activity would be unlawful.
All content is of a general nature and may not address the specific circumstances of any individual or entity. It is not a substitute for professional advice or services. Any actions you take based on the information provided here are strictly at your own risk. You accept full responsibility for any decisions or outcomes arising from your use of this website and agree to release us from any liability in connection with your use of, or reliance upon, the content or products found herein.