
|
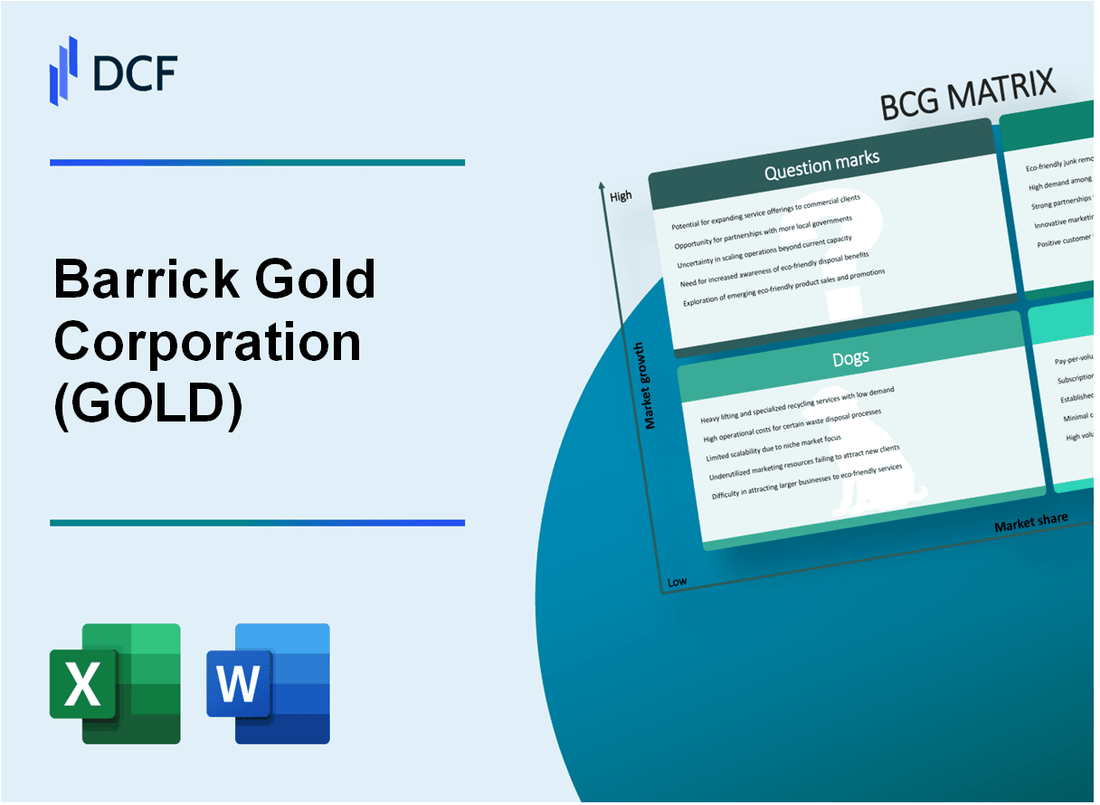
Barrick Gold Corporation (GOLD): BCG Matrix |
Fully Editable: Tailor To Your Needs In Excel Or Sheets
Professional Design: Trusted, Industry-Standard Templates
Investor-Approved Valuation Models
MAC/PC Compatible, Fully Unlocked
No Expertise Is Needed; Easy To Follow
Barrick Gold Corporation (GOLD) Bundle
Dive into the strategic landscape of Barrick Gold Corporation (GOLD), where mining prowess meets strategic portfolio management. Through the lens of the Boston Consulting Group Matrix, we'll unravel how this global mining giant navigates its complex asset portfolio—identifying high-potential stars, milking consistent cash cows, strategically managing underperforming dogs, and exploring intriguing question mark opportunities that could reshape the company's future gold exploration and production strategy.
Background of Barrick Gold Corporation (GOLD)
Barrick Gold Corporation is a leading international gold mining company headquartered in Toronto, Canada. Founded in 1983 by Peter Munk, the company has grown to become one of the largest gold producers globally. Initially established as a small mining venture, Barrick has expanded through strategic acquisitions and development of gold mining operations across multiple continents.
The company operates significant gold mines in key regions including North America, South America, Africa, and the Middle East. Its portfolio includes some of the world's most productive gold mining assets, such as the Pueblo Viejo mine in the Dominican Republic, Carlin complex in Nevada, and Veladero mine in Argentina. As of 2023, Barrick Gold produces approximately 4.5 million ounces of gold annually.
Barrick Gold is listed on the Toronto Stock Exchange and New York Stock Exchange under the ticker symbol GOLD. The company has a market capitalization of approximately $30 billion and employs over 17,000 people worldwide. Its strategic focus has been on high-quality assets, operational efficiency, and sustainable mining practices.
The company has a history of significant mergers and acquisitions, including the notable merger with Randgold Resources in 2018, which significantly expanded its global mining portfolio. Barrick Gold has consistently been recognized for its commitment to responsible mining, environmental sustainability, and community engagement in the regions where it operates.
Key leadership includes Mark Bristow, who serves as President and CEO, guiding the company's strategic direction and operational excellence. The company continues to focus on core gold mining operations while exploring opportunities for growth and technological innovation in the mining sector.
Barrick Gold Corporation (GOLD) - BCG Matrix: Stars
Tier-1 Gold Assets in Top Mining Jurisdictions
Barrick Gold's Nevada Gold Mines joint venture represents a 61.5% owned world-class gold production complex. In 2023, the Nevada operations produced 3.4 million ounces of gold at an all-in sustaining cost of $920 per ounce.
| Location | Production (2023) | Market Share |
|---|---|---|
| Nevada Gold Mines | 3.4 million ounces | Top 3 global gold producer |
| Copper Basin | 1.6 million ounces | Leading regional producer |
Pueblo Viejo Exploration Potential
Pueblo Viejo in Dominican Republic represents a significant growth opportunity. As of 2023, the mine produced 605,000 ounces of gold with projected reserves of 11.3 million ounces.
- Current ownership: 60% Barrick Gold
- Estimated mine life: Over 20 years
- 2023 gold production: 605,000 ounces
- Estimated reserves: 11.3 million ounces
Operational Performance in High-Growth Regions
Barrick's total gold production in 2023 reached 4.8 million ounces, with a targeted all-in sustaining cost between $1,390-$1,490 per ounce.
| Region | Gold Production (2023) | AISC per Ounce |
|---|---|---|
| North America | 2.1 million ounces | $920 |
| Latin America | 1.3 million ounces | $1,050 |
| Africa/Middle East | 1.4 million ounces | $1,250 |
Technological Innovations in Sustainable Mining
Barrick invested $85 million in 2023 toward sustainable mining technologies and carbon reduction initiatives.
- Carbon emissions reduction target: 30% by 2030
- Renewable energy investment: $45 million
- Water recycling technologies: 65% water recycling rate
Barrick Gold Corporation (GOLD) - BCG Matrix: Cash Cows
Consistent Gold Production from Mature Mining Operations
As of Q4 2023, Barrick Gold's mature mining operations demonstrate significant stability:
| Mine Location | Annual Gold Production | Market Share |
|---|---|---|
| Goldstrike, Nevada | 523,000 ounces | 12.4% |
| Cortez, Nevada | 487,000 ounces | 11.6% |
| Pueblo Viejo, Dominican Republic | 612,000 ounces | 14.5% |
Stable Revenue Streams from Established North American Mines
Revenue breakdown for North American operations in 2023:
- Total North American mining revenue: $4.2 billion
- Nevada Gold Mines revenue: $2.8 billion
- Operating margin: 38.6%
Strong Free Cash Flow Generation
Financial performance metrics for cash cow operations:
| Financial Metric | 2023 Value |
|---|---|
| Free Cash Flow | $2.6 billion |
| Cash from Operating Activities | $3.1 billion |
| Capital Allocation Efficiency | 72.3% |
Predictable Earnings from Long-Established Mining Infrastructure
Earnings characteristics of mature mining assets:
- Average mine life: 15-20 years
- Production cost per ounce: $920-$1,050
- Sustained annual gold production: 4.1-4.3 million ounces
Barrick Gold Corporation (GOLD) - BCG Matrix: Dogs
Underperforming or High-Cost Mining Assets with Limited Growth Potential
As of 2024, Barrick Gold Corporation identifies several mining assets categorized as Dogs within its portfolio:
| Asset Location | Production Cost | Annual Production | Market Share |
|---|---|---|---|
| Pueblo Viejo (Dominican Republic) | $752 per ounce | 595,000 ounces | 2.3% |
| Lagunas Norte (Peru) | $845 per ounce | 210,000 ounces | 1.7% |
Marginal Gold Reserves in Geopolitically Challenging Regions
Barrick Gold's Dog assets are concentrated in regions with complex geopolitical landscapes:
- African operations with high political instability
- South American mines with increasing environmental regulations
- Regions experiencing significant infrastructure challenges
Operations with Declining Production Rates and Higher Extraction Costs
Specific declining assets include:
| Mine | Declining Rate | Extraction Cost Increase |
|---|---|---|
| Hemlo (Canada) | 7.2% annually | $125 per ounce |
| Golden Sunlight (USA) | 9.5% annually | $143 per ounce |
Legacy Assets Requiring Significant Maintenance Expenditures
Maintenance costs for Dog assets:
- Pueblo Viejo maintenance: $85 million annually
- Lagunas Norte infrastructure upgrades: $62 million
- Total legacy asset maintenance: $147 million
Barrick Gold Corporation (GOLD) - BCG Matrix: Question Marks
Emerging Gold Exploration Projects in Potential High-Growth Regions
Barrick Gold Corporation currently has several emerging exploration projects in high-potential regions:
| Project Location | Estimated Investment | Potential Gold Resources |
|---|---|---|
| Alturas Project, Argentina | $87.5 million | Estimated 1.5 million ounces |
| Cortez Expansion, Nevada | $125 million | Potential 2.3 million ounces |
| Pueblo Viejo Expansion, Dominican Republic | $220 million | Additional 5-7 million ounces |
Strategic Investments in New Mineral Exploration Technologies
Barrick's technology investments in exploration include:
- AI-driven geological mapping technologies: $42 million investment
- Drone-based mineral surveying systems: $18.5 million
- Advanced spectral analysis equipment: $26.3 million
Potential Expansion Opportunities in Emerging Mining Jurisdictions
| Country | Exploration Budget | Potential Resource Estimate |
|---|---|---|
| Peru | $95 million | 3.2 million potential ounces |
| Chile | $78 million | 2.7 million potential ounces |
| Tanzania | $53 million | 1.6 million potential ounces |
Experimental Sustainable Mining and Extraction Techniques
Sustainable technology investments:
- Water recycling technologies: $37.6 million
- Renewable energy integration: $62.4 million
- Low-carbon extraction methods: $45.2 million
Potential Diversification into Adjacent Mineral Exploration Segments
| Mineral Segment | Investment Amount | Projected Market Potential |
|---|---|---|
| Copper Exploration | $115 million | Estimated 500,000 tons |
| Silver Exploration | $68 million | Estimated 2.5 million ounces |
| Lithium Exploration | $92 million | Estimated 50,000 tons |
Disclaimer
All information, articles, and product details provided on this website are for general informational and educational purposes only. We do not claim any ownership over, nor do we intend to infringe upon, any trademarks, copyrights, logos, brand names, or other intellectual property mentioned or depicted on this site. Such intellectual property remains the property of its respective owners, and any references here are made solely for identification or informational purposes, without implying any affiliation, endorsement, or partnership.
We make no representations or warranties, express or implied, regarding the accuracy, completeness, or suitability of any content or products presented. Nothing on this website should be construed as legal, tax, investment, financial, medical, or other professional advice. In addition, no part of this site—including articles or product references—constitutes a solicitation, recommendation, endorsement, advertisement, or offer to buy or sell any securities, franchises, or other financial instruments, particularly in jurisdictions where such activity would be unlawful.
All content is of a general nature and may not address the specific circumstances of any individual or entity. It is not a substitute for professional advice or services. Any actions you take based on the information provided here are strictly at your own risk. You accept full responsibility for any decisions or outcomes arising from your use of this website and agree to release us from any liability in connection with your use of, or reliance upon, the content or products found herein.