
|
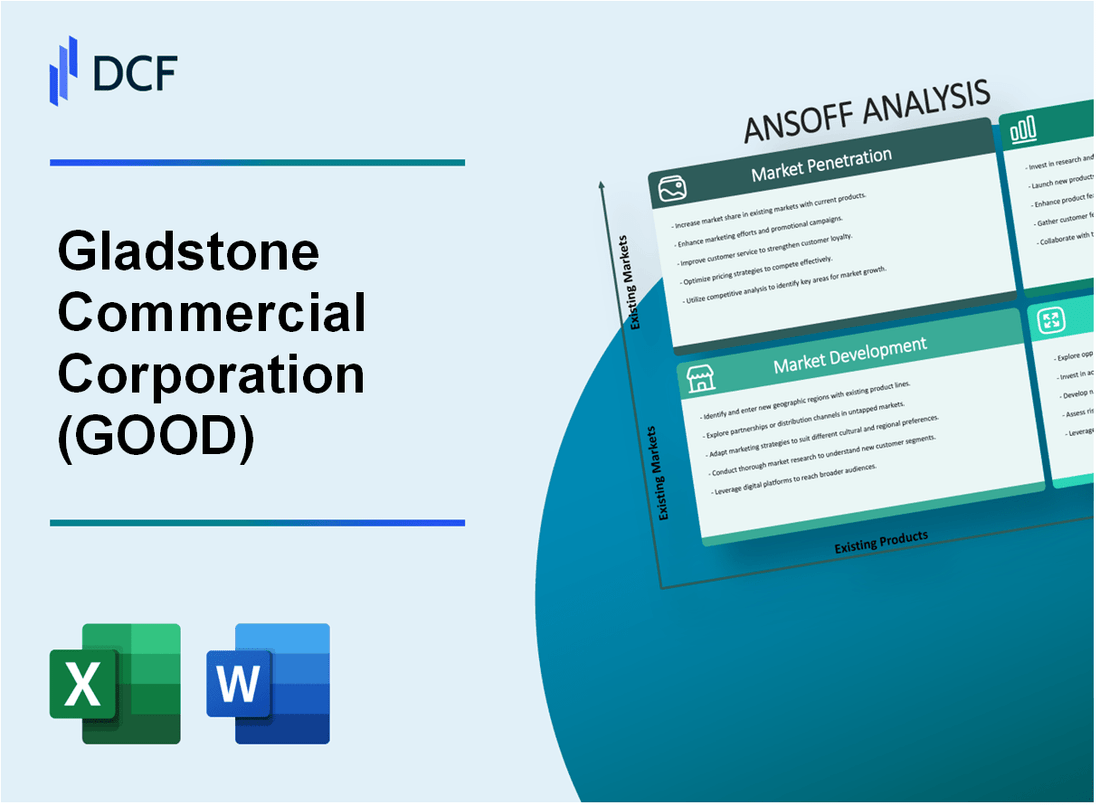
Gladstone Commercial Corporation (GOOD): ANSOFF MATRIX [Dec-2025 Updated] |
Fully Editable: Tailor To Your Needs In Excel Or Sheets
Professional Design: Trusted, Industry-Standard Templates
Investor-Approved Valuation Models
MAC/PC Compatible, Fully Unlocked
No Expertise Is Needed; Easy To Follow
Gladstone Commercial Corporation (GOOD) Bundle
You're looking at Gladstone Commercial Corporation's growth blueprint, and frankly, it's a comprehensive map that balances near-term stability with aggressive future bets. After two decades analyzing real estate plays, I see a clear strategy here: they are first focused on milking their existing industrial portfolio, which is already showing results with same-store lease revenue up 3.1% year-to-date through Q3 2025, by pushing for higher renewals and retention at that 99.1% occupancy rate. But the real story is how they plan to move beyond that core, detailing moves from expanding their industrial footprint into new Western US markets to outright diversification into multi-family and data centers in new Sunbelt states. To make informed decisions, you need to see the specific actions they're taking to deploy capital-like using that $600 million credit facility-across all four quadrants below.
Gladstone Commercial Corporation (GOOD) - Ansoff Matrix: Market Penetration
You're looking at how Gladstone Commercial Corporation is maximizing revenue from its existing industrial and office footprint. This is about squeezing more value from what the company already owns, which is often the safest growth lever.
Gladstone Commercial Corporation is driving revenue through existing leases. Same-store lease revenues increased by 3.1% in the nine months ended September 30 over the same period in 2024. This growth is supported by the ongoing focus on asset management and tenant relationships.
The team is executing proactive lease extensions to lock in current rates and maintain stability. The weighted average lease term stands at a healthy 7.5 years as of September 30, 2025, which is the longest WALT at quarter end since Q1 2020.
To justify rent increases and support tenant needs within the current portfolio, Gladstone Commercial completed leasing activity on 734,464 square feet at 14 of its properties. This activity provided a total straight-line rental increase of $1.1 million. Remaining lease terms on this activity ranged from 0.7 years to 11.4 years.
Tenant retention is paramount to maintaining the high occupancy rate. As of September 30, 2025, the portfolio is 99.1% occupied, which is the highest since Q1 of 2019. This high rate is across a portfolio consisting of 151 properties in 27 states leased to 110 tenants.
Capital recycling is an active part of this strategy, moving capital away from older asset types into improvements for the core industrial base. In Q3 2025, Gladstone Commercial disposed of one noncore industrial property. During Q2 2025, the company sold 60,000 square feet of non-core office property and one non-core office property for $5.1 million. The industrial concentration of the portfolio, as a percentage of annualized straight-line rent, reached 69% as of Q3 2025.
Here are the key operational metrics supporting this market penetration effort as of September 30, 2025:
| Metric | Value |
| Portfolio Occupancy Rate | 99.1% |
| Number of Properties | 151 |
| Weighted Average Remaining Lease Term (WALT) | 7.5 years |
| Same-Store Lease Revenue Increase (YTD 9 months) | 3.1% |
| Total Straight-Line Rental Increase from Leasing Activity | $1.1 million |
| Industrial Concentration (of annualized straight-line rent) | 69% |
The focus on the existing portfolio is also evidenced by the consistent cash collection performance.
- Collected 100% of cash base rents from tenants through the period ending June 30, 2025.
- Collected 100% of cash rents due during Q3 2025.
- Collected 100% of the first three quarters' cash rents and 100% of October cash rents as of November 3, 2025.
The company is managing its debt profile to support these internal strategies, with its net debt to gross assets ratio at 47.4% as of Q3 2025. The weighted average interest rate on mortgage debt was 4.22%.
Finance: draft 13-week cash view by Friday.
Gladstone Commercial Corporation (GOOD) - Ansoff Matrix: Market Development
Market Development for Gladstone Commercial Corporation centers on expanding its geographic footprint and tenant industry base, utilizing its enhanced capital structure to secure new, net-leased industrial assets.
The current operational footprint for Gladstone Commercial Corporation spans 27 states as of June 30, 2025, encompassing 143 properties. By September 30, 2025, this had grown slightly to 151 properties. A key action here is targeting new, high-growth US states outside this existing base to increase market penetration and reduce regional concentration risk.
Diversification of the tenant base is another critical element. As of the third quarter of 2025, Gladstone Commercial Corporation served tenants across 20 industries. The strategy involves targeting new tenant industries beyond these existing 20 sectors, with a specific focus on sectors like e-commerce logistics, which often align well with industrial property demand.
The increased financial capacity directly supports this expansion. On October 14, 2025, Gladstone Commercial Corporation upsized its syndicated revolving credit and term loan facility to $600 million, with an option to increase the total facility to $850 million. This involved up-sizing the revolving credit facility by $75 million and the aggregate term loan component by $50 million. This $600 million facility provides the necessary liquidity to fund acquisitions in new secondary growth markets.
Geographic expansion is specifically targeting the Western US for industrial properties. This aligns with the company's ongoing shift toward industrial assets, which represented 67% of annualized straight-line rent as of June 30, 2025. The first half of 2025 saw $152.2 million invested in four industrial acquisitions totaling 874,871 square feet.
Leveraging the net-lease structure is essential for attracting credit-worthy tenants in these new regions with favorable, long-term lease commitments. The average remaining lease term across the portfolio stood at 7.5 years as of September 30, 2025. This structure is evidenced in recent deals, such as the acquisition of a 693,236 square foot industrial portfolio for $54.5 million (or $54.8 million in another report) secured by a 20-year lease term.
Here's a quick look at the capital structure supporting this growth:
| Metric | Value as of Q3 2025 (Sep 30, 2025) | Related Action/Date |
| Total Credit Facility Size | $600 million | Upsized October 14, 2025 |
| Potential Facility Upside | $250 million | Total potential facility of $850 million |
| Revolving Credit Upsize | $75 million | Part of the $600 million facility increase |
| Term Loan Upsize | $50 million | Part of the $600 million facility increase |
| Portfolio Properties | 151 properties | As of September 30, 2025 |
| Geographic Footprint | 27 states | As of June 30, 2025 |
| Tenant Sectors | 20 industries | As of September 30, 2025 |
The company's recent industrial acquisitions highlight the focus on long-term contracts:
- Industrial portfolio acquisition cost: $54.5 million
- Industrial portfolio square footage: 693,236 square feet
- Weighted average lease term on H1 2025 acquisitions: 14.3 years
- Lease term on recent industrial portfolio: 20 years
- Average remaining portfolio lease term: 7.5 years
The extension of the revolving credit facility maturity to October 2029 and Term Loan A to October 2029 provides a stable debt maturity profile to support these multi-year geographic and asset-type development plans. Finance: model the acquisition yield on the $54.5 million portfolio against the cost of capital from the new credit facility by next Tuesday.
Gladstone Commercial Corporation (GOOD) - Ansoff Matrix: Product Development
Gladstone Commercial Corporation is actively developing its product offering within its existing industrial markets, focusing on enhancing asset value for current tenants and strategically repositioning non-core holdings.
- Offer build-to-suit development services for existing tenants in current industrial markets.
Gladstone Commercial Corporation is committed to growing its industrial concentration and adding value on its existing portfolio through strategic capital investments and extensions. The company supported tenant growth through targeted expansions and capital improvement initiatives. The industrial concentration reached 69% of annualized straight-line rents as of the third quarter of 2025, up from 63% at the start of the year.
- Invest in specialized industrial sub-sectors like cold storage or data center shell space within current states.
The strategy involves growing the industrial portfolio with accretive real estate. Year-to-date acquisitions through the third quarter of 2025 totaled $206 million, including a 6-facility industrial manufacturing portfolio acquired in Q3 for $54.5 million. The company operates in 27 states as of September 30, 2025.
- Reposition non-core office properties into alternative uses like flex-industrial space in existing submarkets.
The company is actively recycling non-core assets. Through the first half of 2025, Gladstone Commercial Corporation sold 60,000 square feet of non-core office property. Management noted active plans for office repositioning in Austin. Conversely, the company completed the sale of 676,031 square feet of non-core industrial property in the first half of 2025, and an additional non-core industrial property sale for $3.0 million in the third quarter of 2025.
- Develop a capital partnership program to fund tenant-specific expansions at existing sites.
The focus is on supporting tenant growth through strategic capital investments. In the first half of 2025, Gladstone Commercial Corporation renewed leases covering 67,709 square feet of industrial space and 55,308 square feet of office space across the portfolio. The weighted average lease term across the portfolio stood at 7.5 years as of September 30, 2025.
- Introduce short-term, flexible lease products for a small portion of the portfolio to capture new market demand.
While the weighted average lease term is 7.5 years, the company is focused on improving the overall quality of the portfolio. The portfolio occupancy rate reached 99.1% in Q3 2025. Total operating revenues for the third quarter of 2025 were $40.8 million, a 4.2% increase compared to the third quarter of 2024.
The current portfolio metrics as of September 30, 2025, reflect the ongoing product evolution:
| Metric | Value | Period/Date |
| Total Assets | $1,265 million | September 30, 2025 |
| Industrial Concentration (Annualized Rents) | 69% | Q3 2025 |
| Total Properties | 151 | September 30, 2025 |
| Portfolio Occupancy | 99.1% | Q3 2025 |
| Weighted Average Lease Term | 7.5 years | Q3 2025 |
| Q3 2025 Total Operating Revenue | $40.8 million | Q3 2025 |
| Q3 2025 Core FFO per Share | $0.35 | Q3 2025 |
The company raised net proceeds of $61 million from selling 4.4 million shares of common stock under its ATM program during the 9 months ended September 30, 2025, which supports capital deployment for new asset acquisition and portfolio enhancement.
Gladstone Commercial Corporation (GOOD) - Ansoff Matrix: Diversification
You're looking at how Gladstone Commercial Corporation (GOOD) might expand beyond its established industrial and office net-leased portfolio, which is a classic Diversification move on the Ansoff Matrix. This means entering a new market with a new asset class or a new line of business entirely.
As of September 30, 2025, Gladstone Commercial Corporation's foundation for any new venture rests on its existing scale. The company's total assets stood at $1,265 million, supporting a portfolio of 151 properties across 27 states. The gross asset base was reported as $1.8 billion as of that same date. The current portfolio maintains a high occupancy of 99.1% with an average remaining lease term of 7.5 years.
Enter the multi-family residential market in new, high-growth Sunbelt states, a new asset class entirely.
Moving into multi-family residential represents a significant shift from the current focus, where industrial properties accounted for 69% of annualized straight-line rent as of Q3 2025. This strategy would require deploying capital outside the existing industrial underwriting expertise.
Acquire and develop mission-critical data center properties in new, high-power-availability regions.
While Gladstone Commercial Corporation is currently focused on industrial assets, the broader market context shows massive capital deployment in this sector. For instance, data center development financing in 2025 is projected to involve roughly $170 billion in asset value needing financing globally. The global hyperscale data center market is expected to grow at a CAGR of 9.58% from 2024 to 2030. One example of a major project in the US involves an investment of $2 billion for a Google Data Center in Indiana, with a timeline spanning 2024-2025.
Explore international expansion, starting with net-leased industrial assets in Canada or Mexico.
This would be a Market Development move for the existing asset class. The current portfolio is spread across 27 states in the US. International expansion would introduce new regulatory and currency risks to the existing net-leased industrial strategy.
Form a joint venture to develop renewable energy infrastructure on excess land at existing or new industrial sites.
This diversification involves creating a new revenue stream, potentially through a joint venture structure. The current industrial portfolio has an occupancy rate of 99.8% for industrial assets, suggesting limited immediate excess land, but new acquisitions could present opportunities for such development.
Utilize the $1,265 million in total assets to secure financing for a new, non-REIT operating business line.
The capacity to secure financing is supported by the $1,265 million in total assets reported as of September 30, 2025. The company's net debt to gross assets ratio was 47.4% as of Q3 2025, indicating available capacity on the balance sheet. The Q3 2025 period saw net proceeds of $23.0 million raised through the at-the-market program alone.
Here is a snapshot of the current portfolio metrics that underpin the diversification capacity:
| Metric | Value (As of Q3 2025) |
| Total Assets | $1,265 million |
| Gross Asset Base | $1.8 billion |
| Properties Owned | 151 |
| Total Tenants | 110 |
| Overall Portfolio Occupancy | 99.1% |
| Industrial Concentration (% of ALR) | 69% |
| Average Remaining Lease Term | 7.5 years |
| Q3 2025 Total Operating Revenue | $40.84 million |
Disclaimer
All information, articles, and product details provided on this website are for general informational and educational purposes only. We do not claim any ownership over, nor do we intend to infringe upon, any trademarks, copyrights, logos, brand names, or other intellectual property mentioned or depicted on this site. Such intellectual property remains the property of its respective owners, and any references here are made solely for identification or informational purposes, without implying any affiliation, endorsement, or partnership.
We make no representations or warranties, express or implied, regarding the accuracy, completeness, or suitability of any content or products presented. Nothing on this website should be construed as legal, tax, investment, financial, medical, or other professional advice. In addition, no part of this site—including articles or product references—constitutes a solicitation, recommendation, endorsement, advertisement, or offer to buy or sell any securities, franchises, or other financial instruments, particularly in jurisdictions where such activity would be unlawful.
All content is of a general nature and may not address the specific circumstances of any individual or entity. It is not a substitute for professional advice or services. Any actions you take based on the information provided here are strictly at your own risk. You accept full responsibility for any decisions or outcomes arising from your use of this website and agree to release us from any liability in connection with your use of, or reliance upon, the content or products found herein.