
|
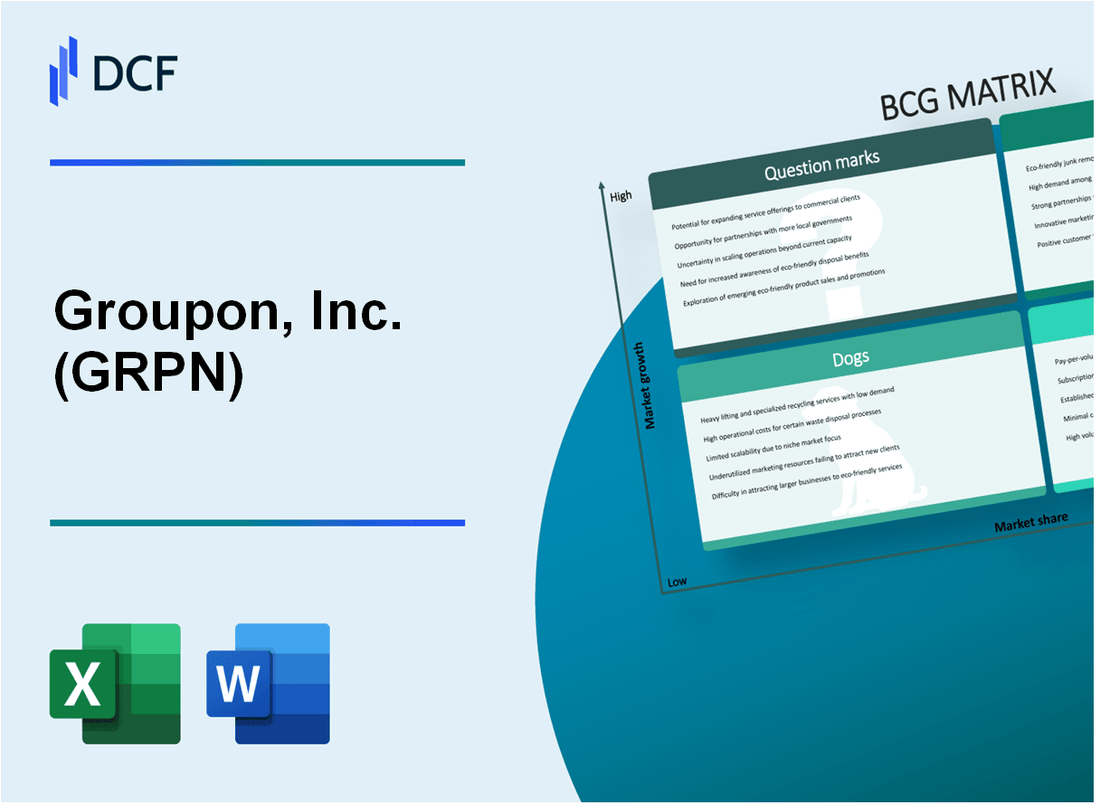
Groupon, Inc. (GRPN): BCG Matrix [Dec-2025 Updated] |
Fully Editable: Tailor To Your Needs In Excel Or Sheets
Professional Design: Trusted, Industry-Standard Templates
Investor-Approved Valuation Models
MAC/PC Compatible, Fully Unlocked
No Expertise Is Needed; Easy To Follow
Groupon, Inc. (GRPN) Bundle
Honestly, looking at Groupon, Inc. (GRPN) through the BCG lens reveals a company at a critical fork in the road, and you need to see where the money is actually being made versus where it's being lost. The North America Local business is definitely the engine, acting as a Star with 18% growth and a Cash Cow generating $17.5 million in positive Adjusted EBITDA in Q3 2025, but that domestic success is fighting against the tide of the International segment, which is a clear Dog shrinking 3% to $26.8 million. Furthermore, major Question Marks like AI integration are demanding capital, leading to a negative $24.6 million Free Cash Flow, so let's dive into the specifics of which units deserve investment and which ones are dragging down the whole portfolio.
Background of Groupon, Inc. (GRPN)
You're looking at Groupon, Inc. (GRPN) as of late 2025, and the story is one of mixed results as the company pushes forward with its marketplace transformation. Honestly, the recent numbers from the third quarter ended September 30, 2025, show clear operational momentum in key areas, even if the bottom line is still showing strain. Groupon, Inc. operates as a trusted local marketplace connecting consumers with services and experiences.
For the third quarter of 2025, Groupon posted a global revenue of $122.8 million, which was a 7% increase compared to the prior year period. Global billings, which represent the total value of customer purchases, grew even stronger at 11% year-over-year, reaching $416.1 million. This growth is being driven by the core Local category, where billings specifically jumped 18% in North America.
The company's active customer base also expanded, reaching 16.1 million as of September 30, 2025, a 4% increase from the year before. This focus on customer acquisition and platform modernization is central to CEO Dusan Senkypl's strategy to make Groupon the destination for high-quality local experiences. The gross profit for the quarter was $111.8 million, marking a 9% year-over-year improvement, which suggests better margins on the transactions they are processing.
However, the financial picture isn't entirely rosy. Despite the revenue and billings growth, Groupon reported a significant net loss from continuing operations of $(117.8) million for Q3 2025. This contrasts sharply with the net income of $14.5 million reported in the third quarter of 2024. Furthermore, the company experienced negative operating cash flow from continuing operations of $(20.5) million, leading to a negative free cash flow of $(24.6) million for the quarter.
Segment-wise, North America remains the engine, with North America Local revenue up 12%. The International segment saw its revenue decline by 3%, though management noted that excluding the recent divestiture of the Giftcloud subsidiary, International Local revenue actually increased by 8%. As of the end of Q3 2025, Groupon held cash and cash equivalents totaling $238.5 million on its balance sheet.
The strategic emphasis is definitely on the marketplace transformation, pushing for higher-quality local experiences and platform upgrades, including integrated ticketing. This focus is intended to drive sustainable growth, even as the company works through the profitability challenges evident in the net loss figures. It's a classic case of investing for future market share.
Groupon, Inc. (GRPN) - BCG Matrix: Stars
You're looking at the segments of Groupon, Inc. (GRPN) that are dominating their growing markets, which is where the Stars quadrant lives. These areas demand investment to maintain their lead, but they are the engine for future Cash Cows. The North America Local segment is definitely showing this high-growth, high-share profile, with its billings growing a strong 18% year-over-year in Q3 2025.
The Things To Do (TTD) vertical is a key driver here, marking its seventh consecutive quarter of strong double-digit growth and outpacing industry growth during the summer season. This momentum is supported by aggressive customer acquisition efforts in the region.
Here are the key statistical markers for this high-potential area as of Q3 2025:
- North America Local billings growth: 18% year-over-year.
- Net new active customers added in Q3 2025: Nearly 300,000.
- Total active customers as of September 30, 2025: 16.1 million, a 4% increase year-over-year.
- Total active customers added over the last four quarters (excluding Italy): Over 1 million.
- Core Local category (Global) represents 89% of total billings and grew 18% year-over-year.
To give you a clearer picture of the core market strength, look at the North America segment results:
| Metric | Value (Q3 2025) | Year-over-Year Change |
| North America Local Billings | $293.8 million | Up 18% |
| North America Local Revenue | $91.6 million | Up 12% |
| North America Active Customers | 11.0 million | Up 8% |
| North America Gross Billings | $319.1 million | Up 16% |
The investment in platform modernization efforts is translating into tangible operational improvements, which helps sustain this Star status. For instance, deal page conversion rates in North America improved by 13% year-over-year. This acceleration in platform velocity means faster development cycles and higher quality releases, which is exactly what you want when you are leading a high-growth market segment. The operating income for the quarter was $2.2 million, and Adjusted EBITDA reached $17.5 million. You should note that cash and cash equivalents stood at $238.5 million at the end of the quarter, even though free cash flow was negative $24.6 million for Q3 2025, reflecting ongoing investment.
Groupon, Inc. (GRPN) - BCG Matrix: Cash Cows
You're looking at the core engine of Groupon, Inc. (GRPN) operations, the segment that generates the necessary surplus to fund riskier ventures. These are the high market share assets operating in a mature, low-growth environment, and defintely they are the bedrock of the current financial structure.
The North America Local segment exemplifies this Cash Cow status. Its revenue stream is stable, providing predictable cash flow that the company relies on for overhead and strategic maintenance. For instance, North America Local revenue hit $91.6 million in Q3 2025, showing consistent, if not explosive, top-line contribution from the established base.
The profitability profile of this core business is exceptional, which is the hallmark of a true Cash Cow. The high gross profit margin, which was reported at 90.2% in Q1 2025 for the core business, translates directly into substantial cash generation from every dollar of revenue recognized. This high margin allows Groupon, Inc. (GRPN) to maintain its position without heavy promotional spending.
This operational strength is reflected in the bottom line before non-cash items. Adjusted EBITDA was positive at $17.5 million in Q3 2025, confirming that the underlying business units are successfully funding themselves and contributing positively to operating cash flow, even as the company manages significant corporate financing activities.
The competitive advantage here is built on scale and incumbency. The established merchant network and brand recognition in the US maintain a high relative market share, making it difficult for new entrants to capture meaningful volume in this space. We can map the operational performance metrics that support this categorization:
| Metric Category | Value | Period |
| North America Local Revenue | $91.6 million | Q3 2025 |
| Core Business Gross Profit Margin | 90.2% | Q1 2025 |
| Adjusted EBITDA | $17.5 million | Q3 2025 |
| North America Local Billings Growth (YoY) | 18% | Q3 2025 |
Because the market growth is low, the strategy shifts from aggressive expansion to efficiency and maintenance. Investments here are targeted to 'milk' the gains passively or improve infrastructure to lower the cost to serve, thereby increasing the cash extraction rate. You should expect capital allocation here to focus on sustaining productivity rather than high-risk growth bets.
The primary actions associated with managing these Cash Cows involve maintaining the status quo and optimizing the cash conversion cycle. Here are the key operational characteristics supporting this quadrant placement:
- Maintain high relative market share in the US.
- Invest low in promotion/placement for mature segments.
- Focus infrastructure spend on efficiency gains.
- Generate cash to cover corporate administrative costs.
- Fund research and development activities.
Groupon, Inc. (GRPN) - BCG Matrix: Dogs
You're looking at the parts of Groupon, Inc. that just aren't pulling their weight in the current market, the classic Dogs of the BCG Matrix. These are the areas with low market share in markets that aren't growing much, and honestly, they tie up capital that could be better used elsewhere. For Groupon, Inc., the International segment clearly fits this profile based on recent performance.
The International segment revenue declined by 3% year-over-year to reach $26.8 million in the third quarter of 2025. That's a clear signal of low growth and poor relative performance compared to the North America segment's double-digit growth. Furthermore, the customer base in this region is shrinking; international active customers fell to 5.1 million, representing a 4% decrease year-over-year as of September 30, 2025. When you see both revenue and customer counts moving backward, you know you're dealing with a Dog that needs immediate attention, usually in the form of divestiture or aggressive cost-cutting.
Here's a quick look at the key metrics defining this segment as a Dog in Q3 2025:
| Metric | Value (Q3 2025) | Year-over-Year Change |
| International Revenue | $26.8 million | -3% |
| International Active Customers | 5.1 million | -4% |
| International Gross Billings | $97.0 million | -1% |
Management is actively working to shed these low-return units, which is the textbook move for a Dog. This strategy involves exiting non-core markets and streamlining operations to stop the cash drain. You can see this play out in specific actions Groupon, Inc. has taken recently.
- Exiting non-core markets, including the divestiture of Giftcloud in April 2025.
- Withdrawal from the Italy market, which has weighed on headline international figures.
This aligns with the broader corporate strategy to reduce reliance on lower-margin offerings, which are also candidates for the Dog quadrant. For instance, even within the stronger North America segment, the Goods category-historically lower margin than Local-continued to shrink significantly. North America Goods billings were down 37.9% in Q2 2025, showing the company is proactively pruning these less profitable areas. Expensive turn-around plans for these types of units rarely work out; it's usually better to cut bait and redeploy that capital into Stars or promising Question Marks.
Groupon, Inc. (GRPN) - BCG Matrix: Question Marks
You're looking at the parts of Groupon, Inc. (GRPN) that are burning cash now but hold the promise of future market leadership-the classic Question Marks. These are the business units operating in high-growth areas but where Groupon, Inc. still has a relatively small slice of the pie. They demand heavy investment to capture that growth before they stagnate and become Dogs.
The Beauty & Wellness vertical is one such area. While it's described as a high-margin focus, the narrative suggests it still lags the growth seen in the Things To Do vertical. The CEO noted that the Things To Do vertical outpaced industry growth during the summer season, which is the high-growth market we are targeting for these Question Marks. This focus on experiences, while driving volume, often comes with a lower take rate, which is a key characteristic of a unit needing heavy investment to scale profitability.
The financial reality of these high-potential bets is clear in the third quarter of 2025 results. Groupon, Inc. posted a significant net loss from continuing operations of $117.8 million for Q3 2025, a stark contrast to the net income of $14.5 million in the prior year period. This loss consumes capital that could otherwise be used elsewhere.
The cash drain is also evident in the Free Cash Flow (FCF) metric. For Q3 2025, the company reported a negative Free Cash Flow (FCF) of negative $24.6 million. This negative FCF, coupled with operating cash flow from continuing operations being negative $20.5 million for the same quarter, confirms these units require external or existing cash reserves to fund their growth initiatives. You need to decide quickly: invest heavily or divest.
Here's a quick look at the Q3 2025 snapshot that frames this Question Mark category:
| Metric | Value (Q3 2025) |
| Global Revenue | $122.8 million |
| Net Loss from Continuing Operations | -$117.8 million |
| Free Cash Flow (FCF) | -$24.6 million |
| Gross Profit | $111.8 million |
| Active Customers | 16.1 million |
The strategic bets Groupon, Inc. is making to turn these Question Marks into Stars are resource-intensive. We are talking about AI integration and hyper-local scaling. These are high-cost, high-potential strategic bets where the returns are still unproven. The company is increasing marketing spend to drive adoption, as marketing expense represented 37% of gross profit in Q3 2025, up from 35% in the prior year period.
The core challenge for these Question Marks is the need for rapid market share gain. If the investment in AI and scaling doesn't quickly translate into higher margins or dominant market share in the growing local experiences space, these units will simply become cash-draining Dogs. The path forward requires aggressive capital deployment to build a defensible position.
The key operational indicators supporting the high-growth market thesis include:
- North America Local revenue growth of 12% year-over-year in Q3 2025.
- Global billings growth of 11% in Q3 2025.
- Addition of nearly 300,000 net new active customers in the quarter.
- The company is actively managing its capital structure, having issued $244.1 million of new convertible senior notes due 2030 during the year.
Finance: draft 13-week cash view by Friday.
Disclaimer
All information, articles, and product details provided on this website are for general informational and educational purposes only. We do not claim any ownership over, nor do we intend to infringe upon, any trademarks, copyrights, logos, brand names, or other intellectual property mentioned or depicted on this site. Such intellectual property remains the property of its respective owners, and any references here are made solely for identification or informational purposes, without implying any affiliation, endorsement, or partnership.
We make no representations or warranties, express or implied, regarding the accuracy, completeness, or suitability of any content or products presented. Nothing on this website should be construed as legal, tax, investment, financial, medical, or other professional advice. In addition, no part of this site—including articles or product references—constitutes a solicitation, recommendation, endorsement, advertisement, or offer to buy or sell any securities, franchises, or other financial instruments, particularly in jurisdictions where such activity would be unlawful.
All content is of a general nature and may not address the specific circumstances of any individual or entity. It is not a substitute for professional advice or services. Any actions you take based on the information provided here are strictly at your own risk. You accept full responsibility for any decisions or outcomes arising from your use of this website and agree to release us from any liability in connection with your use of, or reliance upon, the content or products found herein.